
Galaxy Zoo Continues to Evolve
Over the years the public has seen more than a million galaxies via Galaxy Zoo, and nearly all of them had something in common: we tried to get as close as possible to showing you what the galaxy would actually look like with the naked eye if you were able to see them with the resolving power of some of the world’s most advanced telescopes. Starting today, we’re branching out from that with the addition of over 70,000 new galaxy images (of some our old favorites) at wavelengths the human eye wouldn’t be able to see.
Just to be clear, we haven’t always shown images taken at optical wavelengths. Galaxies from the CANDELS survey, for example, are imaged at near-infrared* wavelengths. But they are also some of the most distant galaxies we’ve ever seen, and because of the expansion of the universe, most of the light that the Hubble Space Telescope (HST) captured for those galaxies had been “stretched” from its original optical wavelength (note: we call the originally emitted wavelength the rest-frame wavelength).
Optical light provides a huge amount of information about a galaxy (or a voorwerpje, etc.), and we are still a long way from having extracted every bit of information from optical images of galaxies. However, the optical is only a small part of the electromagnetic spectrum, and the other wavelengths give different and often complementary information about the physical processes taking place in galaxies. For example, more energetic light in the ultraviolet tells us about higher-energy phenomena, like emission directly from the accretion disk around a supermassive black hole, or light from very massive, very young stars. As a stellar population ages and the massive stars die, the older, redder stars left behind emit more light in the near-infrared – so by observing in the near-IR, we get to see where the old stars are.
The near-IR has another very useful property: the longer wavelengths can mostly pass right by interstellar dust without being absorbed or scattered. So images of galaxies in the rest-frame infrared can see through all but the thickest dust shrouds, and we can get a more complete picture about stars and dust in galaxies by looking at them in the near-IR.

Even though the optical SDSS image (left) is deeper than the near-IR UKIDSS image (right), you can still see that the UKIDSS image is less affected by the dust lanes seen at left.
Starting today, we are adding images of galaxies taken with the United Kingdom Infrared Telescope (UKIRT) for the recently-completed UKIDSS project. UKIDSS is the largest, deepest survey of the sky at near-infrared wavelengths, and the typical seeing is close to (often better than) the typical seeing of the SDSS. Every UKIDSS galaxy that we’re showing is also in SDSS, which means that volunteers at Galaxy Zoo will be providing classifications for the same galaxies in both optical and infrared wavelengths, in a uniform way. This is incredibly valuable: each of those wavelength ranges are separately rich with information, and by combining them we can learn even more about how the stars in each galaxy have evolved and are evolving, and how the material from which new stars might form (as traced by the dust) is distributed in the galaxy.

1 galaxy, 4 redshifts.
In addition to the more than 70,000 UKIDSS near-infrared images we have added to the active classification pool, we are also adding nearly 7,000 images that have a different purpose: to help us understand how a galaxy’s classification evolves as the galaxy gets farther and farther away from the telescope. To that end, team member Edmond Cheung has taken SDSS images of nearby galaxies that volunteers have already classified, “placed” them at much higher redshifts, then “observed” them as we would have seen them with HST in the rest-frame optical. By classifying these redshifted galaxies**, we hope to answer the question of how the classifications of distant galaxies might be subtly different due to image depth and distance effects. It’s a small number of galaxies compared to the full sample of those in either Galaxy Zoo: Hubble or CANDELS, but it’s an absolutely crucial part of making the most of all of your classifications.
As always, Galaxy Zoo continues to evolve as we use your classifications to answer fundamental questions of galaxy evolution and those answers lead to new and interesting questions. We really hope you enjoy these new images, and we expect that there will soon be some interesting new discussions on Talk (where there will, as usual, be more information available about each galaxy), and very possibly new discoveries to be made.
Thanks for classifying!
* “Infrared” is a really large wavelength range, much larger than optical, so scientists modify the term to describe what part of it they’re referring to. Near-infrared means the wavelengths are only a bit too long (red) to be seen by the human eye; there’s also mid-infrared and far-infrared, which are progressively longer-wavelength. For context, far-infrared wavelengths can be more than a hundred times longer than near-infrared wavelengths, and they’re closer in energy to microwaves and radio waves than optical light. Each of the different parts of the infrared gives us information on different types of physics.
** You might notice that these galaxies have a slightly different question tree than the rest of the galaxies: that’s because, where these galaxies have been redshifted into the range where they would have been observed in the Galaxy Zoo: Hubble sample, we’re asking the same questions we asked for that sample, so there are some slight differences.
Top Image Credits and more information: here.
Oh, Sweet Spiral Of Mine

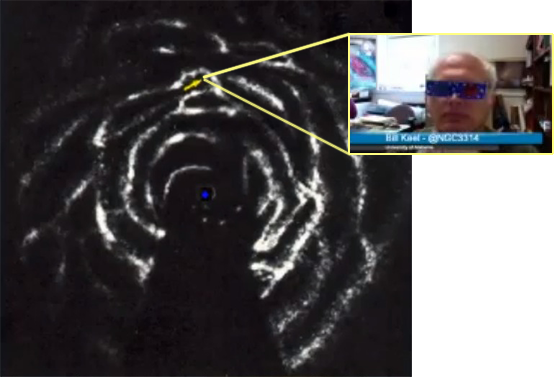
See the video of our latest hangout here (or, if you prefer, click to download the podcast version):
Spiral galaxies are seemingly endless sources of fascination, perhaps because they’re so complex and diverse. But why does spiral structure exist? Why do some spiral galaxies have clearly defined spiral arms and others have flocculent structure that barely seems to hold together? What’s the difference between a 2-arm spiral and a 3-arm spiral? How many kinds of spirals do we actually observe? And what is happening to the stars and gas in spiral galaxy disks?
.")
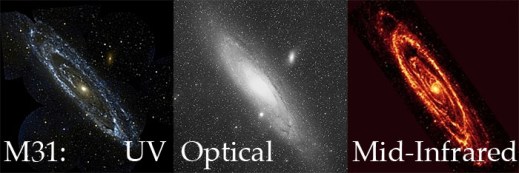
Clockwise from top right: X-ray, UV, optical, near-IR, mid-IR, far-IR, radio
All of the above questions are related to a question we got right at the end of our last hangout: what is the significance of the number of spiral arms? Determining how many spiral arms a galaxy has is hard, and is often subjective — so why bother?
It’s a good question. Part of the reason spiral arm classification & count is a challenge is that it often depends on the wavelength at which you observe a galaxy. New stars tend to form along the spiral arms, whereas older stars have time to spread out into more uniform orbits. So ultraviolet observations of a galaxy, which tend to pick out the new and bright stars, often highlight the spiral arms much more strongly than longer-wavelength observations, which see more light from older stars.
It’s not quite that simple, though. As you get to longer and longer wavelengths, you start to pick up the heat radiated by clouds of gas and dust, which are often stellar nurseries — and often trace spiral arms. At a wavelength of 21 centimeters you can detect neutral Hydrogen, which provides raw material for the cooling and condensation of gas into cold, dense molecular clouds that form stars in their densest pockets. Each wavelength you observe at provides a glimpse at a different targeted feature of a spiral galaxy.
A map of neutral Hydrogen in the Milky Way — complete with yellow “you are here” arrow.
Including our own, of course: we live in a spiral galaxy (though how many arms it has, and whether it’s flocculent, is a matter of debate), and it provides the best means of studying star formation up close. When studying other galaxies, it’s easy to get caught up in the race to discover the biggest, the smallest, the farthest and the most extreme, and forget that our own Universal neighborhood is pretty amazing too.

Herschel sees much longer wavelengths than HST, so its resolution isn’t as high even though it has a bigger mirror. (Click to see a larger version.) Credit: ESA/NASA
For example, one of the most famous nebulae in the world was recently imaged by one of the most famous telescopes in the world — again — but this time in the near-infrared. The Horsehead Nebula is a well-known feature in the Orion star-forming complex, and the new Hubble images provide a great opportunity to learn even more about this region that has been studied for hundreds of years. How thick and cold is the gas and dust in the nebula? How long will it take for it to dissipate under the harsh radiation of the bright, young stars near it? What’s going on behind it?
The near-infrared view from HST is sort of the sweet spot in this spectacular space — the wavelengths aren’t so long that the resolution suffers, but they are long enough that you see through a bit more of the clouds than in the optical. So you see more of the structure of the cloud itself, and more of where it’s thin and thick. If you zoom in, you can even see distant galaxies peeking through! And not just on the edges: in some parts you can see galaxies through the middle of the nebula. Wow. This image alone contains spiral galaxy insights big and small, near and far, from the very distant universe and right in our own backyard.
Note: right at the end of the hangout, we again got another great question from a viewer that we didn’t have time to answer. So stay tuned for the next hangout when we just might have a thing or two to say about dark matter, dark energy and new projects!
Seeing mergers in a different light
Hello,
My name is Alfredo and I’m a Ph.D. student at Imperial College London. I’ve been asked to write a blog about how we take an idea and turn it into a paper, showing exactly what the man behind the scene does.
I’m working with galaxy mergers so the field from which we are going to pluck our idea has to be that one. Merger properties have been described extremely well by the Galaxy Zoo team, which used the Sloan Digital Sky Survey optical data so we thought it might be interesting looking at the GZ merger catalogue in different wavelengths, specifically in the infrared.
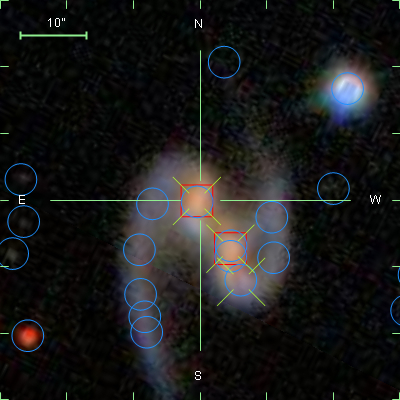
You can study pretty much every object in the infrared because what we call heat is simply the emission of infrared light. If you can measure it’s temperature then it radiates in the infrared. In astronomy infrared radiation allow us to see objects that are not too bright in the visible spectrum (cold stars, gas clouds), to probe regions that are obscure in the optical and to explore the early Universe. Our project will use the infrared fluxes to extrapolate interesting characteristics, mostly to do with the star formation process of the galaxies.

In the past, a huge number of papers have shown that galaxies which were very bright in the infrared ( called LIRGs – Luminous infrared galaxies, U(ltra)LIRGs and H(yper)LIRGs) were mostly mergers or post-mergers. We are going in the opposite direction: since we have a strong visually selected merger catalogue, thanks to your hard work, we can now see what’s the real connection between mergers and warm galaxies.
