
Letting Things Slide: A New Trial Interface for Expressing Uncertainty
“How many spiral arms are in the image – is it two or three? Is that a disk viewed edge-on? I think so, but I’m not quite sure…” If you’ve interacted with Galaxy Zoo before, you may have asked yourself questions like these. Real galaxy images can be confusing. You may be uncertain!
Until now, you have always had to make a choice. There was no way to express uncertainty in your annotations. But now there is! Try it here.
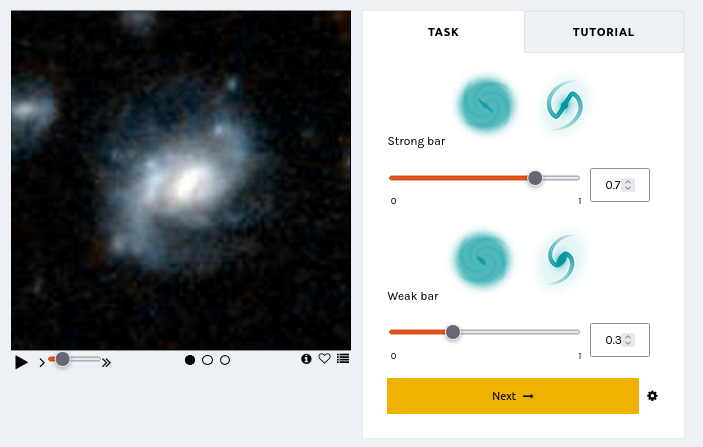
We are trialing a new experimental interface that lets you express your confidence in your annotations by dragging on a slider. This design is motivated by recent research indicating that we may be able to learn more, faster, by collecting annotator uncertainty [see this paper, this paper, this paper, this paper]. Allowing you to express your uncertainty by dragging a slider means that you – Zooniverse Friend – are providing more information with each click.
We believe this slider design might help us – through your support – discover more about galaxies, faster!
This is the second trial project we’re starting, adding to the Tags trial that Hayley introduced earlier on the blog. The big picture here is that we’re trying to think about how Galaxy Zoo could evolve in the coming years. As with any science project, we need to gather data and test our ideas.
Join in here and help us improve Galaxy Zoo.
We’ll run this trial for a short time – perhaps a couple of months – to gather your annotations and feedback. You can still use the current Galaxy Zoo that you know and (hopefully) love, at www.galaxyzoo.org.
Thank you for helping us,
Mike, Katie, and Ilia.
Galaxy Zoo + Galaxy Zoo: 3D
Hi! I’m Tom, and I’m a PhD student at the University of Nottingham, doing some research to try to understand how spiral galaxies have grown and changed over their lifetimes. I’m especially interested in looking at how the spiral arms have been affecting the galaxy as a whole. I’ve recently finished up a paper in MNRAS in which I’ve been demonstrating a couple of new methods using some Galaxy Zoo data.
Amelia has already written [ https://blog.galaxyzoo.org/2018/07/17/finding-bars-in-galaxy-zoo-3d/ ] about how she is using the MaNGA survey [ https://www.sdss.org/surveys/manga/ ] to try to understand what’s happening in bars, so I won’t go into too much detail about this fantastic survey. I’ll just say that it’s part of the Sloan Digital Sky Survey, and for each of its sample of 10,000 galaxies, we have measurements of the spectrum at every position across the face of the galaxy.
MaNGA is really useful for trying to understand how galaxies have grown to their current size, because it is possible to get some sort of estimation of what kinds of stars are present in different locations of the galaxy. It’s a difficult thing to measure, so we can’t say exactly how many of every different type of star is present, but we can at least get a broad picture of the kinds of stellar ages and chemical enrichment (“metallicity”) in the stars. Astronomers have used these kinds of tools to measure the average age or metallicity of stars in different parts of galaxies, and found that in most spirals, the further out you go in the galaxy, the younger the stars are on average. The usual interpretation of this is that bulges tend to have formed first, and the disks have grown in size over time afterwards.

A MaNGA spiral galaxy. We can obtain information about the kinds of stars residing across the hexagonal area, which helps us understand how they’ve grown and evolved.
I’m really interested in trying to push this picture in two ways. Firstly, I’ve been trying to see what we can learn from looking at the general distribution of stars of different ages and metallicities – not just the average properties – at each location in the galaxy. Secondly, I think there is a lot of information that we risk ignoring by only looking at how things change with galactic radius. Spiral arms and the bar aren’t evenly distributed around the galaxy, so if we can see how the stellar properties change as we move around the galaxy, we should be able to measure what effect the spiral arms and bars have on the stars. The goal would be to try to confirm whether the most popular models of the nature of spiral arms and bars are correct or not.
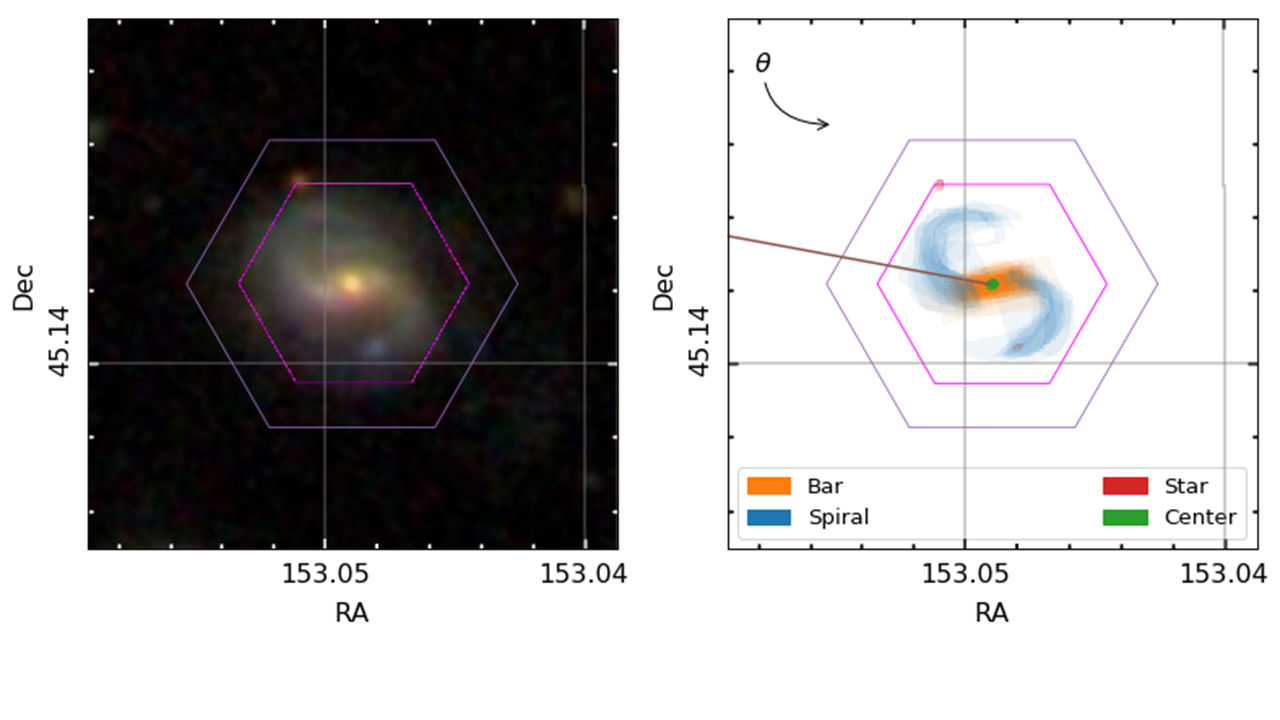
To properly do this, we need to know exactly where the spiral arms and bars are in the MaNGA galaxies, so that we can see how the stars vary in these different regions. Enter Galaxy Zoo: 3D, where volunteers are asked to tell us where the different components are.
An example galaxy in MaNGA, where we’ve managed to split the galaxy into different stellar populations of different ages. Each frame shows where we find stars of a given age in this galaxy, starting from the oldest stars and finishing with the most recently formed stars. The colour denotes the mean metallicity of the stars, shown by the scale at the bottom.
All of this is what my most recent publication is about (read it in full at https://doi.org/10.1093/mnras/stz2204); we’ve shown that by combining the full spatial information available from MaNGA (augmented by Galaxy Zoo:3D) with the full distributions of the ages and metallicities of stars in each location, we can start to see some interesting things in the bar and spiral arms. It’s definitely best illustrated by an animation.
By splitting the age distributions up into different “time-slices”, we can create images of where stars of different ages are located in each of our MaNGA galaxies. Immediately from this one example, it’s obvious that there’s a lot of things going on here.
There are a few features in the animation that we’re not entirely convinced are real, but the main exciting things are that the spiral arms only show up in the youngest stars, and the bar grows and rotates as we move from older to younger stars. The growth of the bar is intriguing; this might be showing us how it formed. The bar changing with angle is even more exciting, and we think it shows us how quickly new-born stars become mixed and “locked” into the bar. The arms show what we should expect; spiral arms are areas of intense star formation, but over time the stars formed there will become mixed around the disk. We measured this effect by looking at what fraction of stars of each age are located in the volunteer-drawn spiral arms from Galaxy Zoo:3D.
This is really interesting, and highlights the power of combining large surveys like MaNGA with crowd-sourced information from the Zooniverse.
The next step is to do these kinds of things with more than just this one galaxy though. I’ve started looking at how these techniques can measure how fast the disks of spiral galaxies grew, using a large sample of spiral galaxies identified by Galaxy Zoo 2 volunteers. I’m also trying to measure how quickly stars get mixed away from spiral arms in different types of spiral galaxies. I have started to find some hints of some exciting results on both of these topics, which I would love to share in a future blog post if you’re interested.
We need volunteers to tell us where the spiral arms and bars are in galaxies, so that we can start to see what makes these regions special.
However, I’m currently limited in the number of galaxies with spiral arm regions identified by Galaxy Zoo:3D volunteers, so it would be really helpful if we could get some more! Understanding what makes spiral structure appear in disky galaxies is one of the unsolved problems in galaxy evolution and formation, and the clues to finding out might well lie in measuring how spiral arms affect the galaxy’s stars. Galaxy Zoo:3D will definitely be able to play a role in this! Help us out at https://www.zooniverse.org/projects/klmasters/galaxy-zoo-3d.
Machine Learning Messaging Experiment
Alongside the new workflow that Galaxy Zoo has just launched (read more in this blog post: https://wp.me/p2mbJY-2tJ), we’re taking the opportunity to work once again with researchers from Ben Gurion University and Microsoft Research to run an experiment which looks at how we can communicate with volunteers. As part of this experiment volunteers classifying galaxies on the new workflow may see short messages about the new machine learning elements. Anyone seeing these messages will be given the option to withdraw from the experiment’; just select the ‘opt out’ button to avoid seeing any further messages.
After the experiment is finished we will publish a debrief blog here describing more of the details and presenting our results.
This messaging experiment has ethics approval from Ben Gurion University (reference: SISE-2019-01) and the University of Oxford (reference: R63818/RE001).
Galaxy Zoo Upgrade: Better Galaxies, Better Science
Since I joined the team in 2018, citizen scientists like you have given us over 2 million classifications for 50,000 galaxies. We rely on these classifications for our research: from spiral arm winding, to merging galaxies, to star formation – and that’s just in the last month!
We want to get as much science as possible out of every single click. Your time is valuable and we have an almost unlimited pile of galaxies to classify. To do this, we’ve spent the past year designing a system to prioritise which galaxies you see on the site – which you can choose to access via the ‘Enhanced’ workflow.
This workflow depends on a new automated galaxy classifier using machine learning – an AI, if you like. Our AI is good at classifying boring, easy galaxies very fast. You are a much better classifier, able to make sense of the most difficult galaxies and even make new discoveries like Voorwerpen, but unfortunately need to eat and sleep and so on. Our idea is to have you and the AI work together.
The AI can guess which challenging galaxies, if classified by you, would best help it to learn. Each morning, we upload around 100 of these extra-helpful galaxies. The next day, we collect the classifications and use them to teach our AI. Thanks to your classifications, our AI should improve over time. We also upload thousands of random galaxies and show each to 3 humans, to check our AI is working and to keep an eye out for anything exciting.
With this approach, we combine human skill with AI speed to classify far more galaxies and do better science. For each new survey:
- 40 humans classify the most challenging and helpful galaxies
- Each galaxy is seen by 3 humans
- The AI learns to predict well on all the simple galaxies not yet classified
What does this mean in practice? Those choosing the ‘Enhanced’ workflow will see somewhat fewer simple galaxies (like the ones on the right), and somewhat more galaxies which are diverse, interesting and unusual (like the ones on the left). You will still see both interesting and simple galaxies, and still see every galaxy if you make enough classifications.
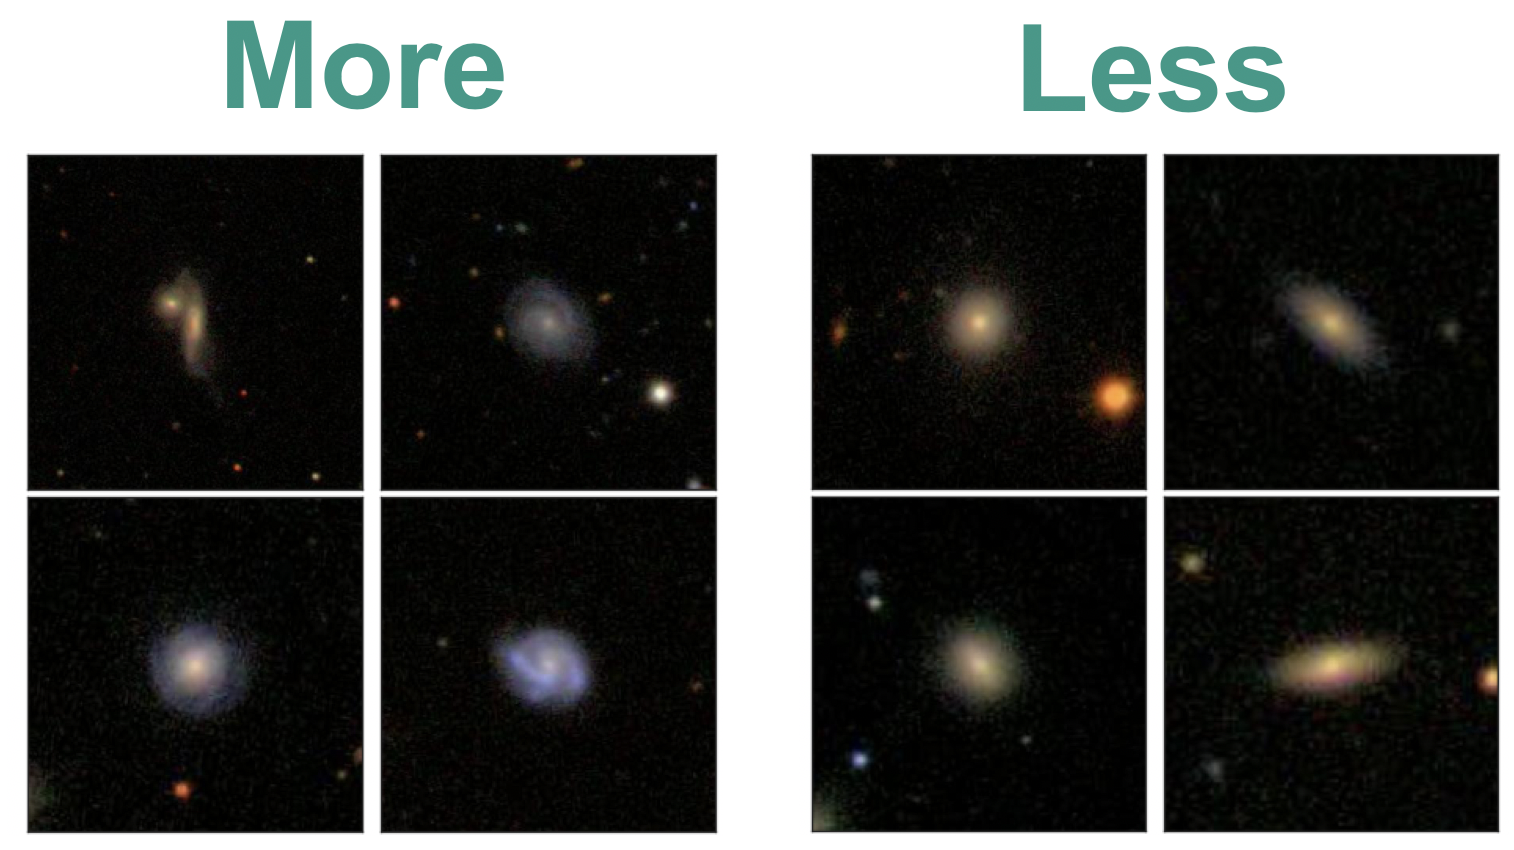
With our new system, you’ll see somewhat more galaxies like the ones on the left, and somewhat fewer like the ones on the right.
We would love for you to join in with our upgrade, because it helps us do more science. But if you like Galaxy Zoo just the way it is, no problem – we’ve made a copy (the ‘Classic’ workflow) that still shows random galaxies, just as we always have. If you’d like to know more, check out this post for more detail or read our paper. Separately, we’re also experimenting with sending short messages – check out this post to learn more.
Myself and the Galaxy Zoo team are really excited to see what you’ll discover. Let’s get started.
Bayesian View of Galaxy Evolution
The Universe is pretty huge, and to understand it we need to collect vast amounts of data. The Hubble Telescope is just one of many telescopes collecting data from the Universe. Hubble alone produces 17.5 GB of raw science data each week. That means since its launch to low earth orbit in April 1990, it’s collected roughly a block of data equivalent in size to 6 million mp3 songs! With the launch of NASA’s James Webb Telescope just around the corner – (a tennis court sized space telescope!), the amount of raw data we can collect from the Universe is going to escalate dramatically. In order to decipher what this data is telling us about the Universe we need to use sophisticated statistical techniques. In this post I want to talk a bit about a particular technique I’ve been using called a Markov-Chain-Monte-Carlo (MCMC) simulation to learn about galaxy evolution.
Before we dive in into the statistics let me try and explain what I’m trying to figure out. We can model galaxy evolution by looking at a galaxy’s star formation rate (SFR) over time. Basically we want know to how fast a particular galaxy is making stars at any given time. Typically, a galaxy has an initial constant high SFR then at a time called t quench (tq) it’s SFR decreases exponentially which is characterised by a number called tau. Small tau means the galaxy stops forming stars, or is quenched, more rapidly. So overall for each galaxy we need to determine two numbers tq and tau to figure out how it evolved. Figure 1 shows what this model looks like.
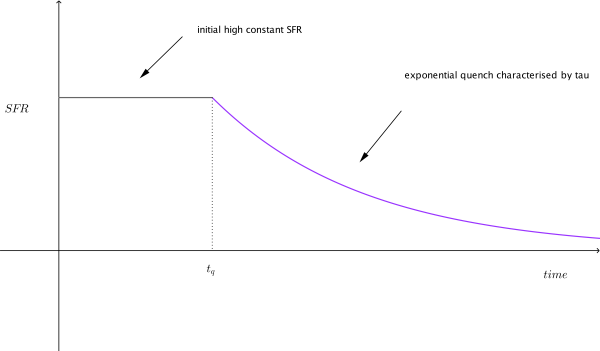
Figure 1: Model of a single galaxy’s SFR over time. Showing an initial high constant SFR, follow by a exponential quench at tq.
To calculate these two numbers, tq and tau, we look at the colour of the galaxy, specifically the UVJ colour I mentioned in my last post. We then compare this to a predicted colour of a galaxy for a specific value of tq and tau. The problem is that there are many different combinations of tq and tau, how to we find the best match for a galaxy? We use a MCMC simulation to do this.
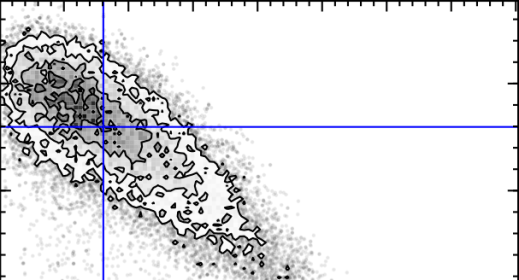
The first MC – Markov-Chain – just means an efficient random walk. We send “walkers” to have a look around for a good tq and tau, but the direction we send them to walk at each step depends on how good the tq and tau they are currently at is. The upshot of this is we quickly home in on a good value of tq and tau. The second MC – Monte Carlo – just picks out random values of tq and tau and tests how good they are by comparing the UVJ colours and our SFR model. Figure 2 shows a gif of a MCMC simulation of a single galaxy. The histograms shows the positions of the walkers searching the tq and tau space, and the blue crosshair shows the best fit value of tq and tau at every step. You can see the walkers homing in and settling down on the best value of tq and tau. I ran this simulation by running a modified version of the starpy code.
Figure 2: MCMC simulation for a single galaxy, pictured in the top right corner. Main plot shows density of walkers. Marginal histograms show 1D projections of walker densities. Blue crosshair shows best fit values of tq and tau at each step.
The maths that underpins this simulation is called Bayesian Statistics, and it’s quite a novel way of thinking about parameters and data. The main difference is that instead of treating unknown parameters as fixed quantities with associated error, they are treated as random variables described by probability distributions. It’s quite a powerful way of looking at the Universe! I’ve left all of the gory maths detail about MCMC out but if you’re interested an article by a DPhil student here at Oxford does are really good job of explaining it here.
So how does this all relate to galaxy morphology, and Galaxy Zoo classifications? I’m currently running the MCMC simulation showing in Figure 2 over the all the galaxies in the COSMOS survey. This is really cool because apart from getting to play with the University of Oxford’s super computer (544 cores!), I can use galaxy zoo morphology to see if the SFR of a galaxy over time is dependent on the galaxy’s shape, and overall learn what the vast amount of data I have says about galaxy evolution.
AAAS Symposium in Feb. 2015: Cutting-Edge Research with 1 Million Citizen Scientists
Some colleagues and I successfully proposed for a symposium on citizen science at the annual meeting of the American Association for the Advancement of Science (AAAS) in San Jose, CA in February 2015. (The AAAS is one of the world’s largest scientific societies and is the publisher of the Science journal.) Our session will be titled “Citizen Science from the Zooniverse: Cutting-Edge Research with 1 Million Scientists.” It refers to the more than one million volunteers participating in a variety of citizen science projects. This milestone was reached in February, and the Guardian and other news outlets reported on it.

The Zooniverse began with Galaxy Zoo, which recently celebrated its seventh anniversary. Of course, Galaxy Zoo has been very successful, and it led to the development of a variety of citizen science projects coordinated by the Zooniverse in diverse fields such as biology, zoology, climate science, medicine, and astronomy. For example, projects include: Snapshot Serengeti, where people classify different animals caught in millions of camera trap images; Cell Slider, where they classify images of cancerous and ordinary cells and contribute to cancer research; Old Weather, where participants transcribe weather data from log books of Arctic exploration and research ships at sea between 1850 and 1950, thus contributing to climate model projections; and Whale FM, where they categorize the recorded sounds made by killer and pilot whales. And of course, in addition to Galaxy Zoo, there are numerous astronomy-related projects, such as Disk Detective, Planet Hunters, the Milky Way Project, and Space Warps.

We haven’t confirmed all of the speakers for our AAAS session yet, but we plan to have six speakers who will introduce and present results from the Zooniverse, Galaxy Zoo, Snapshot Serengeti, Old Weather, Cell Slider, and Space Warps. I’m sure it will be exciting and we’re all looking forward to it!
Explaining clustering statistics we use to study the distribution of Galaxy Zoo galaxies
I’ve used some statistical tools to analyze the spatial distribution of Galaxy Zoo galaxies and to see whether we find galaxies with particular classifications in more dense environments or less dense ones. By “environment” I’m referring to the kinds of regions that these galaxies tend to be found: for example, galaxies in dense environments are usually strongly clustered in groups and clusters of many galaxies. In particular, I’ve used what we call “marked correlation functions,” which I’ve found are very sensitive statistics for identifying and quantifying trends between objects and their environments. This is also important from the perspective of models, since we think that massive clumps of dark matter are in the same regions as massive galaxy groups.
We’ve mainly used them in two papers, where we analyzed the environmental dependence of morphology and color and where we analyzed the environmental dependence of barred galaxies. These papers have been described a bit in this post andthis post. We’ve also had other Galaxy Zoo papers about similar subjects, especially this paper by Steven Bamford and this one by Kevin Casteels.
What I loved about these projects is that we obtained impressive results that nobody else had seen before, and it’s all thanks to the many many classifications that the citizen scientists have contributed. These statistics are useful only when one has large catalogs, and that’s exactly what we had in Galaxy Zoo 1 and 2. We have catalogs with visual classifications and type likelihoods that are ten times as large as ones other astronomers have used.
What are these “marked correlation functions”, you ask? Traditional correlation functions tell us about how objects are clustered relative to random clustering, and we usually write this as 1+ ξ. But we have lots of information about these galaxies, more than just their spatial positions. So we can weight the galaxies by a particular property, such as the elliptical galaxy likelihood, and then measure the clustering signal. We usually write this as 1+W. Then the ratio of (1+W)/(1+ξ), which is the marked correlation function M(r), tells us whether galaxies with high values of the weight are more dense or less dense environments on average. And if 1+W=1+ξ, or in other words M=1, then the weight is not correlated with the environment at all.

First, I’ll show you one of our main results from that paper using Galaxy Zoo 1 data. The upper panel shows the clustering of galaxies in the sample we selected, and it’s a function of projected galaxy separation (rp). This is something other people have measured before, and we already knew that galaxies are clustered more than random clustering. But then we weighted the galaxies by the GZ elliptical likelihood (based on the fraction of classifiers identifying the galaxies as ellipticals) and then took the (1+W)/(1+ξ) ratio, which is M(rp), and that’s shown by the red squares in the lower panel. When we use the spiral likelihoods, the blue squares are the result. This means that elliptical galaxies tend to be found in dense environments, since they have a M(rp) ratio that’s greater than 1, and spiral galaxies are in less dense environments than average. When I first ran these measurements, I expected kind of noisy results, but the measurements are very precise and they far exceeded my expectations. Without many visual classifications of every galaxy, this wouldn’t be possible.

Second, using Galaxy Zoo 2 data, we measured the clustering of disc galaxies, and that’s shown in the upper panel of the plot above. Then we weighted the galaxies by their bar likelihoods (based on the fractions of people who classified them as having a stellar bar) and measured the same statistic as before. The result is shown in the lower panel, and it shows that barred disc galaxies tend to be found in denser environments than average disc galaxies! This is a completely new result and had never been seen before. Astronomers had not detected this signal before mainly because their samples were too small, but we were able to do better with the classifications provided by Zooites. We argued that barred galaxies often reside in galaxy groups and that a minor merger or interaction with a neighboring galaxy can trigger disc instabilities that produce bars.
What kinds of science shall we use these great datasets and statistics for next? My next priority with Galaxy Zoo is to develop dark matter halo models of the environmental dependence of galaxy morphology. Our measurements are definitely good enough to tell us how spiral and elliptical morphologies are related to the masses of the dark matter haloes that host the galaxies, and these relations would be an excellent and new way to test models and simulations of galaxy formation. And I’m sure there are many other exciting things we can do too.
…One more thing: if you’re interested, you’re welcome to check out my own blog, where I occasionally write posts about citizen science.
One Million for Zooniverse – and One for Galaxy Zoo!

Galaxy Zoo started in 2007 because astronomers had 1,000,000 galaxies that needed to be sorted, classified, and examined. After the incredible response from the public, the zookeepers realized that this kind of problem wasn’t limited to galaxies, nor even just to astronomy, and the Zooniverse was born.
Now, seven actual years, close to 30 projects, more than 60 publications, and hundreds of years’ worth of human effort later, the Zooniverse has just registered its 1,000,000th volunteer. Given that Galaxy Zoo was the project that led to the creation of the Zooniverse, it seems fitting that its millionth citizen scientist joined to classify galaxies! That volunteer (whose identity we won’t divulge unless s/he gives us permission) joins over 400,000 others who have classified galaxies near and far. That number is 40% of the Zooniverse’s overall total — meaning that, while Galaxy Zoo has a large and vibrant community of volunteers and scientists, most people who join Zooniverse start off contributing to a different project. Many of them try other projects after their first: over on the Zooniverse blog Rob described the additions we’ve made to the Zooniverse Home area so that everyone who brought us to a million can see their own contribution “fingerprint” on the Zooniverse. Here’s what mine currently looks like:

The blue at the left is Galaxy Zoo; the dark orange is Snapshot Serengeti. #addict
Our millionth volunteer gets a cheesy prize (but hopefully useful: a Zooniverse tote bag and mug), and while we’d like to give that same prize to the 999,999 who came before him/her and to everyone who contributes to Galaxy Zoo and all Zooniverse projects, perhaps it’s more fitting that we say to everyone what’s really on our mind right now:

Galactic-Scale Gratitude. You all are awesome.
Galaxy Zoo: Now Available In Chinese (Mandarin)
 What follows is a press release from Academia Sinica’s Institute of Astronomy & Astrophysics, regarding the new Mandarin Galaxy Zoo. Below is some context for English speakers and regular Galaxy Zoo users.
在可觀測宇宙散佈千億星系,許多以美麗著稱。光芒閃耀的每個星系裡,都有數十億顆恆星。新推出的「星系動物園」網站中文版,和研究星系大有關聯,不管有沒有天文背景,只要有網路,無論愛上網咖還是宅宅A咖,只花二分鐘也可參與星系分類的Galaxy Zoo計畫,自2007年以來,在英、美、歐地區成為網民科普熱門運動,已經招募87萬名星系分類員(志工),大受歡迎。原來星星可以這樣數。
2013年10月份,在中研院年度開放日這天,由中研院天文所推廣成員共同翻譯完成的中文版網站,也選在這天首度公開試用,在場民眾只花二分鐘做星系形態辨識,分類結果就成為整個科學計畫資料庫的一部分,換言之,中文版的星系分類員是實際參與貢獻了科學研究,這吸引不少熱心學生和家長,「做天文只要二分鐘,很酷!而且學到新知識。」
從”Galaxy Zoo”到「星系動物園」,天文所推廣組表示,「兩年前就想過要做」的這個計畫,今年8月,一經天文所博士後研究Meg Schwamb再次提議,立刻獲得響應,網站中文化水到渠成,也讓台灣在全球天文學界再博得一次「亞洲第一」的小獎勵(註:目前該網站只有英文版和西語版)。推廣組表示,由於星系資料持續新增,分類員在圖像庫中撈到某個從未曾被人見過的星系,或「全球第一人」這樣的說法,確實所言不虛。
來自英國的Galaxy Zoo計畫主持人Chris Lintott表示,在網民科學網站傘狀計畫下的項目還有很多,天文類的譬如行星獵人(Planet Hunters)和火星氣候(Planet Four)。這些都必須靠各位地球人以好眼力來熱情相挺,電腦可幫不上忙。為什麼呢?歡迎上網一探究竟:http://www.galaxyzoo.org/?lang=zh
眨眼睛、動滑鼠、幫幫星系分分類!
Last weekend, led by Dr. Meg Schwamb (who is part of the Planet Hunters and Planet Four teams), a team of Taiwanese astronomers helped introduced a Chinese (Mandarin) version a Galaxy Zoo to the public on the Open House Day of Academia Sinica, the highest academic institution in Taiwan.
A big crowd of enthusiastic students and parents, attracted by the long queue itself, visited the ‘Citizen Science: Galaxy Zoo’ booth to try the project hands-on by doing galaxy classifications. They were excited to participate in scientific research and enjoyed it very much.
“Amazing! In just two minutes, we have helped astronomer doing their research, it’s so cool! Also, we learn new astronomical facts we never knew before. It’s a good show.”
The Education Public Outreach team of Academia Sinica’s Institute of Astronomy & Astrophysics (a.k.a. “ASIAA”), has helped translated Galaxy Zoo from English to Chinese (Mandarin). The main translator, Lauren Huang said, “we were keen to do a localized version for Galaxy Zoo since 2010, so when Meg brought up this nice idea again, we acted upon it at once.” In less than six weeks, it was done. The other translator, Chun-Hui, Yang, who contributed to the translation, said that she likes the website’s sleek design very much. “I think the honor is ours, to take part in such a well-designed global team work!” Lauren said.
Talking about the translation process process, Lauren provided an anecdote that she thought about giving “zoo” a very local name, such as “Daguanyuan” (“Grand View Garden”), a term with authentic Chinese cultural flavour, and is from classic Chinese novel Dream of the Red Chamber. She said, “because, my personal experience in browsing the Galaxy Zoo website has been very much just like the character Ganny Liu in the classics novel. Imagine, if one flew into the virtual image database of the universe, which contains all sorts of hidden treasures waiting to be explored, what a privilege, and how little we can offer, to help on such a grandeur design?” However, the zoo is still translated as “Dungwuyuan”, literally, just as “zoo “. Because that’s what some Chinese bloggers have already accustomed to, creating a different term might just be too confusing.
You can check out the Traditional Character Chinese (Mandarin) version of Galaxy Zoo at http://www.galaxyzoo.org/?lang=zh
Quench Boost: A How-To-Guide, Part 4
Now that we’ve been initiated into the cool waters of Tools (Part 1), we’ve compared our *own* galaxies to the rest of the post-quenched sample (Part 2), and we’ve put your classifications to use, looking for what makes post-quench galaxies special compared to the rest of the riff-raff (Part 3), we’re ready for Part 4 of the Quench ‘How-To-Guide’.
This segment is inspired by a post on Quench Talk in response to Part 3 of this guide. One of our esteemed zoo-ite mods noted:
There are more Quench Sample mergers (505) than Control mergers (245)… It seems to suggest mergers have a role to play in quenching star formation as well.
Whoa! That’s a statistically significant difference and will be a really cool result if it holds up under further investigation!
I’ve been thinking about this potential result in the context of the Kaviraj article, summarized by Michael Zevin at http://postquench.blogspot.com/. The articles finds evidence that massive post-quenched galaxies appear to require different quenching mechanisms than lower-mass post-quenched galaxies. I wondered — can our data speak to their result?
Let’s find out!
Step 1: Copy this Dashboard to your Quench Tools environment, as you did in Part 3 of this guide.
- This starter Dashboard provides a series of tables that have filtered the Control sample data into sources showing merger signatures and those that do not, as well as sources in low, mid, and high mass bins.
- Mass, in this case, refers to the total stellar mass of each galaxy. You can see what limits I set for each mass bin by looking at the filter statements under the ‘Prompt’ in each Table.
Step 2: Compare the mass histogram for the Control galaxies with merger signatures with the mass histogram for the total sample of Control galaxies.
- Click ‘Tools’ and choose ‘Histogram’ in the pop-up options.
- Choose ‘Control’ as the ‘Data Source’.
- Choose ‘log_mass’ as the x-axis, and limit the range from 6 to 12.
- Repeat the above, but choose ‘Control – Merging’ as the ‘Data Source’.
The result will look similar to the figure below. Can you tell by eye if there’s a trend with mass in terms of the fraction of Control galaxies with merger signatures?
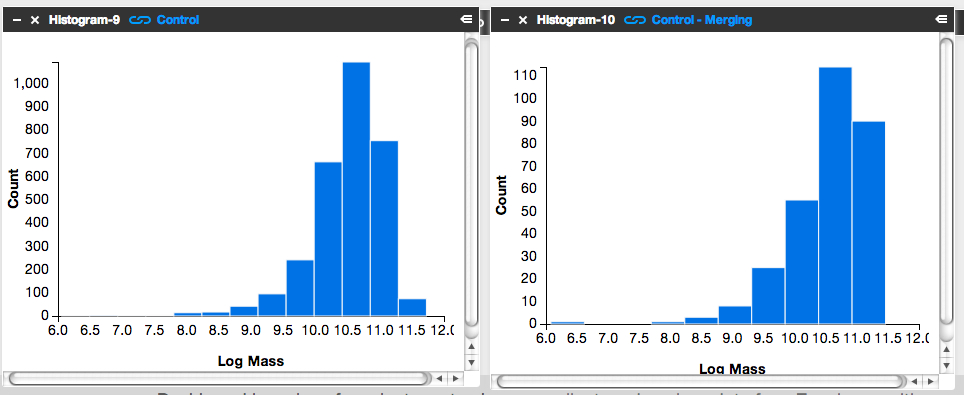
It’s subtle to see it in this visualization. Instead, let’s look at the fractions themselves.
Step 3: Letting the numbers guide us… Is there a higher fraction of Control galaxies with merger signatures at the low-mass end? At the high-mass end? Neither?
To answer this question, we need to know, for each mass bin, the fraction of Control galaxies that show merger signatures. I.e.,
![]()
Luckily, Tools can give us this information.
- Click on the ‘Control – Low Mass’ Table and scroll to its lower right.
- You’ll see the words ‘1527 Total Items’.
- There are 1527 Control galaxies in the low mass bin.
- Similarly, if you look in the lower right of the ‘Control – Merging – Low Mass’ Table, you’ll see that there are 131 galaxies in this category.
- This means that the merger fraction for the low mass bin is 131/1527 or 8.6%.
- Find the fraction for the middle and high mass bins.
Does the fraction increase or decrease with mass?
Step 4: Repeat the above steps but for the post-quenched galaxy sample.
You may want to open a new Dashboard to keep your window from getting too cluttered.
Step 5: How do the results compare for our post-quenched galaxies versus our Control galaxies? How can we best visualize these results?
- In thinking about the answer to this question, you might want to make a plot of mass (on the x-axis) versus merger fraction (on the y-axis) for the Control galaxies.
- On that same graph, you’d also show the results for the post-quenched galaxies.
- To determine what mass value to use, consider taking the median mass value for each mass bin.
- Determine this by clicking on ‘Tools’, choosing ‘Statistics’ in the pop-up options, selecting ‘Control – Low Mass’ as your ‘Data Source’, and selecting ‘Log Mass’ as the ‘Field’.
- This ‘Statistics’ Tool gives you the mean, median, mode, and other values.
- You could plot the results with pen on paper, use Google spreadsheets, or whatever plotting software you prefer. Unfortunately Tools, at this point, doesn’t provide this functionality.
It’d be awesome if you posted an image of your results here or at Quench Talk. We can then compare results, identify the best way to visualize this for the article, and build on what we’ve found.
You might also consider repeating the above but testing for the effect of choosing different, wider, or narrower mass bins. Does that change the results? It’d be really useful to know if it does.
