
Quench Boost: A How-To-Guide, Part 4
Now that we’ve been initiated into the cool waters of Tools (Part 1), we’ve compared our *own* galaxies to the rest of the post-quenched sample (Part 2), and we’ve put your classifications to use, looking for what makes post-quench galaxies special compared to the rest of the riff-raff (Part 3), we’re ready for Part 4 of the Quench ‘How-To-Guide’.
This segment is inspired by a post on Quench Talk in response to Part 3 of this guide. One of our esteemed zoo-ite mods noted:
There are more Quench Sample mergers (505) than Control mergers (245)… It seems to suggest mergers have a role to play in quenching star formation as well.
Whoa! That’s a statistically significant difference and will be a really cool result if it holds up under further investigation!
I’ve been thinking about this potential result in the context of the Kaviraj article, summarized by Michael Zevin at http://postquench.blogspot.com/. The articles finds evidence that massive post-quenched galaxies appear to require different quenching mechanisms than lower-mass post-quenched galaxies. I wondered — can our data speak to their result?
Let’s find out!
Step 1: Copy this Dashboard to your Quench Tools environment, as you did in Part 3 of this guide.
- This starter Dashboard provides a series of tables that have filtered the Control sample data into sources showing merger signatures and those that do not, as well as sources in low, mid, and high mass bins.
- Mass, in this case, refers to the total stellar mass of each galaxy. You can see what limits I set for each mass bin by looking at the filter statements under the ‘Prompt’ in each Table.
Step 2: Compare the mass histogram for the Control galaxies with merger signatures with the mass histogram for the total sample of Control galaxies.
- Click ‘Tools’ and choose ‘Histogram’ in the pop-up options.
- Choose ‘Control’ as the ‘Data Source’.
- Choose ‘log_mass’ as the x-axis, and limit the range from 6 to 12.
- Repeat the above, but choose ‘Control – Merging’ as the ‘Data Source’.
The result will look similar to the figure below. Can you tell by eye if there’s a trend with mass in terms of the fraction of Control galaxies with merger signatures?
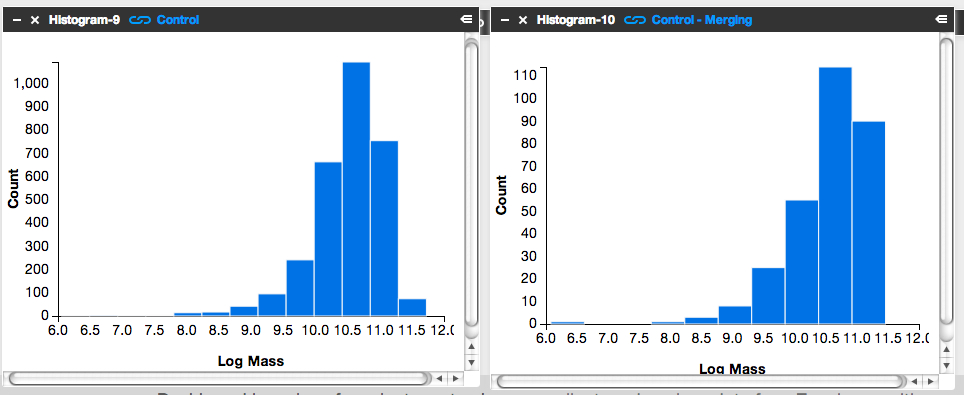
It’s subtle to see it in this visualization. Instead, let’s look at the fractions themselves.
Step 3: Letting the numbers guide us… Is there a higher fraction of Control galaxies with merger signatures at the low-mass end? At the high-mass end? Neither?
To answer this question, we need to know, for each mass bin, the fraction of Control galaxies that show merger signatures. I.e.,
![]()
Luckily, Tools can give us this information.
- Click on the ‘Control – Low Mass’ Table and scroll to its lower right.
- You’ll see the words ‘1527 Total Items’.
- There are 1527 Control galaxies in the low mass bin.
- Similarly, if you look in the lower right of the ‘Control – Merging – Low Mass’ Table, you’ll see that there are 131 galaxies in this category.
- This means that the merger fraction for the low mass bin is 131/1527 or 8.6%.
- Find the fraction for the middle and high mass bins.
Does the fraction increase or decrease with mass?
Step 4: Repeat the above steps but for the post-quenched galaxy sample.
You may want to open a new Dashboard to keep your window from getting too cluttered.
Step 5: How do the results compare for our post-quenched galaxies versus our Control galaxies? How can we best visualize these results?
- In thinking about the answer to this question, you might want to make a plot of mass (on the x-axis) versus merger fraction (on the y-axis) for the Control galaxies.
- On that same graph, you’d also show the results for the post-quenched galaxies.
- To determine what mass value to use, consider taking the median mass value for each mass bin.
- Determine this by clicking on ‘Tools’, choosing ‘Statistics’ in the pop-up options, selecting ‘Control – Low Mass’ as your ‘Data Source’, and selecting ‘Log Mass’ as the ‘Field’.
- This ‘Statistics’ Tool gives you the mean, median, mode, and other values.
- You could plot the results with pen on paper, use Google spreadsheets, or whatever plotting software you prefer. Unfortunately Tools, at this point, doesn’t provide this functionality.
It’d be awesome if you posted an image of your results here or at Quench Talk. We can then compare results, identify the best way to visualize this for the article, and build on what we’ve found.
You might also consider repeating the above but testing for the effect of choosing different, wider, or narrower mass bins. Does that change the results? It’d be really useful to know if it does.
Quench Boost: A How-To-Guide, Part 3
I’m very happy to be posting again to the How-To-Guide. We’ve made a number of updates to Quench data and Quench Tools. Before I launch into Part 3 of the Guide, here are the recent updates:
- The classification results for the 57 control galaxies that needed replacements have been uploaded into Quench Tools.
- We’ve applied two sets of corrections to the galaxies magnitudes: the magnitudes are now corrected for both the effect of extinction by dust and the redshifting of light (specifically, the k-correction).
- We’ve uploaded the emission line characteristics for all the control galaxies.
- We’ve uploaded a few additional properties for all the galaxies (e.g., luminosity distances and star formation rates).
- We corrected a bug in the code that mistakenly skipped galaxies identified as ‘smooth with off-center bright clumps’.
In Part 1 of this How-To-Guide to data analysis within Quench, you learned how to use Tools and were introduced to the background literature about post-quenched galaxies and galaxy evolution.
In Part 2 you used Tools to compare results from galaxies *you* classified with the rest of the post-quenched galaxy sample.
In Part 3 we’re going to use the results from the classifications that you all provided to see if there’s anything different about the post-quenched galaxies that have merged or are in the process of merging with a neighbor, and those that show no merger signatures.
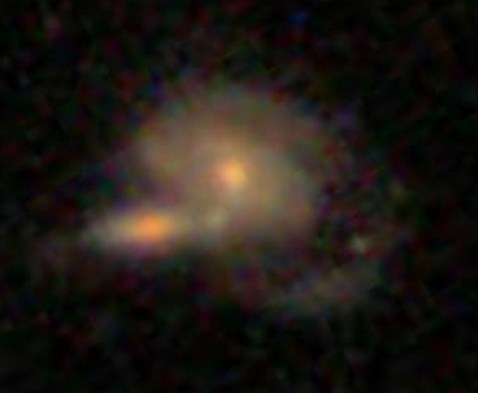
The figure below is of one of my favorite post-quenched galaxies with merger signatures. Gotta love those swooping tidal tails!
Let’s get started!
Step 1: Because of the updates to Tools, first clear your Internet browser’s cache, so it uploads the latest Quench Tools data.
Step 2: Copy my starter dashboard with emission line ratios ready for play.
- Open my Dashboard and click ‘Copy Dashboard’ in the upper right. This way you can make changes to it.
- In this Dashboard, I’ve uploaded the post-quenched galaxy data.
- I also opened a Table, just as you did in Part 2 of this How-To-Guide. I called the Table ‘All Quench Table’.
- In the Table, notice how I’ve applied a few filters, by using the syntax:
filter .’Halpha Flux’ > 0
- This reduces the table to only include sources that fulfill those criteria.
- Also notice that I’ve created a few new columns of data, just as you did in Part 2, by using the syntax:
field ‘o3hb’, .’Oiii Flux’/.’Hbeta Flux’
- That particular syntax means that I took the flux for the doubly ionized oxygen emission line ([0III]) and divided it by the flux in one of the Hydrogen emission lines (Hbeta).
- This ratio and the ratio of [NII]/Halpha are quite useful for identifying Active Galactic Nuclei (AGN).
- It’d be really interesting if we find that AGN play a role in shutting off the star formation in our post-quenched galaxies. A major question in galaxy evolution is whether there’s any clear interplay between merging, AGN activity, and shutting off star formation.
Step 3: Create the BPT diagram using the ratios of [OIII]/Hb and [NII]/Ha.
- BPT stands for Baldwin, Phillips, and Terlevich (1981), among the first articles to use these emission line ratios to identify AGN. Check out the GZ Green Peas project’s use of the BPT diagram.
- Click on ‘Tools’. Choose ‘Scatter plot’ in the pop-up options.
- In the new Scatterplot window, choose ‘All Quench Table’ as your ‘Data Source’.
- For the x-axis, choose ‘logn2ha’. For the y-axis, choose ‘logo3hb’.
- Adjust the min/max values so the data fits nicely within the window, as shown in the figure below.
- Remember that you can click on the comb icon in the upper-left of the plot to make the menu overlay disappear.
- Do you notice the two wings of the seagull in your plot? The left-hand wing is where star forming galaxies reside (potentially star-bursting galaxies) while the right-hand wing is where AGN reside. Our post-quenched sample of galaxies covers both wings.

Step 4: Compare the BPT diagram for post-quenched galaxies with and without signatures of having experienced a merger.
- To do this, you’ll need to first create two new tables, one that filters out merging galaxies and the other that filters out non-merging galaxies.
- Click on ‘Tools’. Choose ‘Table’ in the pop-up options.
- In the new Table window, choose ‘All Quench Table’ as the ‘Data Source’. Notice how this new table already has all the new columns that were created in the ‘All Quench Table’. That makes our life easier!
- Look through the column names and find the one that says ‘Merging’. Possible responses are ‘Neither’, ‘Merging’, ‘Tidal Debris’, or ‘Both’.
- Let’s pick out just the galaxies with no merger signatures.
- Under ‘Prompt’ type:
filter .Merging = ‘Neither’
- If you scroll to the bottom of the Table, you’ll notice that you now have only 2191 rows, rather than the original 3002.
- Call this Table ‘Non-Mergers Table’ by double clicking on the ‘Table-4’ in the upper-left of the Table and typing in the new name.
- Now follow the instructions from Step 3 to create a BPT scatter plot for your post-quenched galaxies with no merger signatures. Be sure to choose ‘Non-Mergers Table’ as the ‘Data Source’.
- You might notice that this plot looks pretty similar to the plot for the full post-quenched galaxy sample, just with fewer galaxies.
What about post-quenched galaxies that show signatures of merger activity? Do they also show a similar mix of star forming galaxies and AGN?
- To find out, create a new Table, but this time under ‘Prompt’ type:
filter .Merging != ‘Neither’
- The ‘!=’ syntax stands for ‘Not’, which means this filter picks out galaxies that had any other response under the ‘Merging’ column (i.e, tidal tails, merger, both). Notice how there are 505 sources in this Table.
- Now create a BPT scatter plot for your ‘Mergers Table’.
- Make sure this plot has a similar xmin,xmax,ymin,ymax as your other plots to ensure a fair comparison.
- You might also compare histograms of log(NII/Ha) for the different subsamples.
What do you find? Do you notice the difference? What could this be telling us about our post-quenched galaxies?!
Before you get too carried away in the excitement, it’s a good idea to compare the post-quenched galaxy sample BPT results against the control galaxy sample.
This comparison with the control sample will tell you whether this truly is an interesting and unique result for post-quenched galaxies, or something typical for galaxies in general. You might consider doing this in a new Dashboard, as I have, to keep things from getting too cluttered. In that new Dashboard, click ‘Data’, choose ‘Quench’ in the pop-up options, and choose ‘Quench Control’ as your data to upload. Now repeat Steps 1-4.
Do you notice any differences between your control galaxy and post-quenched galaxy sample results? What do you think this tells us about our post-quenched galaxies?
Stay tuned for Part 4 of this How-To-Guide. I’d love to build from your results from this stage, so definitely post the URLs for your Dashboards here or within Quench Talk and your questions and comments.
Quench Boost: A How-To-Guide, Part 2
It was amazing how quickly the new Quench classifications were completed. We posted them on Friday and you were already done by Sunday morning. Wow, that’s awesome! This means we can turn our full attention to making sense of the data. And we need your help!
In Part 1 of this How-To-Guide to data analysis within Quench, you learned how to use Tools, our analysis platform, and were inspired (or so I hope) about ways to play with the data as you read the background literature about post-quenched galaxies and galaxy evolution.
In Part 2 of this How-To-Guide, we’re going to help you navigate using Tools to compare results from galaxies *you* classified with the rest of the post-quenched galaxy sample.
You’re 12 small steps away from your first comparison plot between your galaxies and the full sample… let’s get started!
Step 1: Enter Tools and log in using your Zooniverse login information.
Step 2: Choose ‘Quench’ in the pull-down menu in the upper-left, next to the words ‘zootools’. Now click ‘Create Dashboard*’ in the upper-right, and give it a name, like: ‘My Data in Context’.
Step 3: Click ‘Data’ in the upper-left and choose ‘Zooniverse’ in the pop-up options.
Step 4: In the window that pops up, choose ‘Recents’ or ‘Collections’. Your choice.
If you classified galaxies in quench.galaxyzoo.org, they’ll be accessible through ‘Recents’. Choose the max number possible. If you created a Collection of interesting galaxies in Quench Talk or want to look at someone else’s Collection, you can access them by clicking ‘Collections’.
I’ve created a Dashboard* in Tools called ‘Example: My Data in Context’. Take a look and, if you’d like, you can even make edits by copying it into your Tools environment.
In my Dashboard ‘Example: My Data in Context’, I chose ‘Collections’. I love #Quencher SUMO_2011’s Collection of ‘Blue’ galaxies from Quench. If you go to that URL, the Collection ID is listed after the final ‘/’ in the URL. In this case, the Collection ID is CGSS00000x. I inputted that ID into the pop-up window in Tools, in the box next to ‘Enter Collection Id:”. I then clicked on ‘Import Data’.
Step 5: Now that you have your galaxies’ information imported into the Dashboard, it’s time to play with them. Click on ‘Tools’ in the upper-left and choose ‘Table’ in the pop-up options.
Step 6: In your Table window, choose ‘Zooniverse-1’ in the pull-down menu under ‘Data Source’. Now the Table knows to work with that set of data.
Step 7: As in Part 1 of this How-To-Guide (https://blog.galaxyzoo.org/2013/08/23/quench-boost-a-how-to-guide-part-1/), you’ll make a new column that has color information about your galaxies. You do this by subtracting the brightness of your galaxy in one filter from the brightness of your galaxy in another filter.
In the open space under ‘Prompt’ in your Table, write: field ‘My Galaxies Color u-r’, .u-.r
If you scroll to the right in your table, you’ll see that you created a new column of information, called ‘My Galaxies Color u-r’.
Step 8: Click ‘Tools’ in the upper-left and choose ‘Scatterplot’ in the pop-up options.
Step 9: In your Scatterplot window, choose ‘Table-2’ in the pull-down menu under ‘Data Source’. Now the Scatterplot knows to work with the Table, which includes your new column with Color information.
Step 10: Choose ‘log_mass’ for the X-axis and ‘My Galaxies Color u-r’ for the Y-axis. Recent star formation is seen strongly in the u-band while older stars dominate the r-band. The color, u-r, tells you about the star formation history for each of your galaxies. Check out this post for more details.
Step 11: How do your galaxies compare with the full sample of post-quenched galaxies? To answer this, we redo the steps 3-10 above, but for the post-quenched galaxy sample.
- Click on ‘Data’ in the upper-left and choose ‘Quench’ in the pop-up options.
- Click on ‘Quench Sample’ in the pop-up window.
- Click on ‘Tools’ in the upper-left and choose ‘Table’ in the pop-up options.
- In the new Table window, choose ‘Quench-4’ in the pull-down menu under ‘Data Source’. This loads the Quench Sample into that Table.
- In the open space under ‘Prompt’ in your Table, write: field ‘Quench Galaxies Color u-r’, .u-.r
- Click on ‘Tools’ in the upper-left and choose ‘Scatterplot’ in the pop-up options.
- In the new Scatterplot window, choose ‘Table-5’ in the pull-down menu under ‘Data Source’.
- Choose ‘log_mass’ for the X-axis and ‘Quench Galaxies Color u-r’ for the Y-axis.
- Zoom in on the data, for example, choosing Xmin: 7, Xmax: 12, Ymin: 1, and Ymax: 4.
Step 12: Place your two scatterplots side by side. For a fair comparison, make sure the x- and y-axis range is the same for both plots, otherwise the stretch might skew your analysis. I tend to make the axes ranges in the plot showing My Galaxies match the plot showing the Quench Sample.
What do you notice about your subsample of post-quenched galaxies compared to the full sample? Do they occupy a particle sub-space within the plot? Or are they randomly distributed throughout the quench space?
The figure below shows what you’ll see if, like me, you uploaded SUMO_2011’s Collection of blue galaxies. You’ll notice that all of the blue-collection galaxies are way bluer (closer to the bottom of the plot, near values u-r = 1.5) than the full post-quenched galaxy sample (which spread from u-r values of 1 to u-r values of 3.5 and higher). This is a reassuring reality check given what you see visually when you look at the color of the galaxies. The plot also tells us that since these blue galaxies have such low values of ‘u-r’, they’ve had more recent star formation than most of the post-quenched galaxies.
In looking at these two plots side-by-side, I wondered: Why are there so few massive post-quenched galaxies (log_mass > 11) with bluer colors (u-r < 2.0)? If we compare our post-quenched galaxies with our control galaxies, do I see any difference? Specifically, are there massive (log_mass > 11) control galaxies with bluer colors (u-r < 2.0)? If there are, what might that be telling me about our post-quenched galaxy sample?
Stay tuned for Part 3 of our How-To-Guide for taking part in the analysis phase of the research process. If you have suggestions for what you’d like to learn more about, please post here. Thank you all, and keep on Quenching!
*Dashboard is the place within Tools (tools.zooniverse.org) for volunteers to observe, collect, and analyze data from Zooniverse citizen science projects.

Quench Boost: A How-To Guide, Part 1
The reaction to GZ Quench has been amazing. It has been great to see the interest and enthusiasm for supporting citizen scientists in experiencing the full scientific process.
This morning’s post was about how we have a small sample of additional galaxies to classify. I’ve really enjoyed watching how fast those are being done… gotta love the counter at http://quench.galaxyzoo.org/. Thank you all!
This post is Part 1 of our How-To-Guide for analyzing our classification results. It’s clear that you’re interested in getting your analysis on, but it may be that you’re not sure where to start. That’s 100% understandable and we’re here to help. We’ve broken down the steps into bite-size chunks. Let’s get started.
The first thing to do is to meet Quench Tools. This is the web platform to help you play with the data. To enter Quench Tools, click here. An in-line Tutorial will automatically pop-up, and guide you through entering the Quench area, loading the data, and creating your first figure. For additional information about Tools, check out our GZ Hangout about Tools, our text-based Tools Tutorial, and this Quench Talk discussion forum post.
In parallel with getting to know Tools, you may be interested in understanding the science context for why post-quenched galaxies (the GZ Quench sample) are so interesting for galaxy evolution studies. A great starting place for getting a sense of the science context and motivation is to read the summaries (written for the general public) of science articles at http://postquench.blogspot.com/. It’s modeled after the astrobites blog, a great resource for any astronomy enthusiast!
As you read those posts, you might want to join the conversation within the Quench Talk discussion forum. There are also a slew of links to popular science articles and websites for additional information about post-quenched galaxies and galaxy evolution.
And if you feel it would help to take a step back and see the big picture, definitely check out our initial GZ Quench blog post and this Quench Talk post.
Stay tuned for Part 2 of our How-To-Guide. In it, I’ll guide you through the next bite-size piece of this adventure – playing with your own classification results!
Quench: New Classifications Needed
We have a few dozen new galaxies in GZ Quench that need your classification savvy. As with all research projects, there are sure to be some glitches. Luckily we have a great group of Quenchers on the job. And as a few pointed out (including the force of nature that is Jean Tate!), 57 of our 3002 control sample galaxies were duplicates. We’ve identified suitable replacements and, to make sure no bias is introduced, we’ve added some of the original post-quenched galaxies to the mix as well. So let’s get classifying!
For a reminder about what GZ Quench is all about, check out the first Quench blog post. Yes, in this project, we’re not only classifying galaxies, but we’re going all the way to support our citizen scientists in experiencing the full process of science.

We’re now into Phase 2 of GZ Quench, analyzing the results of the classifications and making sense of our data. Our amazing group of Quenchers have provided incredibly useful feedback on the analysis tools we’ve made available and the analysis process. And there are already a number of intriguing results (for example, here and here)!
We’re now ready to give Quench a boost. Later today I’ll post Part 1 of our How-To-Guide, breaking the analysis phase into bite-size pieces and providing a smoother on-ramp for all of you out there who want to join in the GZ Quench experience, but aren’t sure where to begin.
Stay tuned…
GZ Quench: Classification Complete – Now the Real Fun Begins!
Congratulations all! We’ve completed Phase 1 of Galaxy Zoo Quench! Over 1600 people lent us their time and pattern-recognition skills to complete the needed 120,000 classifications. Thank you!
Now is when GZ Quench gets really fun, interesting, and totally different from past projects. We’re not stopping with classifications; we’re helping our volunteers to go all the way… from soup to nuts, as some like to say.
Phase 2 begins today and will run for the next few weeks*, with our science team supporting you, our esteemed Zooniverse volunteers, in the data analysis and discussion.

We’ll be using the results from our classifications of the 3002 post-quenched galaxies + 3002 control galaxies to address the following questions: What causes the star formation in these galaxies to be quenched? What role do galaxy mergers play in galaxy evolution? Join us in exploring these questions, being a part of the scientific process, and contributing to our understanding of this dynamic phase of galaxy evolution!
Luckily, we have great tools to help make this phase accessible to anyone, no matter your background.
- Quenchtalk.galaxyzoo.org – our discussion forum within which there are already really interesting and exciting conversations happening between Zooites and the science team. This forum allows us to share knowledge, pursue interesting results, collaboratively make sense of interesting plots, and determine which results to include in our article.
- Tools.zooniverse.org – our online data visualization environment, which helps you play with the data and look for trends. Click here for the blog post and to watch the GZ google hangout describing Tools and the Quench Tools tutorial.
- Authorea.com – the online article writing platform we’ll be using to collaboratively write the GZ Quench article, to be submitted to a professional journal. This is the same online environment that a group of over 100 CERN physicists are using to write their articles.
We can’t stress enough that you do not need prior background or knowledge to take part in this next phase. Each of you brings useful skills to the project – asking questions, communication, critical thinking, organization, leadership, consensus building, intuition, etc. Through Quench Talk, we’ll help you apply those skills in this context, and enable you to get your feet wet experiencing the full process of science.
Have questions about the project? Ask us on Twitter (@galaxyzoo), Facebook, or within Quench Talk.
*Science timelines often subject to a factor of two uncertainty. We’ll do our best to keep on track, at the same time expecting the unexpected (all part of the fun of doing science!).
Galaxy Zoo Quench – Experience the Full Scientific Process
Experience Science from Beginning to End! Classify, Analyze, Discuss, and Collaboatively Write an Article!
Galaxy Zoo and other Zooniverse projects have given thousands the opportunity to contribute to scientific research. It’s time to take the role of volunteers to the next level. For the next two months*, this new Galaxy Zoo Quench project provides the opportunity to take part in the ENTIRE scientific process – everything from classifying galaxies to analyzing results to collaborating with astronomers to writing a scientific article!
Galaxy Zoo Quench will examine a sample of galaxies that have recently and abruptly quenched their star formation. These galaxies are aptly named Post-Quenched Galaxies. They provide an ideal laboratory for studying how galaxies evolve from blue, star-forming spiral galaxies to red, non-star-forming elliptical galaxies. Using the more than a million galaxies in the Sloan Digital Sky Survey, we identified ~3000 post-quenched galaxies. By classifying these galaxies and analyzing the results, we will explore the mechanisms that quenched their star formation and investigate the role of post-quenched galaxies in galaxy evolution.

The entire process of classifying, analyzing, discussing, and writing the article will take place over an 8 week period*, beginning July 18th. After classifying the galaxies, volunteers will use the tools available within Zooniverse to plot the data and look for trends. Through reading articles and interaction in Talk, volunteers will gain background information. Throughout, they’ll discuss with the science team their interpretation of the results. At the end of the process, volunteers and the science team will collaboratively write a 4-page Astrophysical Journal article.

What causes the star formation in these galaxies to be quenched? How do interactions impact galaxy evolution? What is the fate of our Milky Way? Join us this Summer (or Winter if you’re below the equator!) in exploring these questions, being a part of the scientific process, and contributing to our understanding of this dynamic phase of galaxy evolution!

CLICK HERE TO PARTICIPATE!
We’ll be sharing more details about this project during the next Galaxy Zoo Hangout, on Monday, July 15th at 14:00 CST / 19:00 GMT / 20:00 BST. Have questions about the project? Post them here or tweet at us (@galaxyzoo). Just before the Hangout starts, we’ll embed the video here so you can watch from the blog.
The best way to send us a comment during the live Hangout is through twitter (@galaxyzoo). You can also leave a comment on this blog post, or on Google Plus, Facebook or YouTube. See you soon!
Update: here’s the hangout (and the mp3 version)!
*Note: science timelines often subject to a factor of two uncertainty. We’ll do our best to keep on track, at the same time expecting the unexpected (all part of the fun of doing science!).
