
Eight years and 8 billion years of cosmic history
Next up in our series of eight blog posts celebrating eight years of Galaxy Zoo is this post from Tom Melvin, who was the lead author of the the first publication from Galaxy Zoo: Hubble, which looked at how the fraction of barred disk galaxies has evolved over the last eight billion years. Tom is also the first person to write a PhD thesis substantially based on Galaxy Zoo classifications, which he is in the process of completing final corrections for.

Barred disc galaxies at high redshift identified by Galaxy Zoo Hubble. The redshift (‘z’) and the fraction of volunteers identifying a bar (‘Pbar’) are noted in each image.
This was the first time the Galaxy Zoo volunteers had been asked to classify galaxies taken by the Hubble Space Telescope, which provided beautiful images of galaxies whose light has taken up to eight billion light years to reach us!
With your classifications, we were able to select a sample of disk and barred disk galaxies, as shown above in Figure 1, and explore how the fraction of disk galaxies that are barred has evolved over the last eight billion years. We found that this bar fraction has been increasing as the Universe has grown older, doubling from 11% eight billion years ago to 22% four billion years ago, which is shown below in Figure 2. We also know from Galaxy Zoo 2 that this continues to increase, with around one third of disks having a bar in our local Universe. We were able to expand on this by showing that it was the most massive disk galaxies that were the driver of this evolution.
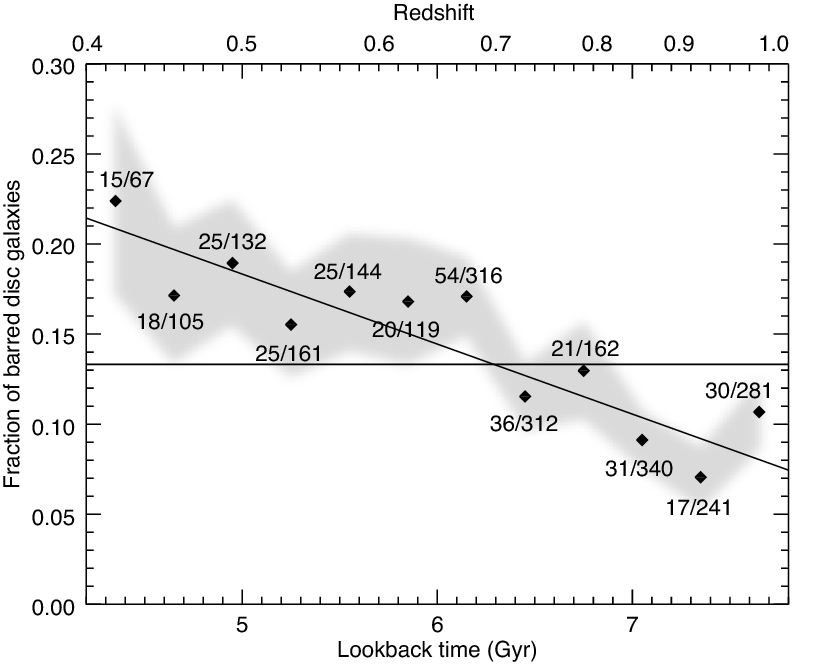
Redshift evolution of the fraction of barred disc galaxies. Each point represents the observed bar fraction in a 0.3 Gyr bin, with the number of barred disc galaxies and total number of disc galaxies indicated. The grey shaded region indicates the error on the measurement. We show the mean bar fraction for the whole sample (fbar = 13.3 ± 0.7%) as the horizontal dot-dashed line, as well as a linear relationship between the bar fraction and the lookback time which is shown by the solid line.
As bars tend to only form in disk galaxies that are settled and relaxed, or ‘mature’, our results showing an increasing bar fraction over the last eight billion years tells us that the disk galaxy population has matured as the Universe has aged. As this evolution is being driven by the most massive disk galaxies, we were able to conclude that the most massive disk galaxies become mature sooner than their lower mass counterparts.
In addition to these results, we were able to identify a population of ‘red spiral’ galaxies thanks to your classifications. These red spirals’ would typically be omitted from other disk samples, as they would be classified as elliptical galaxies – but as you can see below, these are clearly beautiful red spiral galaxies! What is interesting about this population of disks is that their bar fraction of 45% is much higher than the bar fraction of the whole disk sample, which is roughly 14%.

Images showing 3 unbarred (images a − c) and 3 barred (images d − f) “red spiral” galaxies from Galaxy Zoo Hubble.
So, thanks to your help classifying the amazing images from the Hubble Space Telescope, we were able to track the evolving bar fraction of disk galaxies over the last eight billion years. There is plenty more to be done with this sample of galaxies, so keep an eye out for future results looking at how galaxies have evolved over the past eight billion years!
First Result from Galaxy Zoo Hubble
Posted on behalf of Tom Melvin:
Hello everyone, my name is Tom Melvin and I’m a 3rd year PhD student at Portsmouth University. I have been part of the Galaxy Zoo team for over two years now, but this is my first post for the Galaxy Zoo blog, hope you enjoy it!
I’m very happy to bring you news of the latest paper based on Galaxy Zoo classifications, and the first paper based on Galaxy Zoo: Hubble classifications. Galaxy Zoo: Hubble was the first Galaxy Zoo project to look at galaxies beyond our local universe, using the awesome power of the Hubble Space Telescope. These images contained light from galaxies which have taken up to eight billion years to reach us, so we see them as they appeared eight billion years ago, or when the universe was less than half its current age! So what is the first use of this data? Well, we combine our Galaxy Zoo: Hubble classifications with Galaxy Zoo 2 classifications to explore how the fraction of disk galaxies with galactic bars has changed over eight billion years.
Here’s the title…..

Our work is based on a sample of 2380 disk galaxies, which are from the Cosmic Evolution Survey (COSMOS), the largest survey Hubble has ever done. To see how the bar fraction varies over such a large time-scale, we look at the number of disk galaxies and what fraction of them have bars in 0.3 Gyr (300 million year) time steps. In Figure 1 we show that eight billion years ago only 11% of disk galaxies had bars. By 4 billion years ago this fraction had doubled, and today at least one third of disk galaxies have a bar.

Figure 1: The evolving bar fraction with cosmic time (Figure 7 in the paper).
We know that bars tend to only form in disk galaxies which have low amounts of atomic gas and are in a relaxed state, or what we call ‘mature’. Combining this knowledge with our observations, we can say that, as the Universe gets older, the disk galaxy population as a whole is maturing. To see whether this is true for all disk galaxies, we split our sample up into three stellar mass bins, allowing us to look at the evolving bar fraction trends for low, intermediate and high mass disk galaxies.

Figure 2: Mass dependent evolution of the bar fraction with cosmic time (Figure 8 in the paper)
The results for this are shown in Figure 2, where we observe an intriguing result. The bar fraction increases at a much steeper rate with time for the most massive galaxies (red), compared to the lower mass galaxies (blue). From this we can say that the population of disk galaxies is maturing across the whole stellar mass range we explore, but it is predominantly the most massive galaxies which drive the overall time evolution of the bar fraction we observe in Figure 1.
At the end of the paper we offer an explanation as to why the time evolution of the bar fraction differs for varying stellar mass bins. We can make the reasonable assumption that, by eight billion years ago, the majority of massive disk galaxies have formed, and have been, and continue to form bars up to the present day – hence the steeply increasing bar fraction we observe. However, the same assumption is not true for the low mass galaxies. There are some which are ‘mature’ disk galaxies eight billion years ago, but not all are ‘mature’ enough to be classified as disks. As with the most massive galaxies, these low mass disks are forming bars at a similar rate up to the present day, but the difference with this low mass sample is that there are still low mass disks forming up to the present day as well – leading to the much shallower increase in the bar fraction with time we observe.
In addition to these results, we are also able to present an interesting subset of disk galaxies. Your visual classifications has allowed our work to include a sub-sample of ‘red’ spiral galaxies (like those found from Galaxy Zoo 2 classifications). This sub-sample is generally omitted from other works that have explored this topic, as their way of identifying disks is based on galaxy colours. This means that these ‘red’ galaxies would have been classified as elliptical galaxies! Figure 3 shows a few of these ‘red’ disk galaxies (with the full sample of 98 here), so why don’t you take a look and decide for yourself! Not only is it very cool that you are able to identify these ‘red’ disks, but they also influence the results we observe. Just like in our local universe, these ‘red’ disks have a high bar fraction, with 45% of them having a bar! Could this be a further sign that bars ‘kill’ galaxies, even at high redshifts?

Figure 3: A sample of ‘red’ disk galaxies found by Galaxy Zoo volunteers (Figure 10 in the paper).
So that is a summary of the first results from Galaxy Zoo: Hubble. If you want more detail have a read of the paper in full here and take a look at the press release too! Thanks for all your hard work and help in classifying these galaxies!
Posted on behalf of Tom Melvin.
Hubble Zoo: Summer Research Starts!
Today’s guest post is from Anna Han:
Hi everyone!
My name is Anna Han, and I’m a sophomore undergrad at Yale studying black holes this summer. I’m currently working with images of galaxies observed by Hubble that you as members helped classify on Galaxy Zoo. So excited to be part of the community, and looking forward to sharing ideas with you all!
