
Galaxy Zoo + Galaxy Zoo: 3D
Hi! I’m Tom, and I’m a PhD student at the University of Nottingham, doing some research to try to understand how spiral galaxies have grown and changed over their lifetimes. I’m especially interested in looking at how the spiral arms have been affecting the galaxy as a whole. I’ve recently finished up a paper in MNRAS in which I’ve been demonstrating a couple of new methods using some Galaxy Zoo data.
Amelia has already written [ https://blog.galaxyzoo.org/2018/07/17/finding-bars-in-galaxy-zoo-3d/ ] about how she is using the MaNGA survey [ https://www.sdss.org/surveys/manga/ ] to try to understand what’s happening in bars, so I won’t go into too much detail about this fantastic survey. I’ll just say that it’s part of the Sloan Digital Sky Survey, and for each of its sample of 10,000 galaxies, we have measurements of the spectrum at every position across the face of the galaxy.
MaNGA is really useful for trying to understand how galaxies have grown to their current size, because it is possible to get some sort of estimation of what kinds of stars are present in different locations of the galaxy. It’s a difficult thing to measure, so we can’t say exactly how many of every different type of star is present, but we can at least get a broad picture of the kinds of stellar ages and chemical enrichment (“metallicity”) in the stars. Astronomers have used these kinds of tools to measure the average age or metallicity of stars in different parts of galaxies, and found that in most spirals, the further out you go in the galaxy, the younger the stars are on average. The usual interpretation of this is that bulges tend to have formed first, and the disks have grown in size over time afterwards.

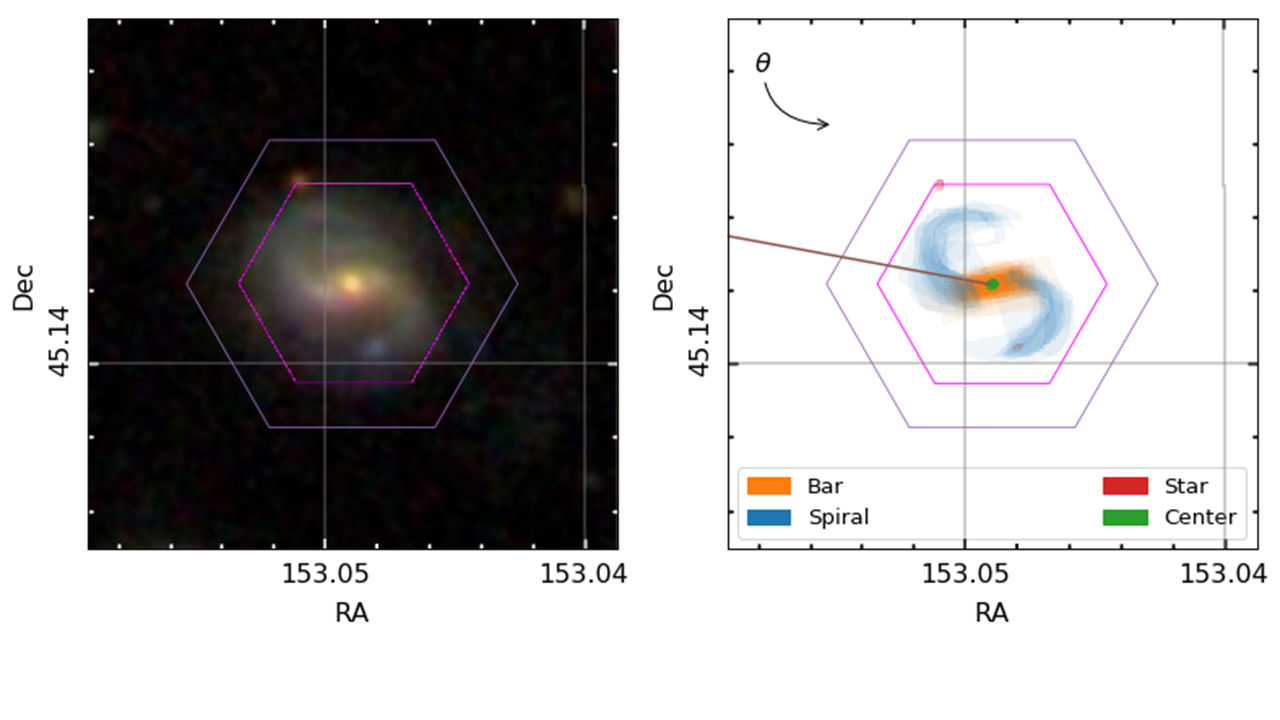
A MaNGA spiral galaxy. We can obtain information about the kinds of stars residing across the hexagonal area, which helps us understand how they’ve grown and evolved.
I’m really interested in trying to push this picture in two ways. Firstly, I’ve been trying to see what we can learn from looking at the general distribution of stars of different ages and metallicities – not just the average properties – at each location in the galaxy. Secondly, I think there is a lot of information that we risk ignoring by only looking at how things change with galactic radius. Spiral arms and the bar aren’t evenly distributed around the galaxy, so if we can see how the stellar properties change as we move around the galaxy, we should be able to measure what effect the spiral arms and bars have on the stars. The goal would be to try to confirm whether the most popular models of the nature of spiral arms and bars are correct or not.
To properly do this, we need to know exactly where the spiral arms and bars are in the MaNGA galaxies, so that we can see how the stars vary in these different regions. Enter Galaxy Zoo: 3D, where volunteers are asked to tell us where the different components are.
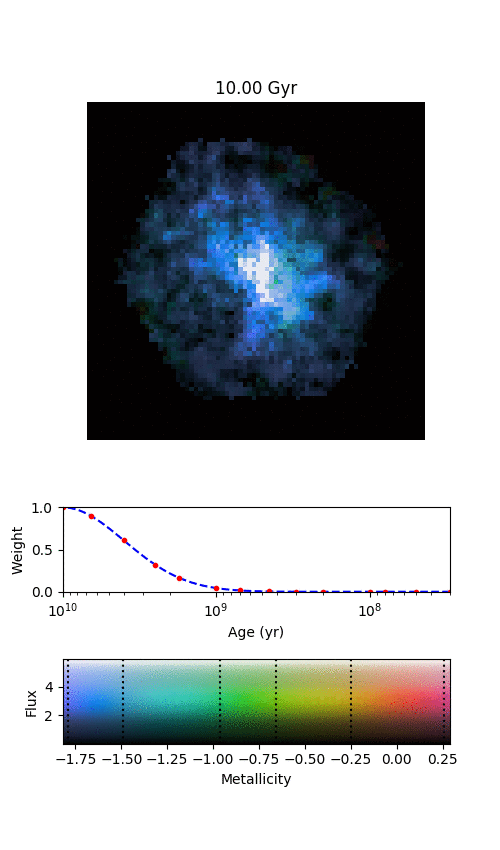
An example galaxy in MaNGA, where we’ve managed to split the galaxy into different stellar populations of different ages. Each frame shows where we find stars of a given age in this galaxy, starting from the oldest stars and finishing with the most recently formed stars. The colour denotes the mean metallicity of the stars, shown by the scale at the bottom.
All of this is what my most recent publication is about (read it in full at https://doi.org/10.1093/mnras/stz2204); we’ve shown that by combining the full spatial information available from MaNGA (augmented by Galaxy Zoo:3D) with the full distributions of the ages and metallicities of stars in each location, we can start to see some interesting things in the bar and spiral arms. It’s definitely best illustrated by an animation.
By splitting the age distributions up into different “time-slices”, we can create images of where stars of different ages are located in each of our MaNGA galaxies. Immediately from this one example, it’s obvious that there’s a lot of things going on here.
There are a few features in the animation that we’re not entirely convinced are real, but the main exciting things are that the spiral arms only show up in the youngest stars, and the bar grows and rotates as we move from older to younger stars. The growth of the bar is intriguing; this might be showing us how it formed. The bar changing with angle is even more exciting, and we think it shows us how quickly new-born stars become mixed and “locked” into the bar. The arms show what we should expect; spiral arms are areas of intense star formation, but over time the stars formed there will become mixed around the disk. We measured this effect by looking at what fraction of stars of each age are located in the volunteer-drawn spiral arms from Galaxy Zoo:3D.
This is really interesting, and highlights the power of combining large surveys like MaNGA with crowd-sourced information from the Zooniverse.
The next step is to do these kinds of things with more than just this one galaxy though. I’ve started looking at how these techniques can measure how fast the disks of spiral galaxies grew, using a large sample of spiral galaxies identified by Galaxy Zoo 2 volunteers. I’m also trying to measure how quickly stars get mixed away from spiral arms in different types of spiral galaxies. I have started to find some hints of some exciting results on both of these topics, which I would love to share in a future blog post if you’re interested.
We need volunteers to tell us where the spiral arms and bars are in galaxies, so that we can start to see what makes these regions special.
However, I’m currently limited in the number of galaxies with spiral arm regions identified by Galaxy Zoo:3D volunteers, so it would be really helpful if we could get some more! Understanding what makes spiral structure appear in disky galaxies is one of the unsolved problems in galaxy evolution and formation, and the clues to finding out might well lie in measuring how spiral arms affect the galaxy’s stars. Galaxy Zoo:3D will definitely be able to play a role in this! Help us out at https://www.zooniverse.org/projects/klmasters/galaxy-zoo-3d.
The Green Valley is a Red Herring
Great news everybody! The latest Galaxy Zoo 1 paper has been accepted by MNRAS and has appeared on astro-ph: http://arxiv.org/abs/1402.4814
In this paper, we take a look at the most crucial event in the life of a galaxy: the end of star formation. We often call this process “quenching” and many astrophysicists have slightly different definitions of quenching. Galaxies are the place where cosmic gas condenses and, if it gets cold and dense enough, turns into stars. The resulting stars are what we really see as traditional optical astronomers.
Not all stars shine the same way though: stars much more massive than our sun are very bright and shine in a blue light as they are very hot. They’re also very short-lived. Lower mass stars take a more leisurely pace and don’t shine as bright (they’re not as hot). This is why star-forming galaxies are blue, and quiescent galaxies (or “quenched” galaxies) are red: once star formation stops, the bluest stars die first and aren’t replaced with new ones, so they leave behind only the longer-lived red stars for us to observe as the galaxy passively evolves.

Example images of galaxies classified by you. There are blue, green and red spirals, and blue, green and red ellipticals.

As @penguin galaxy (aka Alice) put it….
Blue Ellipticals & Red Spirals
The received wisdom in galaxy evolution had been that spirals are blue, and ellipticals are red, meaning that spirals form new stars (or rather: convert gas into stars) and ellipticals do not form new stars (they have no gas to convert to stars). Since you’re taking part in Galaxy Zoo, you know that this isn’t entirely true: there are blue (star-forming) ellipticals and red (passive) spirals. It’s those unusual objects that we started Galaxy Zoo for, and in this paper they help us piece together how, why and when galaxies shut down their star formation. You can already conclude from the fact that blue ellipticals and red spirals exist that there is no one-to-one correlation between a galaxy’s morphology and whether or not it’s forming stars.

The colour-mass diagram of galaxies, split by shape. On the right: all galaxies. On the left: just the ellipticals (or early-types) on top and just the spirals (or late-types) on the bottom. On the x-axis is the galaxy mass. On the y-axis is galaxy colour. Bottom is blue (young stars) and top is red (no young stars).
Blue, Red and…. Green?
A few years back, astronomers noticed that not all galaxies are either blue and star forming or red and dead. There was a smaller population of galaxies in between those two, which they termed the “green valley” (the origin of the term is rather interesting and we talk about it in this Google+ hangout). So how do these “green” galaxies fit in? The natural conclusion was that these “in between” galaxies are the ones who are in the process of shutting down their star formation. They’re the galaxies which are in the process of quenching. Their star formation rate is dropping, which is why they have fewer and fewer young blue stars. With time, star formation should cease entirely and galaxies would become red and dead.
The Green Valley is a Red Herring
Ok, why is this green valley a red herring you ask? Simple: the green valley galaxies aren’t a single population of similar galaxies, but rather two completely different populations doing completely different things! And what’s the biggest evidence that this is the case? Some of them are “green spirals” and others are “green ellipticals”! (Ok, you probably saw that coming from a mile away).
So, we have both green spirals and green ellipticals. First: how do we know they must be doing very different things? If you look at the colour-mass diagram of only spirals and only ellipticals, we start to get some hints. Most ellipticals are red. A small number are blue, and a small number are green. If the blue ellipticals turn green and then red, they must do so quickly, or there would be far more green ellipticals. There would be a traffic jam in the green valley. So we suspect that quenching – the end of star formation – in ellipticals happens quickly.
In the case of spirals, we see lots of blue ones, quite a few green one and then red ones (Karen Masters has written several important Galaxy Zoo papers about these red spirals). If spirals slowly turn red, you’d expect them to start bunching up in the middle: the green “valley” which is revealed to be no such thing amongst spirals.

We can time how fast a galaxy quenches. On the x-axis is the optical colour, dominated by young-ish stars, while on the y-axis is a UV colour, dominated by the youngest, most short-lived stars.
Galaxy Quenching time scales
We can confirm this difference in quenching time scales by looking at the ultraviolet and optical colours of spirals and ellipticals in the green valley. What we see is that spirals start becoming redder in optical colours as their star formation rate goes down, but they are still blue in the ultraviolet. Why? Because they are still forming at least some baby stars and they are extremely bright and so blue that they emit a LOT of ultraviolet light. So even as the overall population of young stars declines, the galaxy is still blue in the UV.
Ellipticals, on the other hand, are much redder in the UV. This is because their star formation rate isn’t dropping slowly over time like the spirals, but rather goes to zero in a very short time. So, as the stellar populations age and become redder, NO new baby stars are added and the UV colour goes red.
It’s all about gas
Galaxies form stars because they have gas. This gas comes in from their cosmological surroundings, cools down into a disk and then turns into stars. Galaxies thus have a cosmological supply and a reservoir of gas (the disk). We also know observationally that gas turns into stars according to a specific recipe, the Schmidt-Kennicutt law. Basically that law says that in any dynamical time (the characteristic time scale of the gas disk), a small fraction (around 2%) of that gas turns into stars. Star formation is a rather inefficient process. With this in mind, we can explain the behaviour of ellipticals and spirals in terms of what happens to their gas.

A cartoon version of our picture of how spiral galaxies shut down their star formation.
Spirals are like Zombies
Spirals quench their star formation slowly over maybe a billion years or more. This can be explained by simply shutting off the cosmological supply of gas. The spiral is still left with its gas reservoir in the disk to form stars with. As time goes on, more and more of the gas is used up, and the star formation rate drops. Eventually, almost no gas is left and the originally blue spiral bursting with blue young stars has fewer and fewer young stars and so turns green and eventually red. That means spirals are a bit like zombies. Something shuts off their supply of gas. They’re already dead. But they have their gas reservoir, so they keep moving, moving not knowing that they’re already doomed.

A cartoon version of how we think ellipticals shut down their star formation.
Ellipticals life fast, die young
The ellipticals on the other hand quench their star formation really fast. That means it’s not enough to just shut off the gas supply, you also have to remove the gas reservoir in the galaxy. How do you do that? We’re not really sure, but it’s suspicious that most blue ellipticals look like they recently experienced a major galaxy merger. There are also hints that their black holes are feeding, so it’s possible an energetic outburst from their central black holes heated and ejected their gas reservoir in a short episode. But we don’t know for sure…
So that’s the general summary for the paper. Got questions? Ping me on twitter at @kevinschawinski
Galaxy Zoo and undergraduate research: spiral arms, colors, and brightnesses
The guest post below is by Zach Pace, an undergraduate physics student at the University of Buffalo. Zach worked at the University of Minnesota during the summer of 2013 through the NSF’s Research Experience for Undergraduates (REU) program. Zach is continuing to work with Galaxy Zoo data as part of his senior thesis.
Hi, everyone–
My name is Zach Pace. I’m an undergraduate physics student from the University at Buffalo, and I’ve been working on the Galaxy Zoo 2 project at the University of Minnesota since late May with Kyle Willett and Lucy Fortson. My investigation has been twofold: I have been diagramming specific morphological categories in color-magnitude space, and also fitting those data to mathematical functions.
As many readers probably know, a galaxy’s magnitude (overall brightness in the red band, on a log scale) and a galaxy’s color (the difference between the blue magnitude and a red band) are two important quantities for determining what a galaxy might look like (and how it might evolve). Brighter galaxies have more mass (more stars produce more light, of course), and bluer galaxies have a more recent star formation history (this is because young, bright stars tend to be large, bright, and blue). In terms of the whole population, we know, for instance, that elliptical galaxies tend to concentrate in a red sequence, and have typical colors between 2.25 and 2.75. Conversely, the vast majority of spiral galaxies concentrate in a blue cloud between colors 1.25 and 2.0. These two populations are clearly separated in color-magnitude space (this can be seen in the accompanying 2-D histogram, made from Zoo 2 data).

Color-magnitude diagram (CMD) for objects in Galaxy Zoo 2. The lines show fits to the two main populations of elliptical (red) and spiral (blue) galaxies, following the method of Baldry et al. (2004). The green line shows an approximate separation between them.
One of the main goals of Zoo 2 is to gauge the extent to which morphology informs physical characteristics like color and magnitude, so my objective for the summer was to come up with good representations of color and magnitude for all of the smaller sub-populations in Zoo 2.
Several of my results were interesting and surprising. For instance, it has been suggested that spiral galaxies with more arms and spiral galaxies with tighter arm winding (which is to say, a shallower pitch angle) tend to be brighter and bluer. This can be intuitively understood as follows: tighter winding of spiral arms and the presence of more spiral arms indicate, on average, denser gas clouds in those arms, which is tied to increased star formation and bluer color. However, I wasn’t able to measure this in the Zoo 2 data (all the differences were on the order of the histograms’ bin size, about 0.1 magnitude, or about a 10% difference in brightness). This suggests that spiral galaxies, no matter arm multiplicity or winding, are drawn from the same base population.

Color-magnitude diagram (CMD) for spirals in GZ2, split by the number of spiral arms identified in each galaxy. The distribution of colors and magnitudes for galaxies are statistically similar, no matter what the number of spiral arms.
I also came across something unexpected when looking at bulge sizes in face-on disk galaxies. The distribution of galaxies classified by users as bulgeless is starkly different from the distribution of obvious bulge and bulge-dominated galaxies. Furthermore, the population with a bulge that is just noticeable seems to form an intermediate population between the bulgeless and bulge. This observation is also borne out in edge-on disk galaxies: the population of bulgeless edge-on galaxies has a similar shape to the population of face-on galaxies, albeit with stronger reddening on the bright end.

Color-magnitude diagram (CMD) for disk galaxies in Galaxy Zoo 2, split by the relative size of the central bulge. Galaxies that appear to have no central bulge (top) have very different colors and luminosity than those with dominant bulges (bottom).
To fit the distributions, I used a method pioneered about 10 years ago by Ivan Baldry, which fits one parameter after another in our profile functions to find a distribution that converges onto the best fit. It works okay (but not great) for the whole sample, and it fails pretty badly when working with the smaller sub-populations. This is because I have to fit many parameters at once, and do that a bunch of times in a row for the fit to converge, so there are a lot of points of failure. I’m working now at Buffalo towards finding a different and better fitting routine, which will allow us to represent more distributions mathematically.
If you have any questions, feel free to comment below.
Clicking 10 Billion Years Into The Past
Astronomers use funny units. We have the light-year, which sounds like a time but is actually a distance. There’s the parsec, a historical (but still used) unit of distance that was famously mis-used as a time in Star Wars. And then there’s redshift, which is actually a velocity — distance divided by time — but which, because of the expansion of the universe, astronomers get to use as a proxy for distance.
While it may be convenient for us to use distance units where we set a mind-blowingly large number equal to 1, it doesn’t really help us communicate our work to the public. If I note that the galaxy images from CANDELS look a little different from the galaxies in the SDSS because the CANDELS galaxies are typically at a redshift of 2, that’s pretty meaningless. But it’s a little different to think of the fact that, when you classify a galaxy from CANDELS, you may be looking three-quarters of the way to the edge of the visible universe, and seeing the galaxy as it was 10 billion years ago.

Okay, that’s kinda cool.
During this hangout, we announced that your clicks and classifications of the CANDELS galaxies have been moving at such an impressive rate that the first round is finished. Every galaxy has enough classifications for us to get a very good sense of what its morphology is. It may be that, for some of the galaxies where there are clearly more details to flush out, we will ask for a few more classifications per galaxy. And there will probably be future CANDELS images from survey fields that are still being completed. So, don’t worry, there will still be plenty of opportunities to classify galaxies as they were 10 billion years ago!
In the meantime, though, we’re getting ready not just to do the scientific analysis, but to share Galaxy Zoo results with our colleagues around the world. The summer conference season is upon us, and many of us have given and are giving talks and posters at various meetings in various cities. This includes not just the recent meeting highlighting the importance of galaxy morphology in the era of large surveys at the Royal Astronomical Society and the upcoming ZooCon in Oxford and Galaxy Zoo meeting in Sydney, but also several more general conferences, including the 222nd American Astronomical Society meeting and the upcoming UK National Astronomy Meeting. Spreading the word about the scientific results we’re finding with Galaxy Zoo is one of the most important parts of our job — and it doesn’t hurt that in order to do that we have to visit some very interesting places. During the hangout we chatted a bit about that and also took some of your questions:
Note: although it was a beautiful sunny day in Oxford, the variable audio quality is not because I was occasionally distracted looking out the window. I don’t think it was the new microphone, either. We’ll look into it, but in the meantime I’ve tried to equalize the podcast version with some after-editing, so hopefully that is slightly better.
Oh, Sweet Spiral Of Mine

See the video of our latest hangout here (or, if you prefer, click to download the podcast version):
Spiral galaxies are seemingly endless sources of fascination, perhaps because they’re so complex and diverse. But why does spiral structure exist? Why do some spiral galaxies have clearly defined spiral arms and others have flocculent structure that barely seems to hold together? What’s the difference between a 2-arm spiral and a 3-arm spiral? How many kinds of spirals do we actually observe? And what is happening to the stars and gas in spiral galaxy disks?
.")
Clockwise from top right: X-ray, UV, optical, near-IR, mid-IR, far-IR, radio
All of the above questions are related to a question we got right at the end of our last hangout: what is the significance of the number of spiral arms? Determining how many spiral arms a galaxy has is hard, and is often subjective — so why bother?
It’s a good question. Part of the reason spiral arm classification & count is a challenge is that it often depends on the wavelength at which you observe a galaxy. New stars tend to form along the spiral arms, whereas older stars have time to spread out into more uniform orbits. So ultraviolet observations of a galaxy, which tend to pick out the new and bright stars, often highlight the spiral arms much more strongly than longer-wavelength observations, which see more light from older stars.
It’s not quite that simple, though. As you get to longer and longer wavelengths, you start to pick up the heat radiated by clouds of gas and dust, which are often stellar nurseries — and often trace spiral arms. At a wavelength of 21 centimeters you can detect neutral Hydrogen, which provides raw material for the cooling and condensation of gas into cold, dense molecular clouds that form stars in their densest pockets. Each wavelength you observe at provides a glimpse at a different targeted feature of a spiral galaxy.
A map of neutral Hydrogen in the Milky Way — complete with yellow “you are here” arrow.
Including our own, of course: we live in a spiral galaxy (though how many arms it has, and whether it’s flocculent, is a matter of debate), and it provides the best means of studying star formation up close. When studying other galaxies, it’s easy to get caught up in the race to discover the biggest, the smallest, the farthest and the most extreme, and forget that our own Universal neighborhood is pretty amazing too.

Herschel sees much longer wavelengths than HST, so its resolution isn’t as high even though it has a bigger mirror. (Click to see a larger version.) Credit: ESA/NASA
For example, one of the most famous nebulae in the world was recently imaged by one of the most famous telescopes in the world — again — but this time in the near-infrared. The Horsehead Nebula is a well-known feature in the Orion star-forming complex, and the new Hubble images provide a great opportunity to learn even more about this region that has been studied for hundreds of years. How thick and cold is the gas and dust in the nebula? How long will it take for it to dissipate under the harsh radiation of the bright, young stars near it? What’s going on behind it?
The near-infrared view from HST is sort of the sweet spot in this spectacular space — the wavelengths aren’t so long that the resolution suffers, but they are long enough that you see through a bit more of the clouds than in the optical. So you see more of the structure of the cloud itself, and more of where it’s thin and thick. If you zoom in, you can even see distant galaxies peeking through! And not just on the edges: in some parts you can see galaxies through the middle of the nebula. Wow. This image alone contains spiral galaxy insights big and small, near and far, from the very distant universe and right in our own backyard.
Note: right at the end of the hangout, we again got another great question from a viewer that we didn’t have time to answer. So stay tuned for the next hangout when we just might have a thing or two to say about dark matter, dark energy and new projects!
Two Atoms Populate on a Dust Grain
I enjoy days where we get to use questions from the public to meander our way through the Universe. Our latest live hangout saw us discussing the latest update to the Galaxy Zoo site — made based on your clicks! — and doing a live, collective classification on a few example objects from our Hubble sample that we hope represent the kind of things you’ll be seeing more of from now on.
We debated, for example, whether this galaxy’s central “feature” was a bulge or a bar:
.")
We also discussed whether these galaxies are merging or overlapping.
Whether this relatively featureless galaxy’s blue smudge indicates a voorwerp:

Depending on the redshift, a voorwerp in Hubble could be blue, green or red.
And how many spiral arms this galaxy has:

Also, these two galaxies may have roughly the same proportions between them as between the Milky Way and the Large Magellanic Cloud.
We also talked about the origin and importance of dust in galaxies, and just what a green pea would look like in the Hubble data. Green peas are galaxies with incredibly high rates of star formation. They’re rare in the local Universe, but how rare do we think they were billions of years ago, at the epoch we’re looking back to with Hubble?

Thing is, a “green pea” at redshift z=2 would be bright red.
And, for that matter, what were the stars like then? Astronomers very broadly group stars into three populations depending on their composition. The very earliest stars were made from the primordial elements forged during the Big Bang — almost entirely Hydrogen and Helium, nearly devoid of anything else (we call “anything else” a metal, including elements like Carbon and Oxygen). The next generation of stars had some metals, but the Universe has been around long enough that those stars (even the lower-mass ones that live for a long time) are past their prime and a new generation, one with compositions generally like our Sun, are now in their heyday.
Naturally, though, since the Sun is our First Star, we call its generation Population I. The slightly older stars, many of which are still around and living in our galaxy and others, are Population II; and the very massive rockstars of the early universe that have all died out are called Population III. So “Pop III” were the first stars — a slight reversal, but labels and names that seemed like a better idea at the time than with hindsight are nothing new in Astronomy. (Exhibit A: the magnitude system. Exhibit B: “planetary nebula“.)
Bonus: green peas, voorwerpjes, and planetary nebulae are just three of the phenomena that (at least in part) glow green to human eyes because of one particular frequency of light emitted by Oxygen at a certain temperature, an atomic transition seen only rarely on Earth but fairly often in the Universe.

This VLT image shows the planetary nebula IC 1295 in ghostly green. Image Credit: ESO
Also, did you know that dust grains are the singles bars of the atomic universe, allowing atoms to meet and combine into molecules and cooling the gas clouds they live in — which in turn helps new stars form? Heating and cooling, gravity and pressure, and the interplay between atoms, molecules, and radiation are all a part of what gives us this amazingly diverse Universe. We understand quite a lot of it given that we are such a tiny part of it, but what we know is dwarfed by what we don’t. And that’s just the way astronomers like it… we love a challenge and we’re glad to have as much help as possible sorting things out.
Here’s the hangout video:
New paper on the Galaxy Zoo bars accepted to MNRAS
I’m delighted to announce that the latest paper based on Galaxy Zoo classifications was accepted to appear in the Monthly Notices of the Royal Astronomical Society earlier this week, and appears on the arxiv this morning (link).
Usually there is a long delay between submission and acceptance of papers (something Kevin discussed on this blog in “What Happens Next – Peer Review“), but in this case the initial referee report came back after 2 days, and the paper was accepted only 2 weeks after the first submission so I never got time to post to the arxiv or write a blog post about it before it was accepted! This was certainly the smoothest and fastest referee process I’ve been through. 😉
Here’s the title page.

So what was new about this paper was that we combined information on the morphologies (whether or not the spiral galaxies had bars) with information on the amount of atomic hydrogen gas the galaxies contained and and our main result was that galaxies with more atomic gas in them, are less likely to have a bar.
But I want to back up a bit first and tell you about where we get this information on the atomic gas content, and why it might be interesting. As you might guess from the title of the paper it’s from something called the ALFALFA survey (and the new names in the author list for a Galaxy Zoo paper – Martha Haynes and Riccardo Giovanelli – are from Cornell University who are running this survey). Atomic hydrogen emits radio waves at a frequency of 1.4 GHz (or 21cm). This is detectable by a classic radio telescope (in what we call the “L”-band which makes up the second L of ALFALFA). In the case of ALFALFA, we use the Arecibo radio telescope (two of the “A”s in the acronym stand for Arecibo, the third is for array), which is the worlds biggest single dish radio telescope deep in the jungle of Puerto Rico.

Aerial shot of Arecibo. Credit: NAIC.
ALFALFA is a massive survey which will map the location of atomic hydrogen over basically the whole sky visible to the Arecibo radio telescope. What’s neat about a survey for something which emits as a specific frequency is that you actually get a 3D map of where the hydrogen is – both redshift and sky position! Anyway, we made use of about 40% of the survey which is already complete, and which covers about 25% of the area of the sky in which the Galaxy Zoo galaxies are found (the Sloan Digital Sky Survey Legacy Area). Adding some cuts on how face-on the galaxies are so that the bars can be identified, and to make sure the sample contains the same size galaxies right through it’s volume we ended up with 2090 galaxies with both atomic hydrogen detections and bar classifications from you guys. This is an order of magnitude larger than any similar sample! So thanks. 🙂
Atomic hydrogen is the basic building block of galaxies (after dark matter). It represents the fuel for future star formation in a galaxy – a galaxy with a lot of atomic hydrogen could in principle make a lot of new stars. Many spiral galaxies have a lot of atomic hydrogen (with perhaps as much as 10 times as much mass in hydrogen as in stars!), while a typical elliptical galaxy has very little atomic gas, and so cannot form lots of new stars.
So our observation that bars are more likely to be found in spiral galaxies with less atomic gas supports our earlier ideas about bars possibly “killing” spirals (ie. helping to stop them form stars).

Trends of bar fraction with atomic gas content, galaxy colour and how many stars are in a galaxy.
Of course it’s never quite that straightforward with galaxies. To start with correlation is not the same as causation, and to that we add that lots of things are correlated. We show some of that in the figure above. Bars are more likely in redder spirals which have more stars (“log Mstar” represents stellar mass in units relative to the mass of our Sun) and which also have less atomic gas. So the skeptical astronomer could say this has nothing to do with the gas content at all, just that the types/sizes of galaxies with less bars have more gas. To test that idea we measured the typical gas content of a spiral galaxy with a given number of stars, and from that we calculated how “deficient” or rich in atomic hydrogen any given galaxy was. Then we plotted the bar fraction against that. The convention in astronomy is to call how much less atomic hydrogen a galaxy has than normal it’s “HI deficiency” which gets bigger the less atomic hydrogen there is (from the people who brought you the magnitude scale!).

Bar fraction against how much more or less atomic gas a galaxy has than is typical for the number of stars it has. Bigger HI deficiency = less atomic gas than is normal for a galaxy’s size.
Anyway you can see we still see a clear trend, which demonstrates that it’s likely to be the atomic gas driving the correlation. Where a galaxy is richer in atomic hydrogen than normal it’s less likely to host a bar, and vice versa. Very atomic hydrogen rich galaxies which are massive and have bars are really quite rare!
Here are some examples of low and high mass galaxies which are gas rich or poor and with or without bars. 🙂

Example images.
I made images of the whole sample we use available here.
At the end of the paper we put forward three possible explanations for the correlation, all of which fit in with the observations we presented. It’s possible that the bars are causing the atomic gas in galaxies to be used up faster – “killing” the galaxy. The bar does this by driving the gas to the centre of the galaxy where it gets denser, turns into molecular hydrogen and from that stars (but only in the centre). It’s also possible (based on dynamical studies of galaxies) that gas slows down the formation of a bar in a spiral galaxy, and/or destroys the bar. Finally it’s possible that as a galaxy interacts with its neighbours, a bar gets triggered and its gas gets stripped (ie. the correlation between the two is caused by an external process). We’ll need to do more work to figure out which of these (or which combination of them) is the most important.
To my mind the most interesting result was a hint that if a gas rich galaxy does (rarely) host a bar, it’s optically redder than similar galaxies without bars. It’s just possible that bars hold back infall of gas from the outer regions of a spiral galaxy and slow down star formation over all in that galaxy. That idea needs testing, but if it’s true it’s saying that an internal structure like a bar plays an important role in the global star formation history of a galaxy.
Anyway thanks again for the classifications, and I hope the above made at least some sense! 😉
The Hubble Tuning Fork
The gold standard for galaxy classification among professional astronomers is of course the Hubble classification. With a few minor modifications, this classification has stood in place for almost 90 years. A description of the scheme which Hubble calls “a detailed formulation of a preliminary classification presented in an earlier paper” (an observatory circular published in 1922) can be found in his 1926 paper “Extragalactic Nebulae” which is pretty fun to have a look at.
Hubble’s classification is often depicted in a diagram – something which is probably familiar to everyone who has taken an introductory astronomy course. Astronomers call this diagram the “Hubble Tuning Fork”. I have been meaning for a while to make a new version of the Hubble tuning fork based on the type of images which were used in Galaxy Zoo 1 and 2 (OK the prettiest ones I could find – these are not typical at all). Anyway here it is. The Hubble Tuning Fork as seen in colour by the Sloan Digital Sky Survey:

I should say that my choice of galaxies for the sequence owes a lot of credit to an excellent Figure illustrating galaxy morphologies in colour SDSS images which can be found in this article on Galaxy Morphology (arXiV link) written by Ron Buta from Alabama (Figure 48). I strongly recommend that article if you’re looking for a thorough history of galaxy morphology.
Inspired by the “Create a Hubble Tuning Fork Diagram” activity provided by the Las Cumbres Observatory, I also provide below a blank version which you can fill in with your favourite Galaxy Zoo galaxies should you want to. I have to say though, the Las Cumbres version of the activity looks even more fun as they also talk you through how to make your own colour images of the galaxies to put on the diagram.

Anyway I hope you like my new version of the diagram as much as I do. Thanks for reading, Karen.
The Anatomy of Galaxies
Following on from my post about the Hubble diagram, I thought I’d mention a bit about the main types of galaxies that are out there. Galaxies come in three basic types: spirals, ellipticals and irregulars. Each of these three broad morphologies of galaxy tells us a little about what is going on inside the galaxy itself. They are all structured differently.
Spiral Galaxies
The spiral arms of a galaxy contain most of the interstellar medium – dust and other material between stars – within a galaxy. It is in the spiral arms that new stars are forming, hence their usually bright, blueish or white colour. Spirals are made of about 10-20% dust and gas. This is the source material for the stars that are forming within the spiral arms. It is the dust that obscures background light to create the dark lanes you see in spiral galaxies. You can the arms and the dust lanes very well in this artistic impression of our own galaxy, the Milky Way from Nick Risinger / NASA.

The central bulge of spiral galaxy contains older, redder stars and often also contains a invisible, massive black hole. Some, but by no means all, central bulges have the appearance of a mini elliptical galaxy.
The central bulge and spiral arms vary greatly in appearance from galaxy-to-galaxy. But of course, you know this from working on Galaxy Zoo!

Spiral galaxies are also made up of a third component: the galactic halo. This is an almost spherical fuzz of stars and globular clusters surrounding the galaxy, trapped by gravity. You can see the halo quite well in the above image of the Sombrero Galaxy, which is a spiral seen almost edge-on. This image is from Hubble Heritage
Ellipticals
Elliptical galaxies are essentially all bulge and nothing else! In an elliptical galaxy the stars tend to be older and there is less gas and dust around. The stars orbit around the centre of mass of the galaxy in a more random way – their orbits are not constrained to a disk shape. There is very little star formation going on in elliptical galaxies and so they usually appear reddish in colour: dominated by older, cooler stars.
Irregulars
There is obviously little to say about the structure of irregular galaxies because they are irregular. They make up about a quarter of all galaxies. It is thought that many irregulars were once ellipticals or spirals and have been distorted by interactions or collisions with other galaxies. Irregular galaxies can have very high star formation rates and can contain a lot of dust and gas – often more than spiral galaxies.

Galaxy Zoo: Hubble has a whole new branch of questions to try and help classify these clumpy galaxies.
Dwarf Galaxies
You could add this fourth category to the list of galaxy types. Dwarf galaxies might appear to be just smaller versions of the above types, but they are the most common type of galaxy. There are more dwarfs than any of the others, if you just count them up.
The Large and Small Magellanic Clouds – the LMC and SMC, which are visible in the Southern Hemisphere – are actually two small galaxies, orbiting around our own larger Milky Way. The image below, from Mr. Eclipse, shows both of these objects. The LMC is an irregular galaxy and the SMC is a dwarf.

We’ll continue talking about the different types of galaxies – and how they all fit together – in the next post in this series. In the meantime might I suggest yet another type of galaxy, perhaps with a coffee and a bit of classification?
Red spirals at night, astronomers' delight
We heard a few days ago that our paper on red spirals has been accepted by the journal. Not only is this another success for Galaxy Zoo science, but it’s a tribute to the hard work of Karen who led the effort. What with the first Zoo 2 paper being submitted and a few other distractions as well it’s been a very busy week for her.

The paper itself is another variation on what should be becoming a very familiar theme for those who have followed Galaxy Zoo science: colour and shape are not the same, and tell us different things. To recap slightly, as young, massive and short-lived stars are blue, colour is a measure of what’s happened recently. The blue spiral arms in the galaxy pictured below, for example, mark sites of recent star formation.
It was known long before Galaxy Zoo that most of the star formation in our local Universe takes place in spiral galaxies, and so they tend to be blue whereas ellipticals are often red. In looking at the blue ellipticals and now the red spirals, it’s clear that interesting things happen when this rule is broken.
Before we can work out what’s going on though, we have to find our red spirals, and this is trickier than it sounds. If we weren’t careful, then our sample would get contaminated by edge-on systems, which appear redder because of the effect of the dust that scatters light which travels through the disk. As this paper uses only Zoo 1 data, we just selected the roundest spirals assuming that this would get rid of those pesky edge-on systems; we also insist that Zooites were able to identify a direction to the spiral arms.
It turns out that 6% of spiral galaxies are red, which I think is higher than most would have guessed before this project. So how did a substantial number of spiral galaxies come to turn red? What caused them to cease forming stars and become what the paper title calls them : ‘Passive red spirals’?

One important clue is understanding where this process happens. It turns out that the greater the density of the environment a spiral finds itself in (that is, the more neighbours it has) the more likely it is to be red…but only up to a point. Once we find ourselves near the core of a cluster of galaxies, the number and fraction of red spirals drops dramatically. So whatever it is that is causing the spirals to turn red must be more likely in the outskirts of galaxy clusters, but relatively rare outside this particular environment.
The story is, as ever, a little more complicated than that. If it was the environment that was driving the dramatic change from blue to red, then we’d expect the properties of the red spirals to depend on the environment. We might find that those in the densest environments were redder than their (still quite red) counterparts further out, for example. But we don’t. We don’t see any connection between the properties of the red spiral and the environment they find themselves in.
In my next blog, I’ll look at what we do know about this mysterious population of galaxies unearthed by your hard work. Until then, if you want the gory details, you can find the latest version of the paper over here.
