
Here be SDRAGNS! Results from Radio Galaxy Zoo and Hubble’s Zoo Gems
It’s taken a while to get this finished, but I am happy to say that our paper combining Radio Galaxy Zoo and Hubble data on the rare spiral galaxies with large double radio sources (also known as SDRAGNs, Spiral Double Radio AGNs) has been accepted by the Astronomical Journal. The RGZ-HST sample is the largest set of such objects known (we found 15 cases, compared to 11 from everyone else published up through late 2025). With the collaboration of Alexei Moiseev and students using the 6-meter telescope, we could complete the set of redshifts and optical spectroscopic properties for these SDRAGNs
The Zoo Gems project of short-exposure Hubble observations gave us images of 36 potential SDRAGNs. Most of these turned out to be something else – a disturbed but not spiral galaxy, a spiral almost in front of the more distant radio galaxy… Still, we confirmed enough to more than double the known sample of these rare systems from 11 to 26, selected in more systematic ways than their predecessors. As a group, SDRAGNs have a wide range of Hubble types, from Sa to Sc – this was a bit unexpected, since the mass of the central black holes correlates with the bulge starlight, and the radio sources are probably powered by very massive black holes. (Also, another group including Wu, Ho, and Zhuang analyzed many of the Zoo Gems SDRAGN candidates and found that most of them have pseudobulges rather than classical bulges, which suggests that these galaxies have not undergone a major merger over their history). SDRAGN host galaxies are seen nearly edge-on more often than would be expected for a random set of spirals. We do not see many strong interactions, although there are several SDRAGNs with dust lanes twisted out of the galaxy plane which could result from a weak interaction a billion years before our current view. These galaxies occur in denser environments than average as traced by other galaxies, which fits with our understanding of the need to have circumgalactic gas for the radio jets to interact with in order to produce the powerful lobes of radio-emitting material. Combining the radio structures with galaxy properties from the Hubble images, perhaps our key results is that the radio jets merge preferentially within about 30 degrees of the poles of the galaxy disks. This helps understand why the jets make it outside the galaxy – they encounter the least interference from gas within the galaxy that way. This contrasts with the random orientations of those radio jets which happen in spiral Seyfert galaxies, which really do seem to have random directions and mostly dissolve within a few thousand light-years as they encounter the dense gas within the galaxy itself. Returning to the incidence of pseudobulges, within a major merger we expect the black hole to grow by incorporating material from within the galaxy, so it would keep roughly the same “spin” direction as the galaxy disk and impart that to the accretion disk and jets. This directionality seems to be more important than the mass or accretion rate of the black hole in producing SDRAGNs.
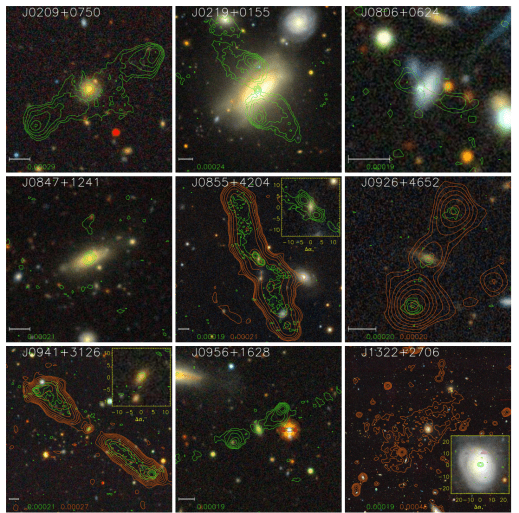
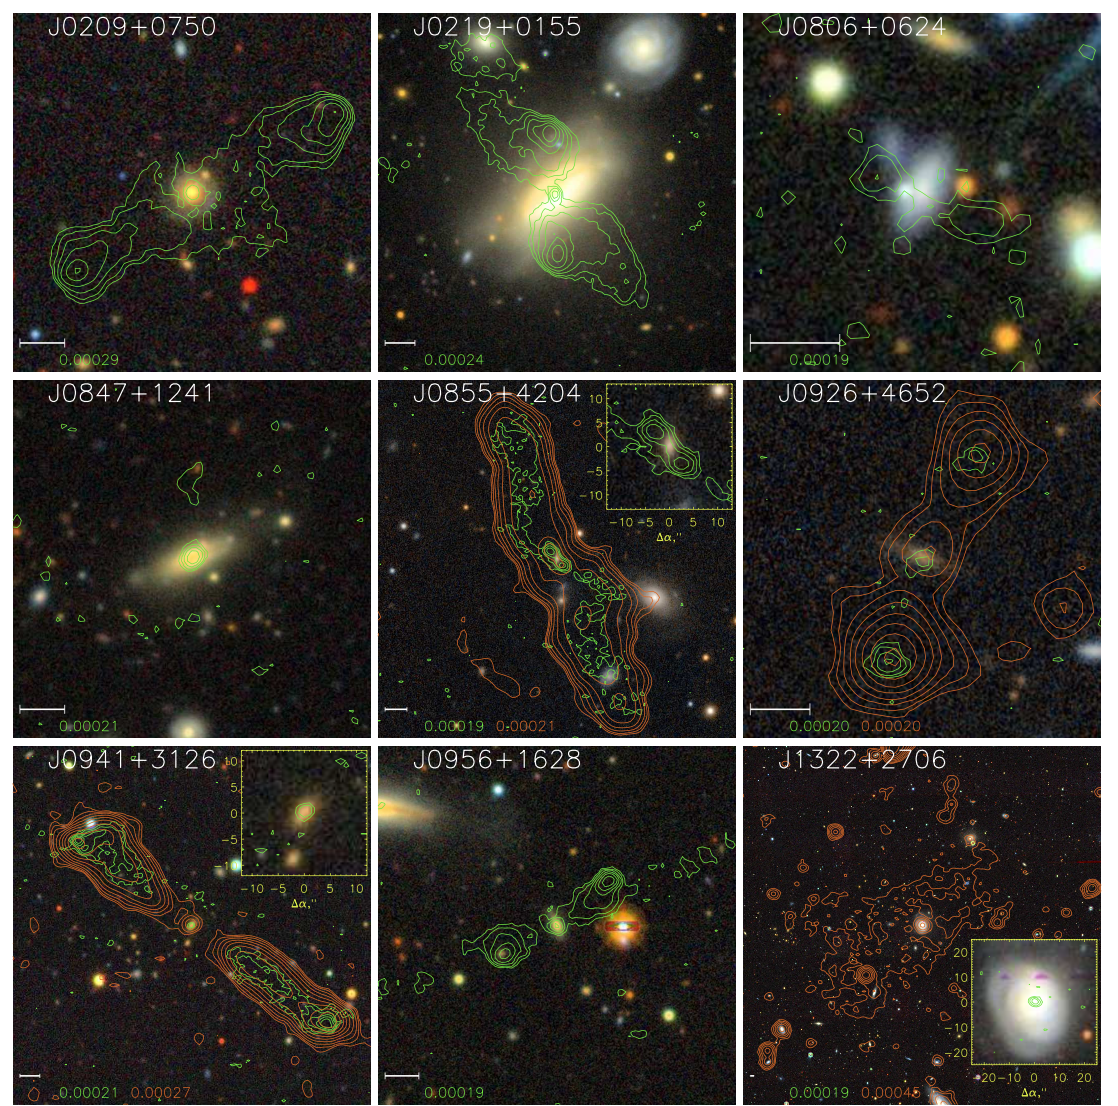
As examples of the data we could work with, here is a montage of 9 SDRAGNs using SDSS images overlaid with VLA Sky Survey contours (green) and contours from the lower-frequency LOFAR sky survey (orange). The LOFAR data became available only after the original Radio Galaxy, and are much more sensitive to the diffuse emission from radio lobes.
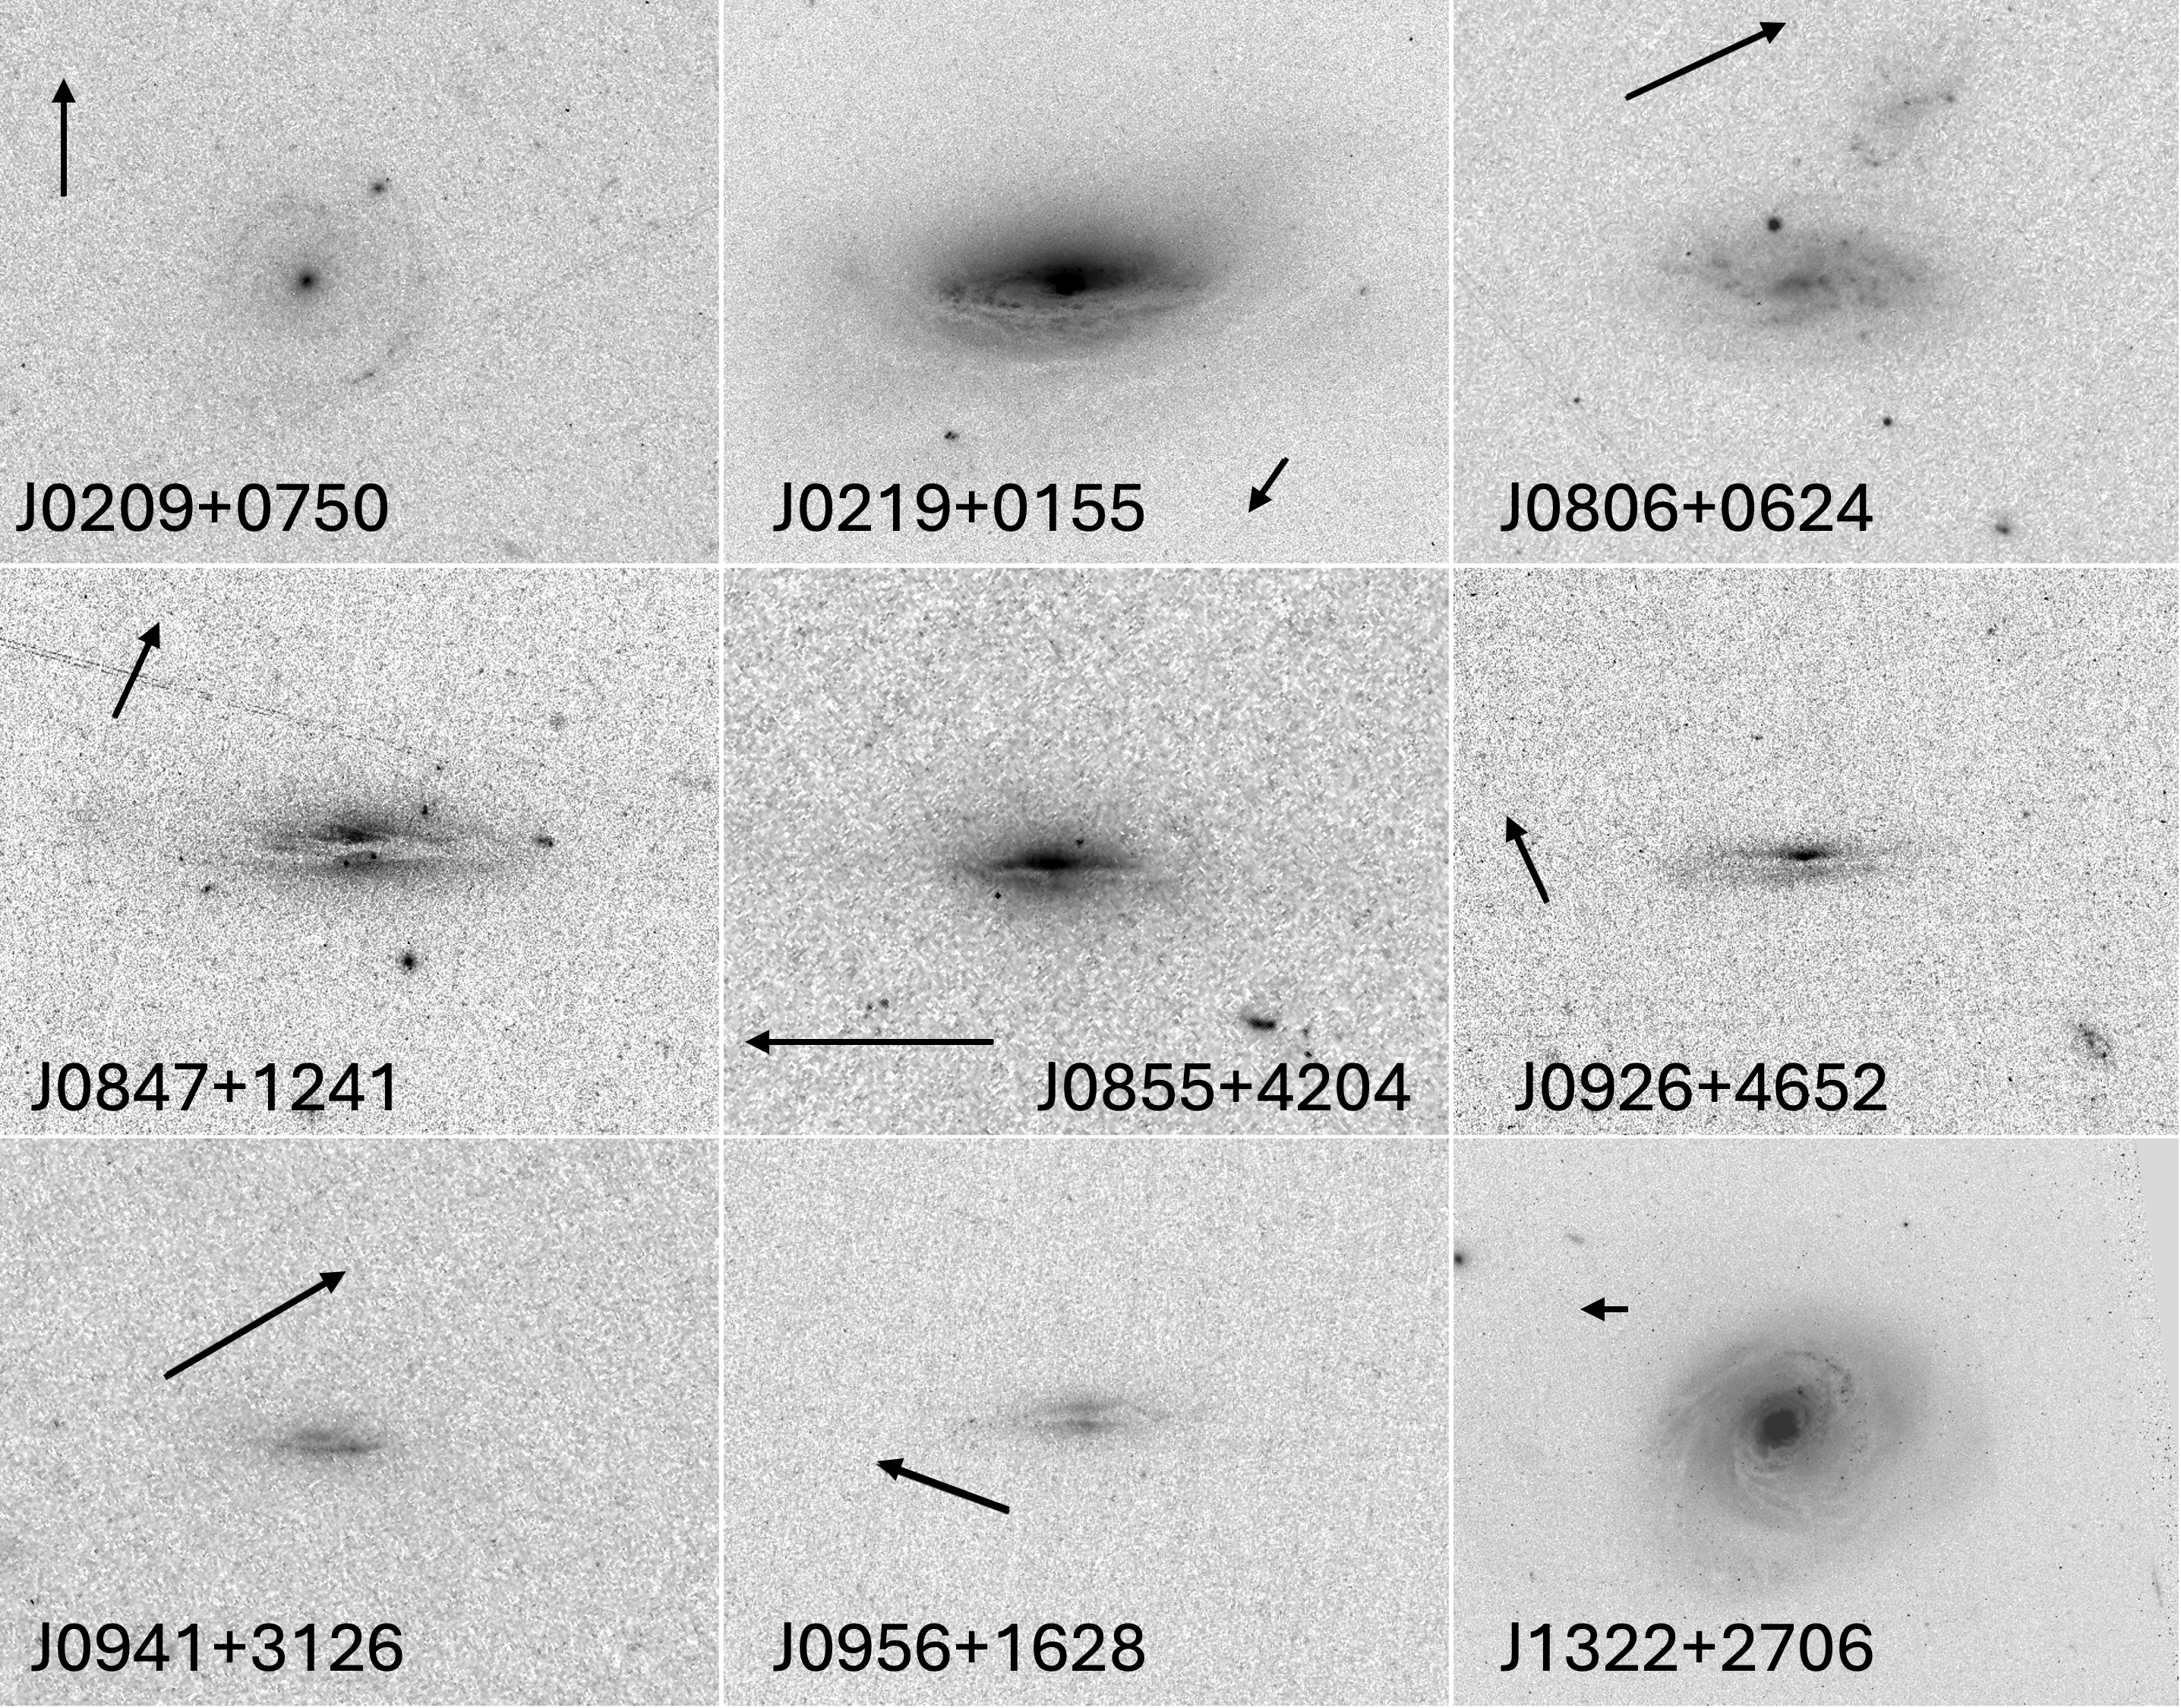
This montage shows the same nine SDRAGNs in negative views of the Hubble blue-light images. They are oriented so the galaxy plane is horizontal; arrows mark north and are 5 arcseconds long (matching the scale bars on the radio overlays).
Given the roots of Radio Galaxy Zoo and Zoo Gems in the Galaxy Zoo family, it would happen that one of the Hubble targets which turns out to not be a spiral does have a giant emission region similar to Voorwerpjes. We can’t help it, they are everywhere (and from some JWST data, almost everywhen too).
The manuscript is available from the arxiv repository (and from the AJ web site in a couple of months, after formal publication). Much of the text in the first two sections comes from a draft written by the late Jean Tate even before Hubble data started to arrive, and once again we regret that he did not live to see some of the later Hubble images. This was a favorite project of Jean, who managed most of the initial voting to select HST imaging candidates and kept the SDRAGN material in a PBWorks online repository, so well organized that we could reconstruct a great deal of the project detail from there. (The paper includes the master table of all 215 RGZ SDRAGN candidates in case someone else wants to follow them up).
Letting Things Slide: A New Trial Interface for Expressing Uncertainty
“How many spiral arms are in the image – is it two or three? Is that a disk viewed edge-on? I think so, but I’m not quite sure…” If you’ve interacted with Galaxy Zoo before, you may have asked yourself questions like these. Real galaxy images can be confusing. You may be uncertain!
Until now, you have always had to make a choice. There was no way to express uncertainty in your annotations. But now there is! Try it here.
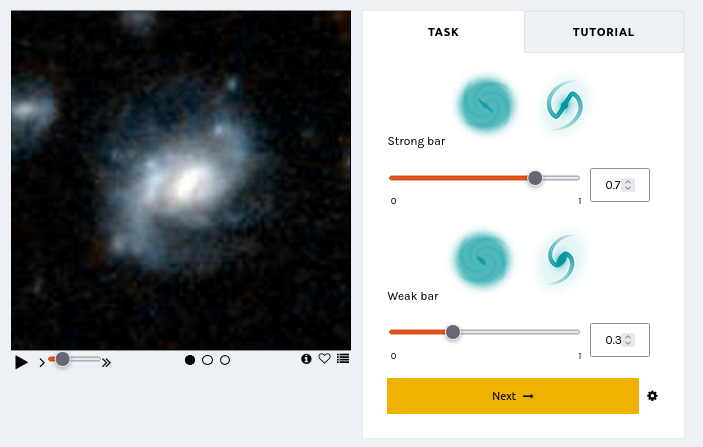
We are trialing a new experimental interface that lets you express your confidence in your annotations by dragging on a slider. This design is motivated by recent research indicating that we may be able to learn more, faster, by collecting annotator uncertainty [see this paper, this paper, this paper, this paper]. Allowing you to express your uncertainty by dragging a slider means that you – Zooniverse Friend – are providing more information with each click.
We believe this slider design might help us – through your support – discover more about galaxies, faster!
This is the second trial project we’re starting, adding to the Tags trial that Hayley introduced earlier on the blog. The big picture here is that we’re trying to think about how Galaxy Zoo could evolve in the coming years. As with any science project, we need to gather data and test our ideas.
Join in here and help us improve Galaxy Zoo.
We’ll run this trial for a short time – perhaps a couple of months – to gather your annotations and feedback. You can still use the current Galaxy Zoo that you know and (hopefully) love, at www.galaxyzoo.org.
Thank you for helping us,
Mike, Katie, and Ilia.
A Retrospective on the Evolution of Galaxy Zoo and a New Era in Galaxy Classification
So as to not bury the lede, we’re testing a new method for classifying galaxies with Galaxy Zoo Tags! If you want to skip my musings about the evolution of Galaxy Zoo, you can jump directly to the section introducing this new method here.
First, as a quick introduction, my name is Hayley Roberts and I’m a postdoctoral astrophysicist and data scientist for Zooniverse based at the University of Minnesota. I finished my PhD last year at the University of Colorado Boulder, studying a rare phenomenon found in extreme galaxy mergers called OH megamasers. As a postdoc, my work has broadened to studying galaxy evolution through major mergers and starburst galaxies. This has included evaluating how well our galaxy classification schemes work for high redshift, or more distant, galaxies.
Our Evolving View of Galaxies
When Galaxy Zoo (GZ) launched in 2007, the first campaign utilized data from the Sloan Digital Sky Survey (SDSS), a pioneering survey enabled by innovative instrumentation and data handling techniques. It cannot be overstated how much SDSS data revolutionized our understanding of many aspects of astronomy, but particularly galaxy evolution and morphology, through new insights such as the color-magnitude relation and galaxy environment. However, the galaxies in this SDSS sample have a median redshift of z~0.1 (~1.3 billion light-years away), meaning this first GZ campaign was limited to only our nearest neighboring galaxies. This is reflected in the earliest iteration of the GZ classification workflow, which only asked volunteers to determine if a galaxy was a spiral (edge-on, clockwise, or anti-clockwise), an elliptical, or a merger. Clearly, we had a long way to go before the myriad of potential other options reflected in the current GZ workflow were conceived.
What drove the expansion of the classification choices in Galaxy Zoo workflow?
Two things: you and the data. Before the launch of the first iteration of GZ, the hope was to get 20,000–30,000 volunteers to participate in the first few months — the actual number ended up surpassing 100,000. This fundamentally altered the outlook on what GZ was expected to be able to do. The first GZ data release included classifications for nearly a million galaxies, an order of magnitude more than previous comparable studies. This data enabled numerous studies on unprecedented scales (such as studying the properties of dust in spiral galaxies, compiling the largest sample of mergers at the time, and exploring the co-evolution of host galaxies and their AGN), and led to new discoveries (including green peas and voorwerpjes). These first couple years demonstrated that your classifications were enabling GZ to achieve extraordinary scientific results.
Since GZ’s launch, our view of the galaxies in our universe has expanded in number, diversity, and distance. Surveys, such as DESI, have allowed GZ volunteers (you!) to classify millions of galaxy images. The diversity of galaxies classified have inspired aspects of GZ classification tree iterations over the years or entire spinoff projects. However, over the years, the biggest change to the galaxies being classified on GZ has been evident through new technology and telescopes.
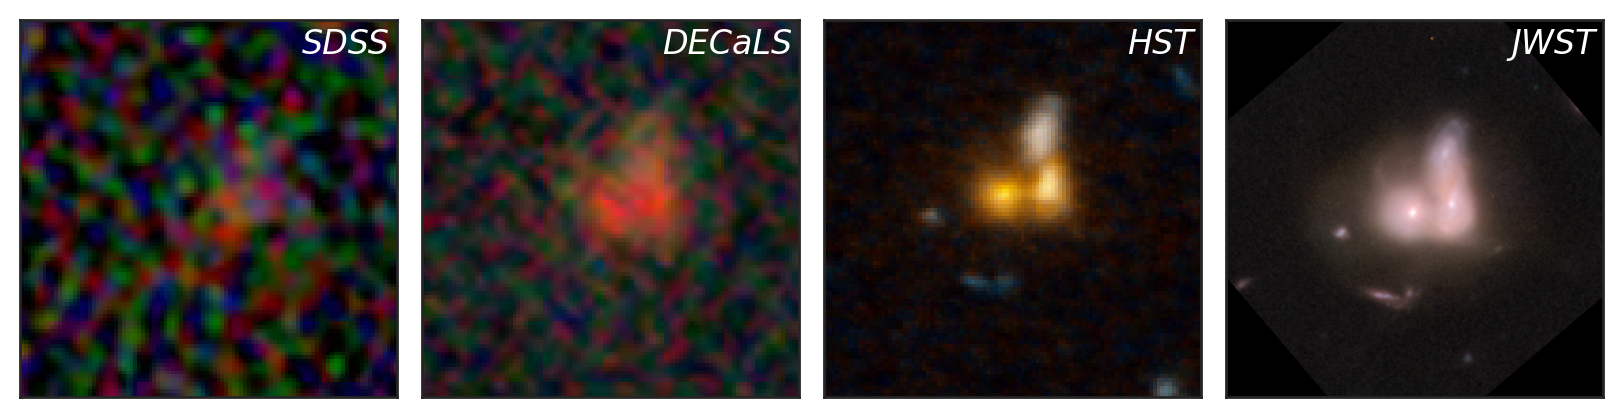
Above shows images of a galaxy obtained by four different telescopes or surveys that have starred in different GZ campaigns: SDSS, DECaLS, HST, and JWST. This galaxy, CANDELS J141937.3+525050.3, has a redshift of z=0.73 (~6.5 billion light-years away) and is a spectacular demonstration of just how our view of the universe has evolved. The SDSS and DECaLS images, the first and second panels, show a distant, unremarkable smudge of a galaxy. However, the images taken by HST and JWST, the third and fourth panels, unveil a spectacular merger between three galaxies. The higher sensitivity and resolution achieved over the years has given us unparalleled views of the galaxies in our neighborhood. Additionally, the number of high redshift galaxies in GZ has vastly increased, as well as the maximum redshift of these galaxies, particularly for JWST.
High redshift galaxies, those that are very distant and therefore seen as they were in the early universe, often defy traditional categories like spiral and elliptical galaxies. The universe was much younger and more dynamic when these galaxies formed, leading to a greater variety of shapes and structures. Unlike their more mature counterparts, high redshift galaxies frequently exhibit irregular and clumpy morphologies, complicating morphological measurements and making them harder to classify using traditional frameworks. Understanding high redshift galaxy morphology may require new classification schemes with less rigidity that account for their unique properties and the evolving state of the early universe.
Introducing Galaxy Zoo Tags: An Experimental New Way to Classify Galaxies
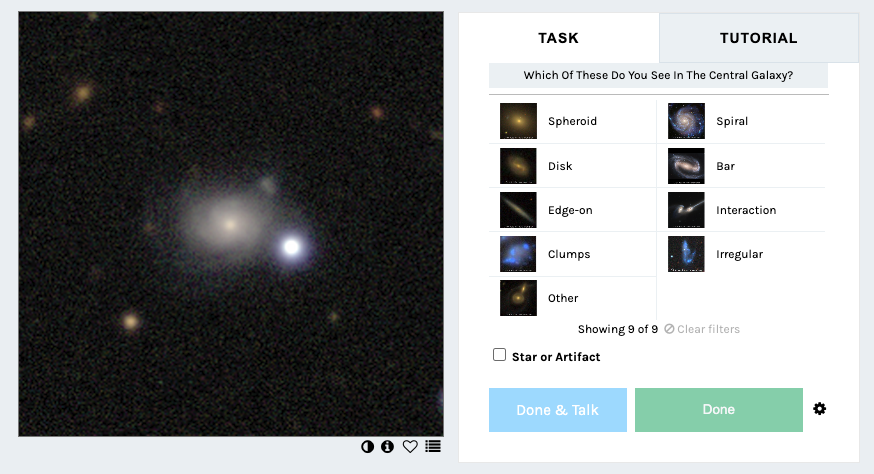
As we push the boundaries of our observations, the classification of high redshift galaxies presents new challenges, as discussed above. To address these challenges, we’re testing an alternative way to classify galaxies called Galaxy Zoo Tags! This workflow allows you to assign multiple “tags” (morphological features) to each galaxy without the restriction of working within the classification tree. This should allow for substantially more flexibility in classifications and feature combinations that might not be fully captured in the traditional classification tree.
You can start classifying using this new workflow right now on a sample of galaxy images from DECaLS and CEERS data from JWST. All images in this test period have been previously classified using the traditional classification tree. The goals of testing this method are to:
- Compare the results of the two different classification methods (tagging vs. traditional GZ tree), and
- Collect your thoughts and feedback on this new approach.
To help with the second goal, we’ve set up this Google form for you to provide feedback on this new classifying method. It’s also linked in the banner on the GZ Tags page. We would greatly appreciate your time testing this new method out and any thoughts or opinions you may have about it. If you have any questions, you can come chat with us on this Talk board.
We don’t have any plans to remove or replace the current GZ classification system at the moment. The future of this workflow style will be determined both by how helpful/informative the data is and your response. This is just one new approach, but there are likely many others we could pursue. As always, your input, feedback, and ideas are imperative to designing any potentially updated classification schemes, so please do consider testing out this new method and providing feedback via the Google form.
Thank you all again for your efforts and making this all possible.
Take a Peek at Some JWST Images
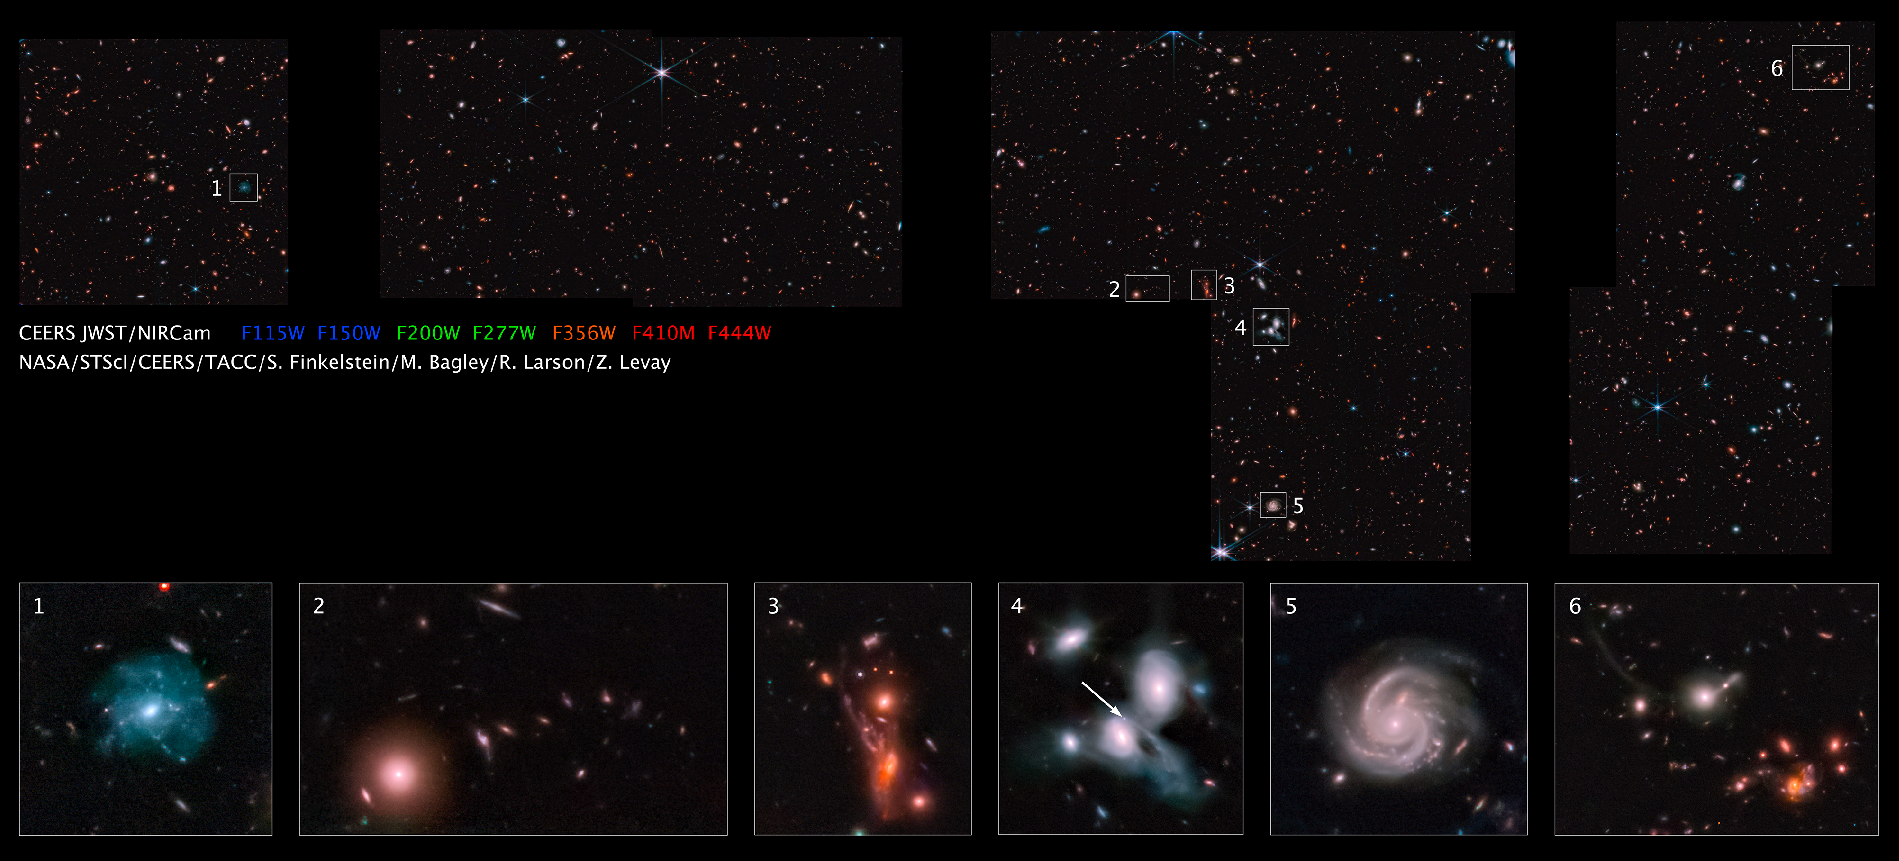
Many different teams of scientists are using NASA’s latest space telescope, JWST, to image galaxies so far away that they are back at the earliest time galaxies appear in the Universe. Because these galaxies are quite a bit more distant than any we’ve classified before in Galaxy Zoo, we want to make sure we know how to ask the right questions about the shapes and types of galaxies present, and also make sure we get the image processing as good as possible before asking for your help classifying lots of them.
To get Galaxy Zoo started on classifying (we hope eventually) all of the distant galaxies in JWST imaging, we are running a pilot with just 8000 galaxy images from the Cosmic Evolution Early Research Science (CEERS) survey.

CEERS is using JWST to take extremely deep images of 100 sq. arcmin of the sky (which is about 1/8th the size of the Full Moon!). It is making use of JWST instruments called NIRCam, MIRI, and NIRSpec to obtain both images and spectra in this patch of sky. CEERS’ main goal is to demonstrate, test, and validate efficient extragalactic surveys with coordinated, overlapping parallel observations in a patch of sky which already has a lot of other multi-wavelength data (e.g. from the Hubble Space Telescope).
Even though the pilot sample is being put into Galaxy Zoo mainly as a test survey for future projects, we still expect that your classifications of these images will help us find out a lot about the type and number of galaxies at very high redshifts (z~9-13), look for early star formation, black hole growth and the assembly of bulges and discs in galaxies at z>3, and look for dust observed star formation and black hole growth at z~1-3. We also plan to see how well machine classifiers like Zoobot do at classifying these galaxies, so we can get them to help with the classification of future, larger collections of JWST galaxies.
These images are from the first CEERS public data release. We have coordinated with the CEERS team to make sure the images you see are optimized to bring out as much detail as possible, and that the questions we are asking will enable the best possible science. We hope you’ll enjoy seeing some of the most distant galaxies ever observed in the project. And, as always, thanks for all your hard work classifying. We appreciate every click you provide.
Galaxy Zoo + Galaxy Zoo: 3D
Hi! I’m Tom, and I’m a PhD student at the University of Nottingham, doing some research to try to understand how spiral galaxies have grown and changed over their lifetimes. I’m especially interested in looking at how the spiral arms have been affecting the galaxy as a whole. I’ve recently finished up a paper in MNRAS in which I’ve been demonstrating a couple of new methods using some Galaxy Zoo data.
Amelia has already written [ https://blog.galaxyzoo.org/2018/07/17/finding-bars-in-galaxy-zoo-3d/ ] about how she is using the MaNGA survey [ https://www.sdss.org/surveys/manga/ ] to try to understand what’s happening in bars, so I won’t go into too much detail about this fantastic survey. I’ll just say that it’s part of the Sloan Digital Sky Survey, and for each of its sample of 10,000 galaxies, we have measurements of the spectrum at every position across the face of the galaxy.
MaNGA is really useful for trying to understand how galaxies have grown to their current size, because it is possible to get some sort of estimation of what kinds of stars are present in different locations of the galaxy. It’s a difficult thing to measure, so we can’t say exactly how many of every different type of star is present, but we can at least get a broad picture of the kinds of stellar ages and chemical enrichment (“metallicity”) in the stars. Astronomers have used these kinds of tools to measure the average age or metallicity of stars in different parts of galaxies, and found that in most spirals, the further out you go in the galaxy, the younger the stars are on average. The usual interpretation of this is that bulges tend to have formed first, and the disks have grown in size over time afterwards.

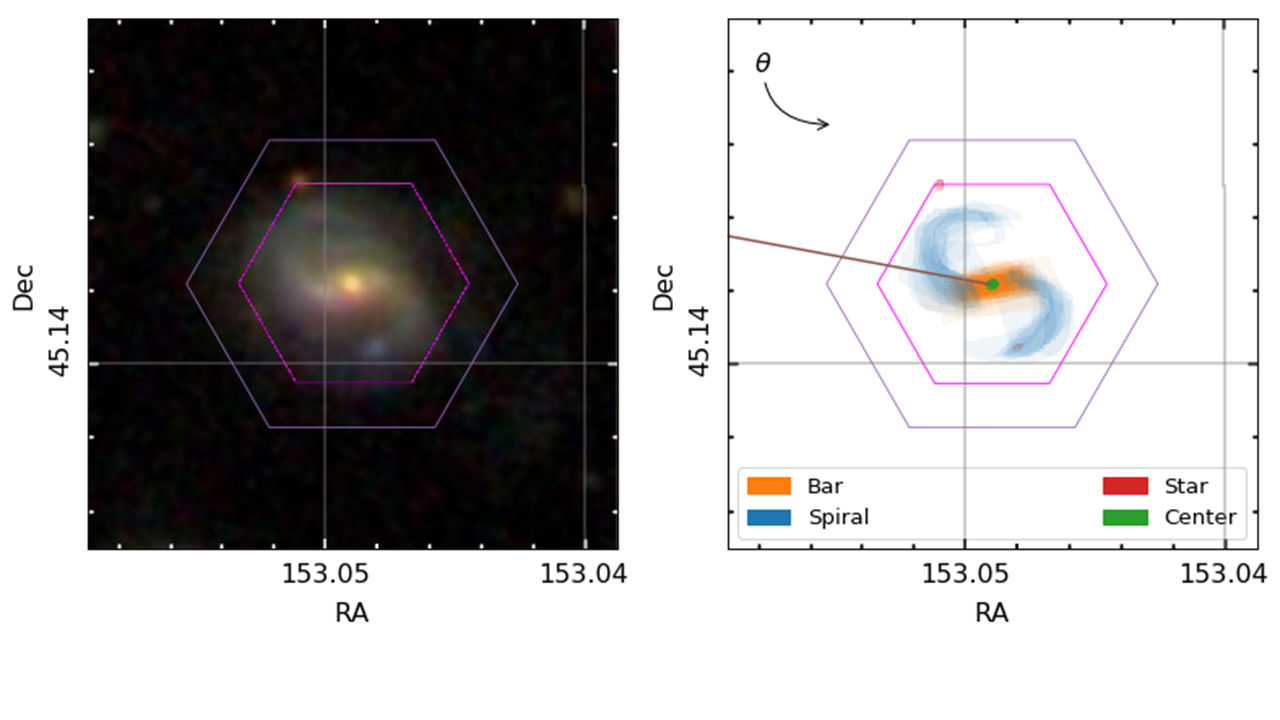
A MaNGA spiral galaxy. We can obtain information about the kinds of stars residing across the hexagonal area, which helps us understand how they’ve grown and evolved.
I’m really interested in trying to push this picture in two ways. Firstly, I’ve been trying to see what we can learn from looking at the general distribution of stars of different ages and metallicities – not just the average properties – at each location in the galaxy. Secondly, I think there is a lot of information that we risk ignoring by only looking at how things change with galactic radius. Spiral arms and the bar aren’t evenly distributed around the galaxy, so if we can see how the stellar properties change as we move around the galaxy, we should be able to measure what effect the spiral arms and bars have on the stars. The goal would be to try to confirm whether the most popular models of the nature of spiral arms and bars are correct or not.
To properly do this, we need to know exactly where the spiral arms and bars are in the MaNGA galaxies, so that we can see how the stars vary in these different regions. Enter Galaxy Zoo: 3D, where volunteers are asked to tell us where the different components are.
An example galaxy in MaNGA, where we’ve managed to split the galaxy into different stellar populations of different ages. Each frame shows where we find stars of a given age in this galaxy, starting from the oldest stars and finishing with the most recently formed stars. The colour denotes the mean metallicity of the stars, shown by the scale at the bottom.
All of this is what my most recent publication is about (read it in full at https://doi.org/10.1093/mnras/stz2204); we’ve shown that by combining the full spatial information available from MaNGA (augmented by Galaxy Zoo:3D) with the full distributions of the ages and metallicities of stars in each location, we can start to see some interesting things in the bar and spiral arms. It’s definitely best illustrated by an animation.
By splitting the age distributions up into different “time-slices”, we can create images of where stars of different ages are located in each of our MaNGA galaxies. Immediately from this one example, it’s obvious that there’s a lot of things going on here.
There are a few features in the animation that we’re not entirely convinced are real, but the main exciting things are that the spiral arms only show up in the youngest stars, and the bar grows and rotates as we move from older to younger stars. The growth of the bar is intriguing; this might be showing us how it formed. The bar changing with angle is even more exciting, and we think it shows us how quickly new-born stars become mixed and “locked” into the bar. The arms show what we should expect; spiral arms are areas of intense star formation, but over time the stars formed there will become mixed around the disk. We measured this effect by looking at what fraction of stars of each age are located in the volunteer-drawn spiral arms from Galaxy Zoo:3D.
This is really interesting, and highlights the power of combining large surveys like MaNGA with crowd-sourced information from the Zooniverse.
The next step is to do these kinds of things with more than just this one galaxy though. I’ve started looking at how these techniques can measure how fast the disks of spiral galaxies grew, using a large sample of spiral galaxies identified by Galaxy Zoo 2 volunteers. I’m also trying to measure how quickly stars get mixed away from spiral arms in different types of spiral galaxies. I have started to find some hints of some exciting results on both of these topics, which I would love to share in a future blog post if you’re interested.
We need volunteers to tell us where the spiral arms and bars are in galaxies, so that we can start to see what makes these regions special.
However, I’m currently limited in the number of galaxies with spiral arm regions identified by Galaxy Zoo:3D volunteers, so it would be really helpful if we could get some more! Understanding what makes spiral structure appear in disky galaxies is one of the unsolved problems in galaxy evolution and formation, and the clues to finding out might well lie in measuring how spiral arms affect the galaxy’s stars. Galaxy Zoo:3D will definitely be able to play a role in this! Help us out at https://www.zooniverse.org/projects/klmasters/galaxy-zoo-3d.
Galaxy Zoo Mobile
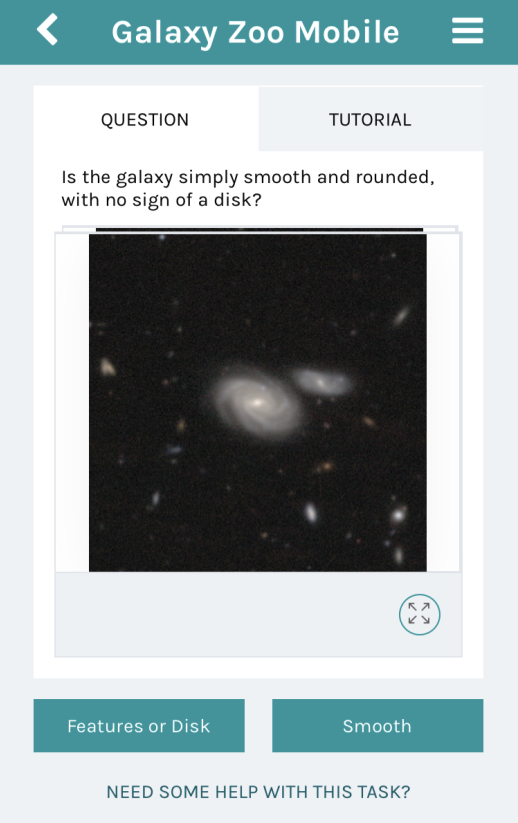
Hi, I’m Lauren, a summer work experience student working with the Galaxy Zoo team at the University of Oxford for a couple of weeks, and it’s my pleasure to be able to bring you some fantastic news. Today, we’re launching the mobile version of Galaxy Zoo! Unlike the website version, this brand-new native mobile version has questions with only two possible answers – just swipe left or right depending on your answer! This can create a more captivating and faster-paced experience when you are classifying galaxies.
Not only does this introduce a new and engaging platform for the project, but it also means that you can classify galaxies anywhere – on the bus, at the beach, at a concert, in the waiting room at the dentist etc. Hopefully, this will mean many more galaxy classifications whilst also providing easier access for our wide range of volunteers across the world. By introducing this app, we hope to inspire others to join our Galaxy Zoo team, no matter their qualifications or skill set.
Get involved by downloading the Zooniverse app (if you don’t have it already), heading over to ‘Space’ section, and selecting the ‘Galaxy Zoo Mobile’ project. From there, you will be greeted with three different workflows – ‘Smooth or Featured’, ‘Spiral Arms’ or ‘Merging/Disturbed’. Pick whichever you like! The simple, swiping interface allows you to classify galaxies much faster than ever before, meaning the Galaxy Zoo science team can produce results even quicker. So, download the Zooniverse app today and start classifying!
Apple App Store: https://apps.apple.com/us/app/zooniverse/id1194130243
Google Play Store: https://play.google.com/store/apps/details?id=com.zooniversemobile&hl=en
Happy classifying,
Lauren & the Galaxy Zoo Team
Machine Learning Messaging Experiment
Alongside the new workflow that Galaxy Zoo has just launched (read more in this blog post: https://wp.me/p2mbJY-2tJ), we’re taking the opportunity to work once again with researchers from Ben Gurion University and Microsoft Research to run an experiment which looks at how we can communicate with volunteers. As part of this experiment volunteers classifying galaxies on the new workflow may see short messages about the new machine learning elements. Anyone seeing these messages will be given the option to withdraw from the experiment’; just select the ‘opt out’ button to avoid seeing any further messages.
After the experiment is finished we will publish a debrief blog here describing more of the details and presenting our results.
This messaging experiment has ethics approval from Ben Gurion University (reference: SISE-2019-01) and the University of Oxford (reference: R63818/RE001).
Galaxy Zoo Upgrade: Better Galaxies, Better Science
Since I joined the team in 2018, citizen scientists like you have given us over 2 million classifications for 50,000 galaxies. We rely on these classifications for our research: from spiral arm winding, to merging galaxies, to star formation – and that’s just in the last month!
We want to get as much science as possible out of every single click. Your time is valuable and we have an almost unlimited pile of galaxies to classify. To do this, we’ve spent the past year designing a system to prioritise which galaxies you see on the site – which you can choose to access via the ‘Enhanced’ workflow.
This workflow depends on a new automated galaxy classifier using machine learning – an AI, if you like. Our AI is good at classifying boring, easy galaxies very fast. You are a much better classifier, able to make sense of the most difficult galaxies and even make new discoveries like Voorwerpen, but unfortunately need to eat and sleep and so on. Our idea is to have you and the AI work together.
The AI can guess which challenging galaxies, if classified by you, would best help it to learn. Each morning, we upload around 100 of these extra-helpful galaxies. The next day, we collect the classifications and use them to teach our AI. Thanks to your classifications, our AI should improve over time. We also upload thousands of random galaxies and show each to 3 humans, to check our AI is working and to keep an eye out for anything exciting.
With this approach, we combine human skill with AI speed to classify far more galaxies and do better science. For each new survey:
- 40 humans classify the most challenging and helpful galaxies
- Each galaxy is seen by 3 humans
- The AI learns to predict well on all the simple galaxies not yet classified
What does this mean in practice? Those choosing the ‘Enhanced’ workflow will see somewhat fewer simple galaxies (like the ones on the right), and somewhat more galaxies which are diverse, interesting and unusual (like the ones on the left). You will still see both interesting and simple galaxies, and still see every galaxy if you make enough classifications.
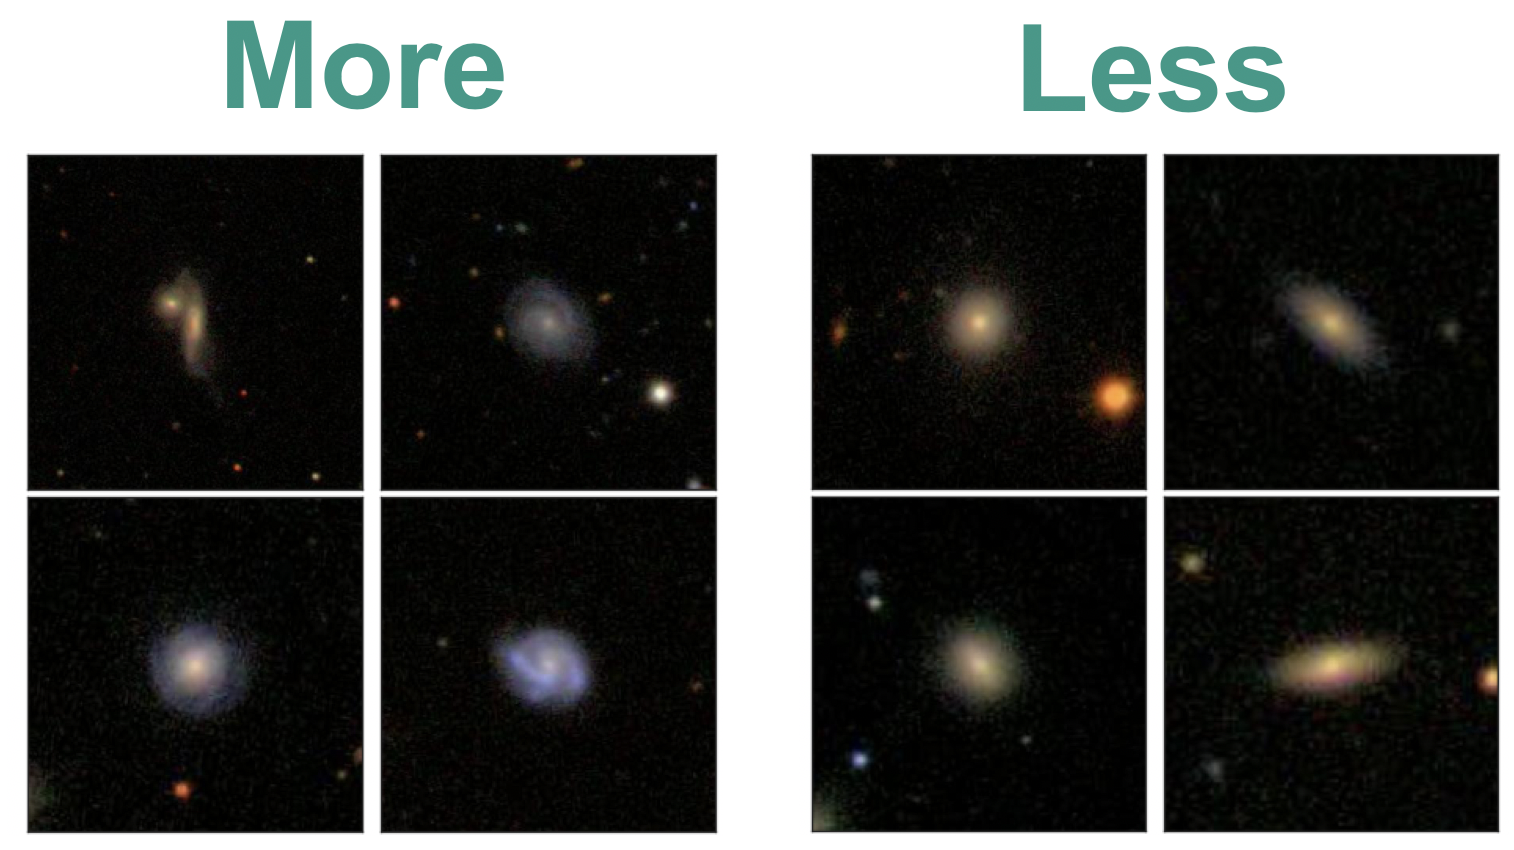
With our new system, you’ll see somewhat more galaxies like the ones on the left, and somewhat fewer like the ones on the right.
We would love for you to join in with our upgrade, because it helps us do more science. But if you like Galaxy Zoo just the way it is, no problem – we’ve made a copy (the ‘Classic’ workflow) that still shows random galaxies, just as we always have. If you’d like to know more, check out this post for more detail or read our paper. Separately, we’re also experimenting with sending short messages – check out this post to learn more.
Myself and the Galaxy Zoo team are really excited to see what you’ll discover. Let’s get started.
Scaling Galaxy Zoo with Bayesian Neural Networks
This is a technical overview of our recent paper (Walmsley 2019) aimed at astronomers. If you’d like an introduction to how machine learning improves Galaxy Zoo, check out this blog.
I’d love to be able to take every galaxy and say something about it’s morphology. The more galaxies we label, the more specific questions we can answer. When you want to know what fraction of low-mass barred spiral galaxies host AGN, suddenly it really matters that you have a lot of labelled galaxies to divide up.
But there’s a problem: humans don’t scale. Surveys keep getting bigger, but we will always have the same number of volunteers (applying order-of-magnitude astronomer math).
We’re struggling to keep pace now. When EUCLID (2022), LSST (2023) and WFIRST (2025ish) come online, we’ll start to look silly.

To keep up, Galaxy Zoo needs an automatic classifier. Other researchers have used responses that we’ve already collected from volunteers to train classifiers. The best performing of these are convolutional neural networks (CNNs) – a type of deep learning model tailored for image recognition. But CNNs have a drawback. They don’t easily handle uncertainty.
When learning, they implicitly assume that all labels are equally confident – which is definitely not the case for Galaxy Zoo (more in the section below). And when making (regression) predictions, they only give a ‘best guess’ answer with no error bars.
In our paper, we use Bayesian CNNs for morphology classification. Our Bayesian CNNs provide two key improvements:
- They account for varying uncertainty when learning from volunteer responses
- They predict full posteriors over the morphology of each galaxy
Using our Bayesian CNN, we can learn from noisy labels and make reliable predictions (with error bars) for hundreds of millions of galaxies.
How Bayesian Convolutional Neural Networks Work
There’s two key steps to creating Bayesian CNNs.
1. Predict the parameters of a probability distribution, not the label itself
Training neural networks is much like any other fitting problem: you tweak the model to match the observations. If all the labels are equally uncertain, you can just minimise the difference between your predictions and the observed values. But for Galaxy Zoo, many labels are more confident than others. If I observe that, for some galaxy, 30% of volunteers say “barred”, my confidence in that 30% massively depends on how many people replied – was it 4 or 40?
Instead, we predict the probability that a typical volunteer will say “Bar”, and minimise how surprised we should be given the total number of volunteers who replied. This way, our model understands that errors on galaxies where many volunteers replied are worse than errors on galaxies where few volunteers replied – letting it learn from every galaxy.
2. Use Dropout to Pretend to Train Many Networks
Our model now makes probabilistic predictions. But what if we had trained a different model? It would make slightly different probabilistic predictions. We need to marginalise over the possible models we might have trained. To do this, we use dropout. Dropout turns off many random neurons in our model, permuting our network into a new one each time we make predictions.
Below, you can see our Bayesian CNN in action. Each row is a galaxy (shown to the left). In the central column, our CNN makes a single probabilistic prediction (the probability that a typical volunteer would say “Bar”). We can interpret that as a posterior for the probability that k of N volunteers would say “Bar” – shown in black. On the right, we marginalise over many CNN using dropout. Each CNN posterior (grey) is different, but we can marginalise over them to get the posterior over many CNN (green) – our Bayesian prediction.

Read more about it in the paper.
Active Learning
Modern surveys will image hundreds of millions of galaxies – more than we can show to volunteers. Given that, which galaxies should we classify with volunteers, and which by our Bayesian CNN?
Ideally we would only show volunteers the images that the model would find most informative. The model should be able to ask – hey, these galaxies would be really helpful to learn from– can you label them for me please? Then the humans would label them and the model would retrain. This is active learning.
In our experiments, applying active learning reduces the number of galaxies needed to reach a given performance level by up to 35-60% (See the paper).
We can use our posteriors to work out which galaxies are most informative. Remember that we use dropout to approximate training many models (see above). We show in the paper that informative galaxies are galaxies where those models confidently disagree.
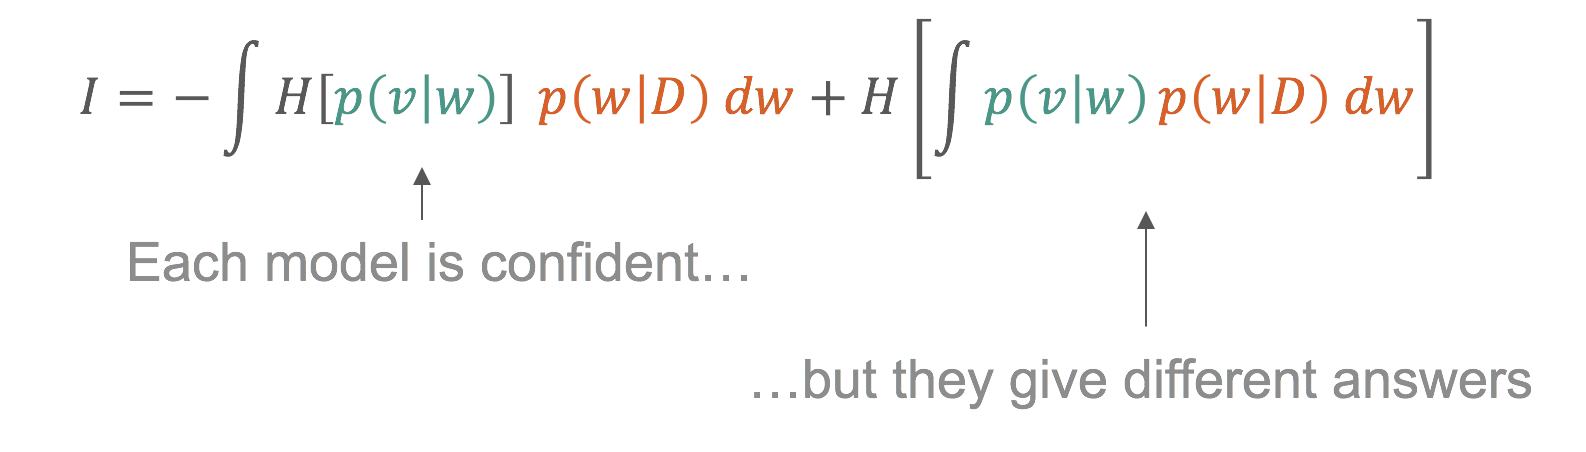
This is only possible because we think about labels probabilistically and approximate training many models.
What galaxies are informative? Exactly the galaxies you would intuitively expect.
- The model strongly prefers diverse featured galaxies over ellipticals
- For identifying bars, the model prefers galaxies which are better resolved (lower redshift)
This selection is completely automatic. Indeed, I didn’t realise the lower redshift preference until I looked at the images!
I’m excited to see what science can be done as we move from morphology catalogs of hundreds of thousands of galaxies to hundreds of millions. If you’d like to know more or you have any questions, get in touch in the comments or on Twitter (@mike_w_ai, @chrislintott, @yaringal).
Cheers,
Mike
Galaxy Zoo’s 10th Anniversary

Galaxy Zoo is celebrating ten years since launch next month, and as part of the festivities the science team are having a meeting in Oxford from 10th-12th July. Unfortunately we didn’t think it was feasible to invite the hundreds of thousands of you from all over the world who have contributed to the project over the last ten years, but the good news is that all of the talks from the meeting will be interactively live-streamed so that anyone can join in the discussion! See the schedule above for details on who is speaking at the meeting. Details of how to join the live stream will be released closer to the event.
There will also be an Oxford SciBar public event on the Monday night. All who are able to make it are welcome to join but don’t worry if you can’t, there will be a full podcast of the evening released shortly after the event!
