
Bars appear to fuel supermassive black holes
Hi all! We recently had a paper accepted that used Galaxy Zoo data to identify whether accreting supermassive black holes (known as AGN) are more often found in strongly barred galaxies.
Thanks to the copious amount of data in GZ DESI, we were able to show to a very significant level that strongly barred galaxies are more likely to host AGN than weakly barred galaxies, which are in turn more likely than unbarred. We did this by using a sample of disk-dominated galaxies, determining whether or not they had an AGN (and removing any galaxies where we weren’t certain), and then looking at the AGN fraction in strongly barred, weakly barred and unbarred galaxies. By separating the barred galaxies by strength, and by having a greater sample of galaxies to work with, we were able to tease out our result.
You can check out the paper at https://arxiv.org/abs/2406.20096.

Examples of galaxy morphologies and activities: The left column has unbarred galaxies, the middle has weakly barred, and the right has strongly barred galaxies. The top row shows AGN-host galaxies, the middle row shows star-forming galaxies, and the bottom row shows undetermined galaxies, mostly red spirals.
If you want to continue reading about bars, be sure to check out the Tobias’ recent post!
Zoo Gems – Hubble does Galaxy Zoo(s)
Since mid-2018, the Hubble Space Telescope has taken occasional short-exposure images, filling what would otherwise be gaps in its schedule, of galaxies in the list from “Gems of the Galaxy Zoos” (otherwise known as Zoo Gems). The Zoo Gems project just passed a milestone, with acceptance of a journal paper describing the project, including how votes from Galaxy Zoo and Radio Galaxy Zoo participants were used to select some of the targeted galaxies, and acting as a sort of theatrical “teaser trailer” for the variety of science results coming from these data. (The preprint of the accepted version is here; once it is in “print”, the Astronomical Journal itself is now open-access as of last month). The journal reviewer really liked the whole project: “The use of the Galaxy Zoo project’s unique ability to spot outliers in galaxy morphology and use this input list for a HST gap filler program is a great use of both the citizen science project and the Hubble Space Telescope” and “I think it is a wonderful program with a clever, useful, and engaging use of both SDSS and Hubble.” (We seldom read statements that glowing in journal reviews).
Zoo Gems got its start in late 2017, when the Space Telescope Science Institute (STScI) asked for potential “gap-filler” projects. Even with what are known as snapshot projects, there remained gaps in Hubble’s schedule long enough to set up and take 10-15 minutes’ worth of high-quality data. We put together a shockingly brief proposal (STScI wanted 2 pages, originally to gauge interest) and were very pleased to find it one of 3 selected (the other two also deal with galaxies. Makes sense to me). We had long thought that the ideal proposal for further observations of some of the rare objects identified in Galaxy Zoo ran along the lines of “Our volunteers have found all these weird galaxies. We need a closer look”. That was essentially what the gap-filler project offered.
We estimated that we could identify 1100 particularly interesting galaxies (where short-exposure Hubble images would teach us something we could foresee) from Galaxy Zoo and Radio Galaxy Zoo. We were allocated 300 by STScI, so some decisions had to be made. A key feature of our project was the wide range of galaxy science goals it could address, so we wanted to keep a broad mix of object types. Some types were rare and had fewer than 10 examples even from Galaxy Zoo, so we started by keeping those. When there were many to choose from, we did what Galaxy Zoo history (and STScI reviewers) suggested – asked for people to vote on which merging galaxies, overlapping galaxies, and so on should go into the final list. This happened in parallel for Galaxy Zoo and Radio Galaxy Zoo objects (the latter largely managed by the late Jean Tate, not the last time we are sadly missing Jean’s contributions as one of the most assiduous volunteers). Even being on that observing list was no guarantee – gap-filler observations are selected more or less at random, taking whichever one (from whichever project’s list) fits in a gap in time and location in the sky. The STScI pilot project suggested that we could eventually expect close to half to be observed; we are now quite close to that, with 146 observations of 299 (one became unworkable due to a change in how guide stars are selected by Hubble). These include a fascinating range of galaxies. From Galaxy Zoo, the list includes Green Pea starburst galaxies, blue elliptical and red spiral galaxies, ongoing mergers, backlit spiral galaxies, galaxies with unusual central bars or rings, galaxy mergers with evidence for the spiral disks surviving the merger or reappearing shortly thereafter, and even a few gravitational lenses. From Radio Galaxy Zoo, we selected sets of emission-line galaxies (“RGZ Green”) and possibly spiral host galaxies of double radio sources (SDRAGNs, in the jargon, and so rare that we’ve more than doubled the known set already). Both kinds of RGZ selection were largely managed by Jean Tate, who we are missing once again. By now, of 300 possible objects, 146 have been successfully observed. One can no longer be observed due to changes in Hubble’s guide-star requirements, and two failed for onboard technical reasons (it was during one of those, a few months ago, that a computer failure sent the telescope into “safe mode”; I have been assured that it was not our fault).

Zoo Gems images show that every blue elliptical galaxy observed shows a tightly wound spiral pattern near the core, so small that it was blurred together in the Sloan Survey images used by Galaxy Zoo, and broadly fitting with the idea that these galaxies result from at least minor mergers bringing gas and dust into a formerly quiet elliptical system.
There is much more to come as harvesting the knowledge from these data continues. Already, a project led by Leonardo Clarke at the University of Minnesota used Zoo Gems images to demonstrate that Green Peas are embedded in redder surroundings, possibly the older stars in the galaxies that host these starbursts. Beyond these, these data can be used to examine the histories of poststarburst galaxies, dynamics and star-formation properties of 3-armed spirals, and nuclear disks and bars – some of these show galaxies-within-galaxies patterns where the central region nearly echoes the structure of the whole galaxy.
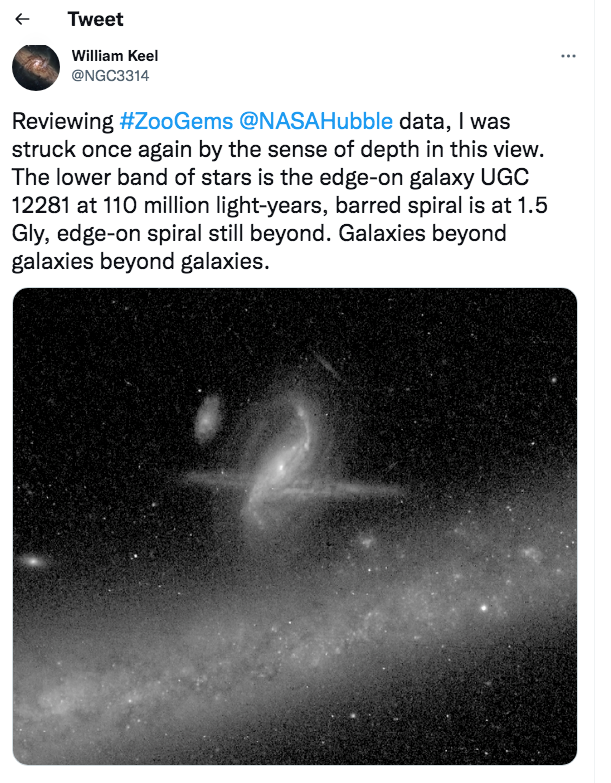
While going through some of the Zoo Gems images to see which should go in various montages in this paper, I considered the multilayer overlapping galaxy system including UGC 12281. It didn’t go into the paper, but the visual sense of deep space in this image is so profound that it became the 2nd most-retweeted thing I’ve sent out in more than 10 years.
In presenting these data, we wanted to make the case for the value of wide-ranging, even short, programs such as this. These gap-filler projects are continuing with Hubble, until STScI starts to have trouble filling the gaps and needs to call for more projects. Premature as it seems, I can’t help musing that someone may eventually work out a low-impact way for the James Webb Space Telescope to make brief stopovers as it slews between long-exposure targets – we have suggestions…
Data from the Zoo Gems project (like the other gap-filler programs, Julianne Dalcanton’s program on Arp peculiar galaxies and the one on SWIFT active galaxies led by Aaron Barth) are immediately public, accessible in the MAST archive under HST program number 15445 (the others are 15444 and 15446). Claude Cornen maintains image galleries for the Zoo Gems, Arp and SWIFT projects in Zoo Gems Talk. Our thanks go to everyone who helped draw attention to these galaxies, or voted in the Zoo Gems object selection.
Galaxy Zoo + Galaxy Zoo: 3D
Hi! I’m Tom, and I’m a PhD student at the University of Nottingham, doing some research to try to understand how spiral galaxies have grown and changed over their lifetimes. I’m especially interested in looking at how the spiral arms have been affecting the galaxy as a whole. I’ve recently finished up a paper in MNRAS in which I’ve been demonstrating a couple of new methods using some Galaxy Zoo data.
Amelia has already written [ https://blog.galaxyzoo.org/2018/07/17/finding-bars-in-galaxy-zoo-3d/ ] about how she is using the MaNGA survey [ https://www.sdss.org/surveys/manga/ ] to try to understand what’s happening in bars, so I won’t go into too much detail about this fantastic survey. I’ll just say that it’s part of the Sloan Digital Sky Survey, and for each of its sample of 10,000 galaxies, we have measurements of the spectrum at every position across the face of the galaxy.
MaNGA is really useful for trying to understand how galaxies have grown to their current size, because it is possible to get some sort of estimation of what kinds of stars are present in different locations of the galaxy. It’s a difficult thing to measure, so we can’t say exactly how many of every different type of star is present, but we can at least get a broad picture of the kinds of stellar ages and chemical enrichment (“metallicity”) in the stars. Astronomers have used these kinds of tools to measure the average age or metallicity of stars in different parts of galaxies, and found that in most spirals, the further out you go in the galaxy, the younger the stars are on average. The usual interpretation of this is that bulges tend to have formed first, and the disks have grown in size over time afterwards.

A MaNGA spiral galaxy. We can obtain information about the kinds of stars residing across the hexagonal area, which helps us understand how they’ve grown and evolved.
I’m really interested in trying to push this picture in two ways. Firstly, I’ve been trying to see what we can learn from looking at the general distribution of stars of different ages and metallicities – not just the average properties – at each location in the galaxy. Secondly, I think there is a lot of information that we risk ignoring by only looking at how things change with galactic radius. Spiral arms and the bar aren’t evenly distributed around the galaxy, so if we can see how the stellar properties change as we move around the galaxy, we should be able to measure what effect the spiral arms and bars have on the stars. The goal would be to try to confirm whether the most popular models of the nature of spiral arms and bars are correct or not.
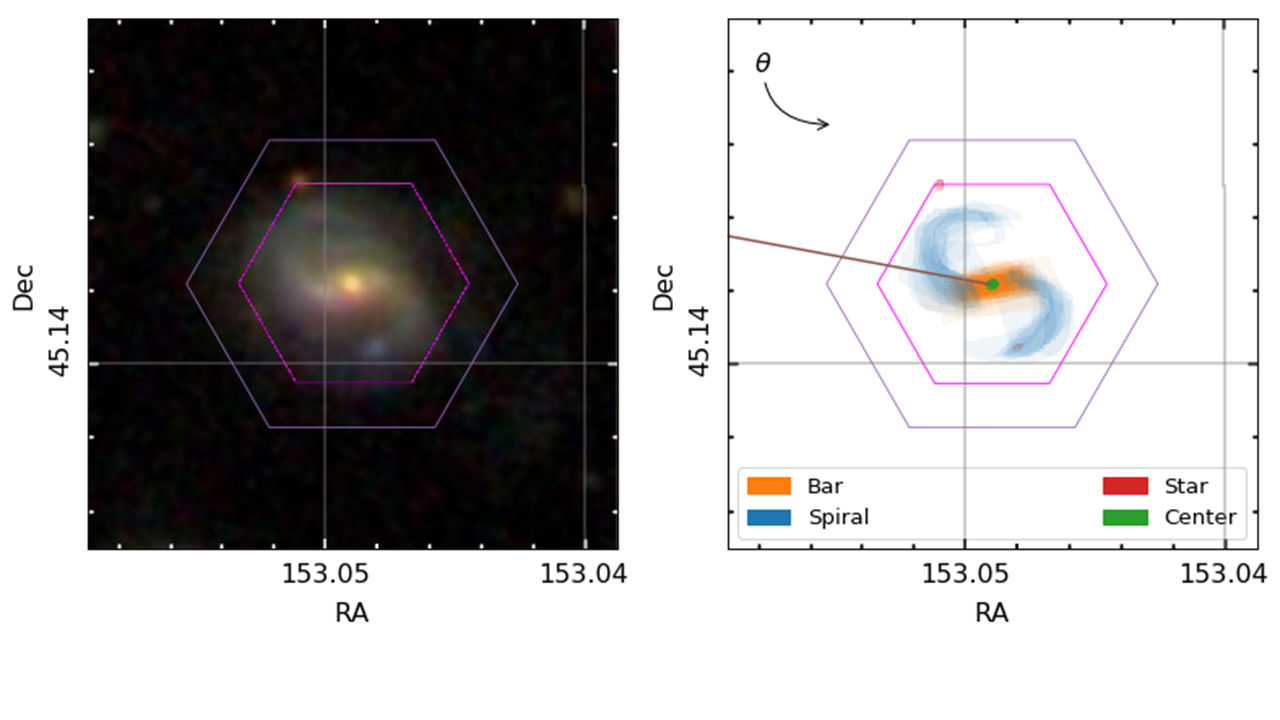
To properly do this, we need to know exactly where the spiral arms and bars are in the MaNGA galaxies, so that we can see how the stars vary in these different regions. Enter Galaxy Zoo: 3D, where volunteers are asked to tell us where the different components are.
An example galaxy in MaNGA, where we’ve managed to split the galaxy into different stellar populations of different ages. Each frame shows where we find stars of a given age in this galaxy, starting from the oldest stars and finishing with the most recently formed stars. The colour denotes the mean metallicity of the stars, shown by the scale at the bottom.
All of this is what my most recent publication is about (read it in full at https://doi.org/10.1093/mnras/stz2204); we’ve shown that by combining the full spatial information available from MaNGA (augmented by Galaxy Zoo:3D) with the full distributions of the ages and metallicities of stars in each location, we can start to see some interesting things in the bar and spiral arms. It’s definitely best illustrated by an animation.
By splitting the age distributions up into different “time-slices”, we can create images of where stars of different ages are located in each of our MaNGA galaxies. Immediately from this one example, it’s obvious that there’s a lot of things going on here.
There are a few features in the animation that we’re not entirely convinced are real, but the main exciting things are that the spiral arms only show up in the youngest stars, and the bar grows and rotates as we move from older to younger stars. The growth of the bar is intriguing; this might be showing us how it formed. The bar changing with angle is even more exciting, and we think it shows us how quickly new-born stars become mixed and “locked” into the bar. The arms show what we should expect; spiral arms are areas of intense star formation, but over time the stars formed there will become mixed around the disk. We measured this effect by looking at what fraction of stars of each age are located in the volunteer-drawn spiral arms from Galaxy Zoo:3D.
This is really interesting, and highlights the power of combining large surveys like MaNGA with crowd-sourced information from the Zooniverse.
The next step is to do these kinds of things with more than just this one galaxy though. I’ve started looking at how these techniques can measure how fast the disks of spiral galaxies grew, using a large sample of spiral galaxies identified by Galaxy Zoo 2 volunteers. I’m also trying to measure how quickly stars get mixed away from spiral arms in different types of spiral galaxies. I have started to find some hints of some exciting results on both of these topics, which I would love to share in a future blog post if you’re interested.
We need volunteers to tell us where the spiral arms and bars are in galaxies, so that we can start to see what makes these regions special.
However, I’m currently limited in the number of galaxies with spiral arm regions identified by Galaxy Zoo:3D volunteers, so it would be really helpful if we could get some more! Understanding what makes spiral structure appear in disky galaxies is one of the unsolved problems in galaxy evolution and formation, and the clues to finding out might well lie in measuring how spiral arms affect the galaxy’s stars. Galaxy Zoo:3D will definitely be able to play a role in this! Help us out at https://www.zooniverse.org/projects/klmasters/galaxy-zoo-3d.
Winding Problems
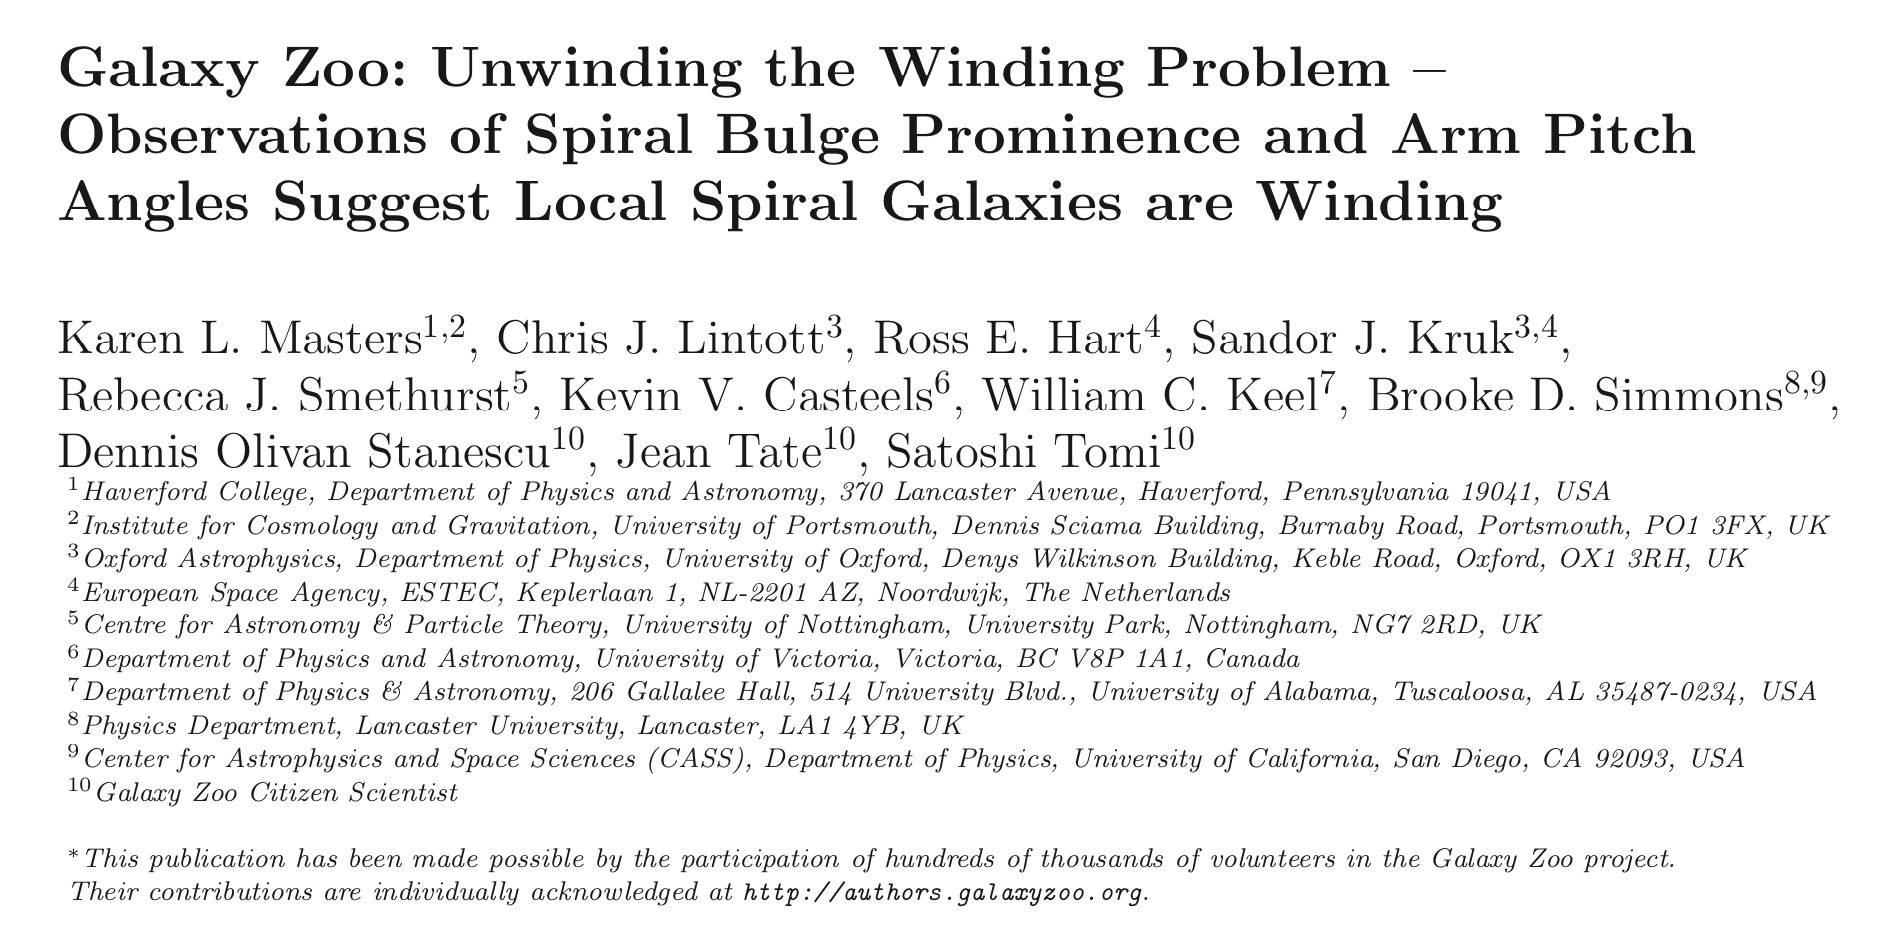
I’m delighted to announce the acceptance of another paper based on your classifications at Galaxy Zoo, “Galaxy Zoo: Unwinding the Winding Problem – Observations of Spiral Bulge Prominence and Arm Pitch Angles Suggest Local Spiral Galaxies are Winding”, which has just been released on the arxiv pre-print server, and appear in the Monthly Notices of the Royal Astronomical Society (MNRAS) soon.
Here’s the title and author page.
This paper has been a long time coming, and is based significantly on the excellent thesis work of Ross Hart (PhD from Nottingham University). Ross wrote about some of his work for the blog previously “How Do Spiral Arms Affect Star Formation“. One of the things Ross’s PhD work showed was just how good your identification of spiral arm winding is, and that allowed us to be confident to use it in this paper.
You might notice the appearance of some of your fellow citizen scientists in this author list. Dennis, Jean and Satoshi provided help via the “Galaxy Zoo Literature Search” call which ended up contributing significantly to the paper.
Our main result is that we do not find any significant correlation between how large the bulges are and how tightly wound the spirals are in Galaxy Zoo spiral galaxies…. this non-detection was a big surprise, because this correlation is discussed in basically all astronomy text books – it forms the basis of the spiral sequence described by Hubble.
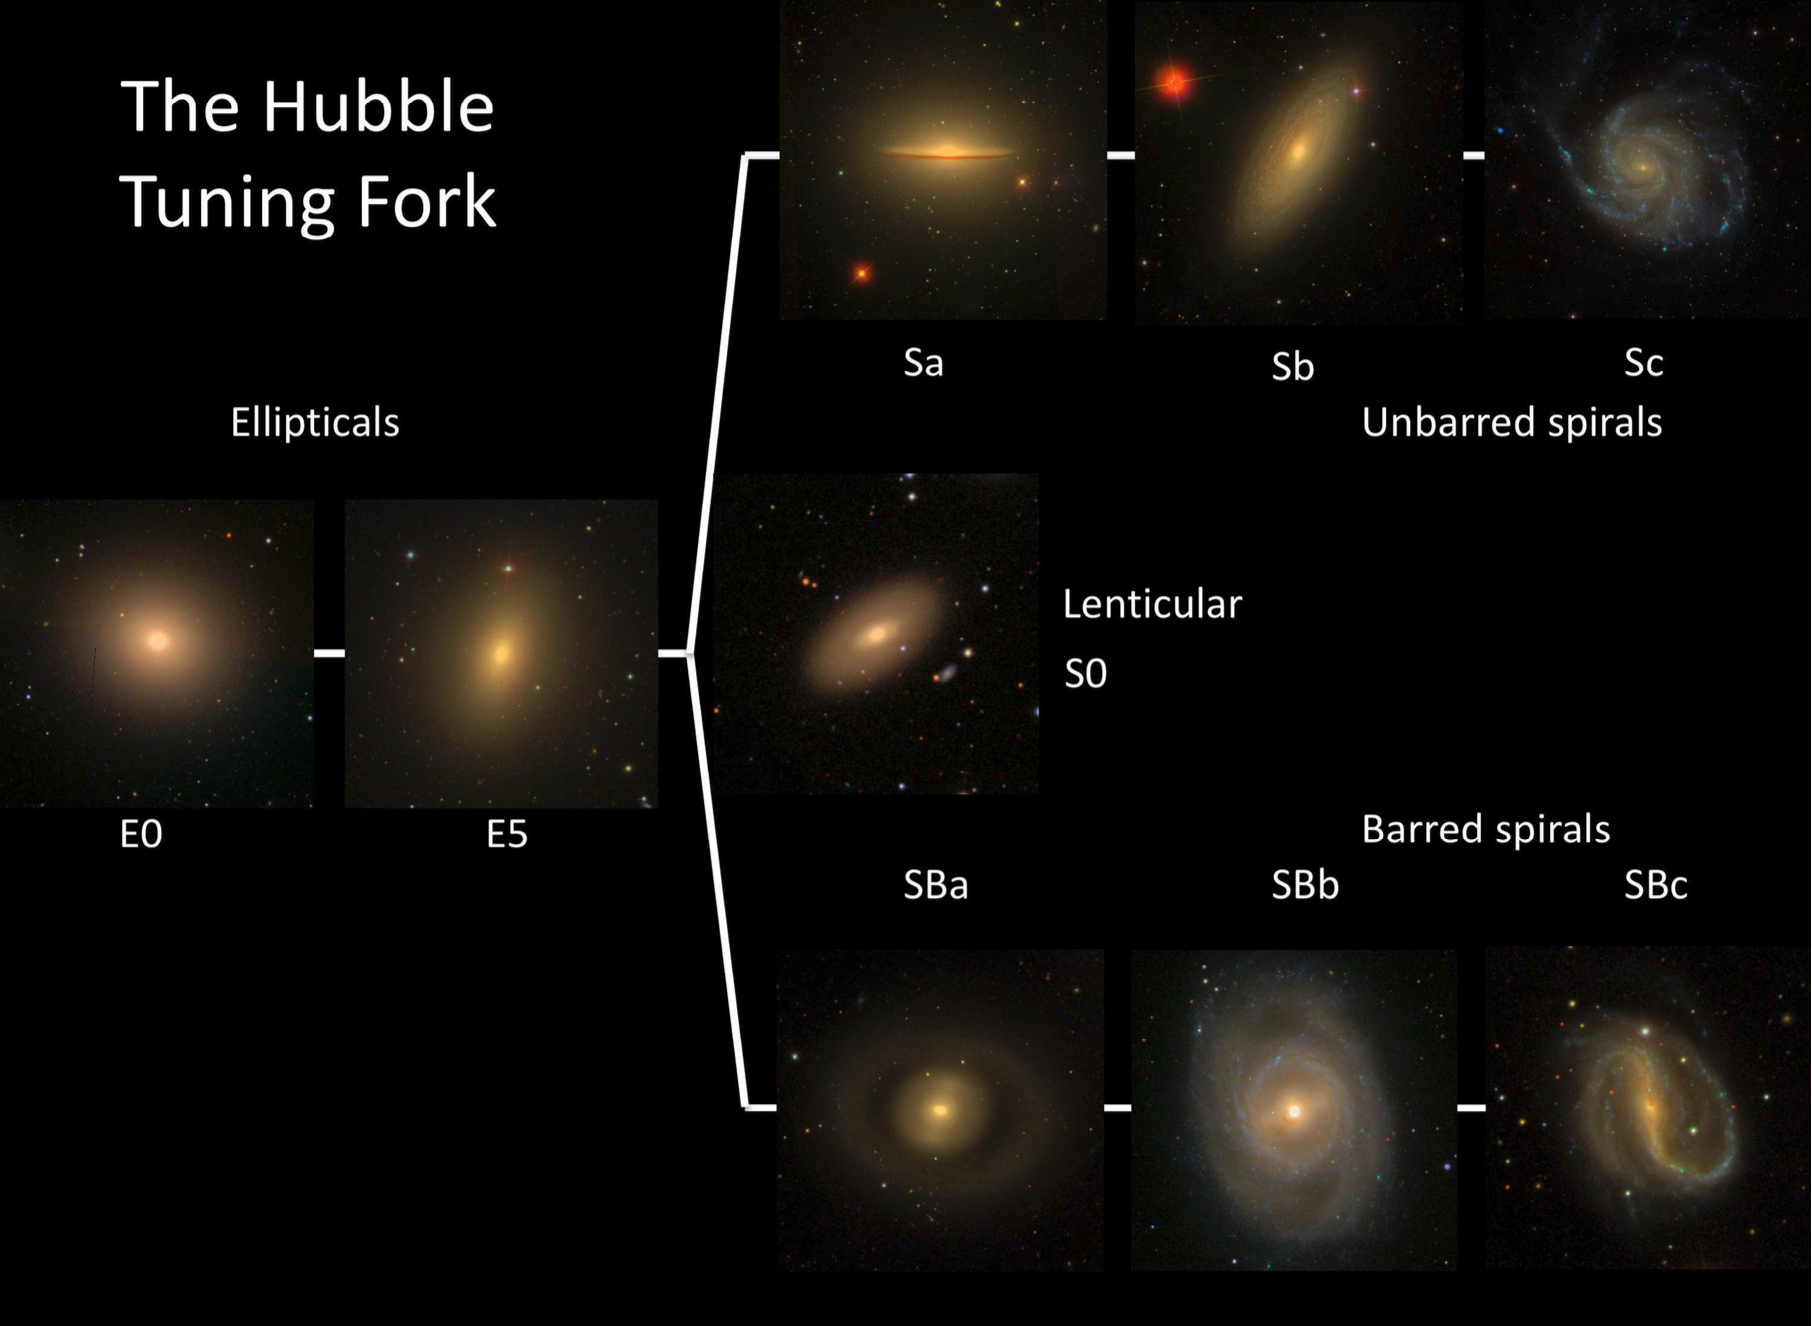
The Hubble Tuning Fork illustrated with SDSS images of nearby galaxies.
Way back in 1927 Hubble wrote (about the spiral nebula he had observed) that: “three [properties] determine positions in the sequence: (1) the relative size of the unresolved nuclear region, (2) the extent to which the arms are unwound (the openness or angle of the spiral), (3) the degree of condensation in the arms.” He goes on to explain that “These three criteria are quite independent, but as an empirical fact of observation they develop in the same direction, and can be treated as various aspects of the same process.” (i.e. Hubble observed them to be correlated).
It’s been known for a long time that there are examples where bulge (or “unresolved nuclear region”) size and arm winding did not agree, but these are usually treated as exceptions. What we’ve shown in this paper, is that for a sample selection which goes beyond just the brightest nearby galaxies Hubble could see, the correlation is not strong at all. Below is an annotated version of our main result figure – each point is a spiral with Galaxy Zoo classifications, and the contours show where there are lots of points. We find spirals all over this plot (except not many with big bulges and loosely wound arms), and the red and blue lines show the lack of any strong trend in either direction.
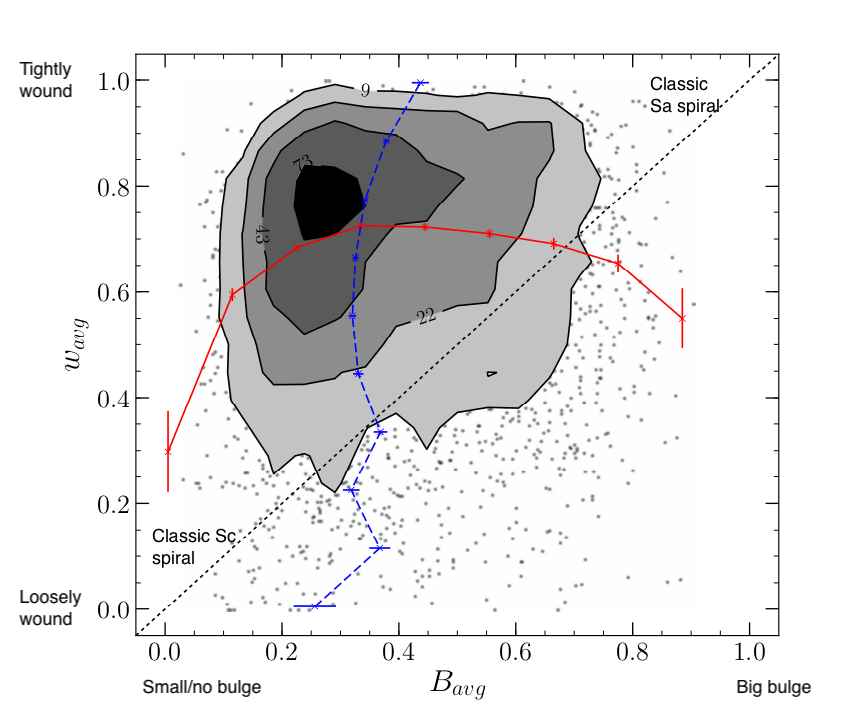
Figure 5 from Masters et al. (2019) paper.
This has significantly implications for how we interpret spiral winding angles, and could be explained by many/most spiral arms winding up over time (at rates which depend on the bulge size) rather than being density waves. We need to do more work to really understand what this observation tells us (which is a great place to be in science!).
We have also known for a while, that bulge size correlates best with modern expert galaxy classification on the Hubble sequence (e.g. when we compared you classifications to the largest samples done in that way). So another point we make in this paper is how different these modern classifications are to the traditional classifications done by Hubble and others. That’s OK – classifications should (and do) shift in science (part of the scientific method is to change on the basis of evidence), but it does mean care needs to be taken to be precise about what is meant by “morphology of galaxies”.
I ended the abstract of the paper with: “It is remarkable that after over 170 years of observations of spiral arms in galaxies our understanding of them remains incomplete.” and I really think that’s a good place to end. Galaxy morphology provides a rich source of data for understanding the physics of galaxies, and thanks to you we have access to the largest and most reliable set of galaxy morphologies ever.
If you’re inspired to keep classifying, head over to the main Galaxy Zoo project, or why not draw a few spiral arms over at Galaxy Zoo: 3D where we’re trying to understand spiral arms in more detail.
Radio Galaxy Zoo studies cluster environment impact on radio galaxy morphologies
The following blogpost is from Avery Garon who led the publication of Radio Galaxy Zoo’s latest science result. Congratulations to Avery and team!
***************
Radio Galaxy Zoo is starting the new year strong, with another paper just accepted for publication. “Radio Galaxy Zoo: The Distortion of Radio Galaxies by Galaxy Clusters” will appear soon in The Astronomical Journal and is available now as a pre-print on the arXiv: https://arxiv.org/abs/1901.05480. This paper was led by University of Minnesota graduate student Avery Garon and investigates several ways in which the shape of a galaxy’s radio emission is affected by and informs us about the environment in which we find the galaxy.
Like the previous RGZ paper, we are looking for how the radio tails extend into the hot plasma that fills galaxy clusters (the intracluster medium, or ICM). This time, we measure how much the two tails deviate from a straight line, marked in the example below by the value θ. The standard model is that the ICM exerts ram pressure on the galaxy as it travels though the cluster and causes its tails to bend away from the direction of motion. However, while individual clusters have been studied in great detail, no one has had a large enough sample of radio galaxies to statistically validate this model. Thanks to RGZ, we were able to observe the effect of ram pressure as a trend for the bending angle θ to increase for galaxies closer to the center of clusters (where the ICM density is higher) and in higher mass clusters (where the galaxies orbit with higher speeds).

Example source RGZ J080641.4+494629. The magenta arrows extend from the host galaxy identified by RGZ users and terminate at the peaks of the radio emission, defining the bending angle θ. The cyan arrow is used to define an orientation for the galaxy with respect to the cluster.
Because ram pressure causes the tails to bend away from the direction in which the galaxy is travelling, we can use this knowledge to map out the kinds of orbits that these galaxies are on. Unlike planetary orbits, which are nearly circular and all in the same plane, the orbits of galaxies in clusters tend to be randomly distributed in orientation and eccentricity. Our sample of bent radio galaxies shows an even more striking result: they are preferentially found in highly radial orbits that plunge through the center of their clusters, which suggests that they are being bent as their orbits take them through the dense central regions.
Finally, we looked at radio galaxies that were far from clusters. Even though the median bending angle is 0° away from clusters, there is still a small fraction of highly bent galaxies out there. By counting the number of optical galaxies that are near the radio galaxies, we observed a sharp increase in the number of companions within a few hundred kiloparsecs of our bent radio galaxies. This suggests that even outside of true cluster environments, we are still observing bending induced by local overdensities in the intergalactic medium.
Radio Galaxy Zoo’s ClaRAN
On the 31 October 2018, Radio Galaxy Zoo published its first end-to-end machine learning system for “Classifying Radio sources Automatically using Neural networks” (ClaRAN). This paper is led by ClaRAN’s developer, Chen Wu, a data scientist at the International Centre for Radio Astronomy Research at the University of Western Australia (ICRAR/UWA), who repurposed the FAST-rCNN algorithm (used by Microsoft and Facebook) to classify radio galaxies. ClaRAN was trained on radio galaxies classified by Radio Galaxy Zoo and so recognises some of the most common radio morphologies that have been classified.
The purpose of ClaRAN is to reduce the number of radio sources that require human visual classification so that future Radio Galaxy Zoo projects will have fewer “boring” sources, thereby increasing the chances of real discoveries by citizen scientists. ClaRAN (and its future cousins) are crucial for future surveys such as the EMU survey which is expected to detect ~70 million radio sources (using the Australian Square Kilometre Array Pathfinder telescope). While Radio Galaxy Zoo has made visual source classifications much more efficient, we will still need to reduce the total survey sample size to a sample for visual inspection that is less than 1% of the 70 million sources.
How does ClaRAN work? ClaRAN inspects both the radio and coordinate-matched infrared overlay in the same fashion as RGZ Zooites, and then determines the radio source component associations in a similar fashion to the RGZ Data Release 1 (DR1) catalogue. As ClaRAN is still in its prototype stage (–analogous to the capabilities of a toddler), it only understands 3 main classes of radio morphologies — sources which have 1-, 2- or 3- separate radio components. ClaRAN was trained to understand these three different radio morphologies through seeing examples of all three classes from the RGZ DR1 catalogue. The animated gif (from the ICRAR press release) describes how ClaRAN “sees” the example radio galaxy. Please do not click on the link to the animated gif if you suffer from epilepsy or have any issues with flashing images.
As we look towards the future, we look forward to teaching ClaRAN some of
the more complex and exotic radio galaxy structures. For that to happen, we need to assemble much larger samples of more complex radio morphology classifications. With your support of Radio Galaxy Zoo, I am sure that we will get there.
Fun fact: did you know that some of the more obscure bugs in the RGZ DR1 catalogue processing was actually found through training ClaRAN? This is because ClaRAN is a good learner and will learn all the small details that we didn’t initially notice. We only discovered these bugs through some of the funny answers that we got out of some of the early testing of ClaRAN.
Thank you very much again to all our Radio Galaxy Zooites for your support. More information on the ICRAR press release for ClaRAN can be found via this link: https://www.icrar.org/claran/
Classifying Galaxies from Another Universe!

We’re excited to announce the publication of another scientific study. that wouldn’t have been possible without the hard work of the Galaxy Zoo volunteers. The paper:
“Galaxy Zoo: Morphological classification of galaxy images from the Illustris simulation”
is the first Galaxy Zoo publication that examines visual morphological classifications of computer-generated galaxy images. The images were produced in collaboration with the international team of scientists who implemented and analyzed the highly sophisticated Illustris cosmological simulation (you can find many more details about Illustris on the main Illustris project website and about the Galaxy Zoo: Illustris project in this previous blog post). Illustris is designed to accurately model the evolution of our Universe from a time shortly after its birth until the present day. In the process, simulated particles of dark matter, gas, and stars aggregate and condense to form galaxy clusters that contain seemingly realistic galaxies. In our paper we wanted to test the realism of those simulated galaxies by inviting Galaxy Zoo volunteers to evaluate their morphological appearance. We wanted to know whether Illustris galaxies look like real galaxies.
But where to start looking? Well, if you’ve ever classified a galaxy on Galaxy Zoo then you must have answered a question worded something like:
Is the galaxy simply smooth and rounded, or does it have features?
This question represents one of the simplest ways to distinguish between different groups of galaxies, but its answer can reveal a lot of information about a galaxy’s history, as well as its current activity. Visible features and substructure like discs, spiral arms and bars in galaxy images often indicate sites of ongoing star formation and can provide evidence for complex dynamical processes within a galaxy. On the other hand, apparently featureless galaxies may have formed in dense environments where galaxy-galaxy interactions are more common and might act to destroy features or even prevent them from forming in the first place.
In our paper, we compared the prevalence of visible features in galaxy images that were produced using Illustris against an equivalent sample of real galaxy images that were derived from Sloan Digital Sky Survey (SDSS) observations. Some of the differences we found were surprising but quite illuminating!
Each image in Galaxy Zoo is classified by about forty volunteers and their votes for each question are aggregated to obtain a consensus. The level of agreement between volunteers can be quantified using the vote fraction for a particular response. For a particular image and question the vote fraction for a possible response is just the number of volunteers who voted for that response, divided by the total number of votes cast for that question, for that image. A concrete example that applies here is the “featured” vote fraction: the number of volunteers who classified a galaxy image as exhibiting visible features divided by the total number of votes cast for the simple question that was quoted above. Vote fractions close to zero indicate that most volunteers thought the galaxy was smooth and rounded, while vote fractions around one imply almost unanimous consensus that a galaxy has visible features.
The filled green bars in Figure 1 illustrate the distribution of this “featured” vote fraction for real galaxy images. The distribution is dominated by a peak close to zero, which means that most volunteers thought that most galaxies looked smooth and featureless. There is also a smaller peak close to one, corresponding to a population of obviously featured galaxies. In contrast, the blue line shows the “featured” vote fraction for Illustris galaxy images. The bulk of the distribution is now peaked around 0.6, which means that Illustris galaxies were generally perceived to be predominantly featured. However, there are very few Illustris galaxies that were unanimously labeled as exhibiting visible features and a substantial population of visibly smooth galaxies is also present. Overall, the Illustris galaxy images seem more feature rich, but perhaps slightly more ambiguous than their SDSS counterparts.
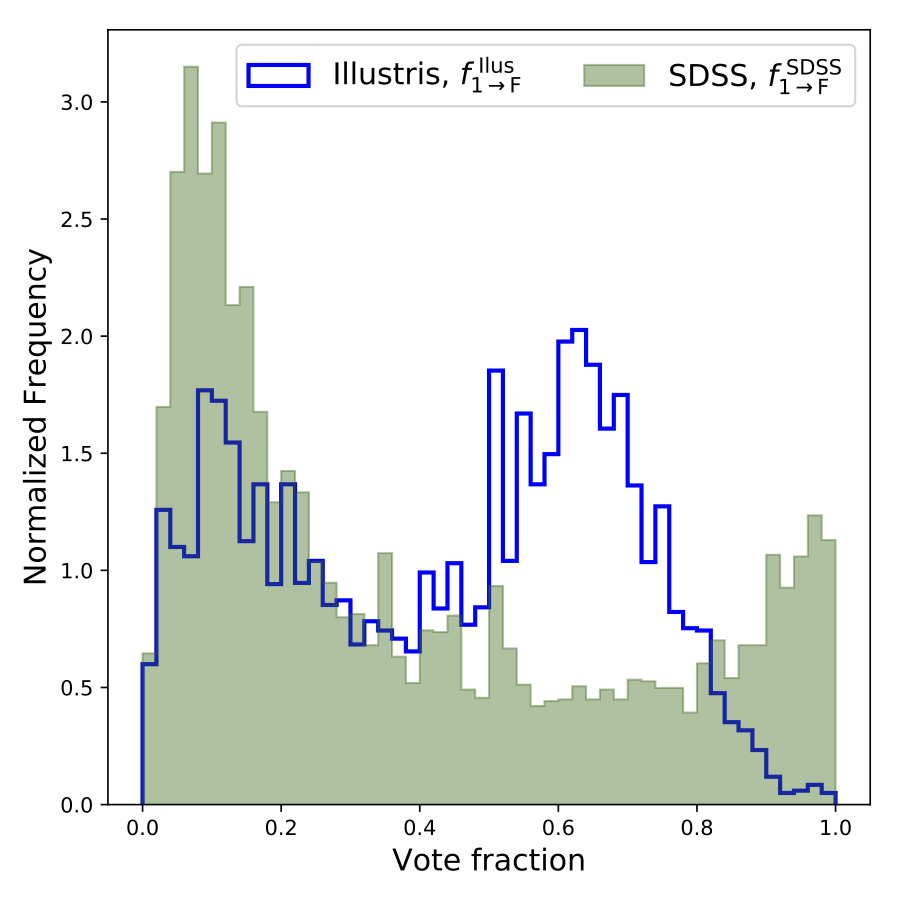
Figure 1: The distributions of the “featured” vote fraction for real (SDSS; Green, filled bars) and simulated (Illustris; Blue, hollow bars) galaxy images. There is an obvious mismatch between the distributions for the simulated and real galaxy images.
To try to understand the origin of the mismatch between Illustris galaxies and those in the real Universe, we separated both of the image samples into three sub-groups based on the total mass of the stars that the galaxies contain (more succinctly described as their “stellar mass”). Each of the panels in Figure 2 can be interpreted in the same way as Figure 1, except that they correspond only to the galaxies for each of the three stellar mass sub-groups. The two panels to the left are for galaxies with stellar masses less than the mass of 1000 billion suns. They look remarkably similar to Figure 1 with the SDSS and Illustris distributions matching very poorly. However, the situation changes markedly in the right-hand panel. For these extremely massive galaxies, it appears that the Illustris simulation reproduces the observed proportion of visibly featured galaxies much better, although the population of unambiguously featured galaxies is still absent.
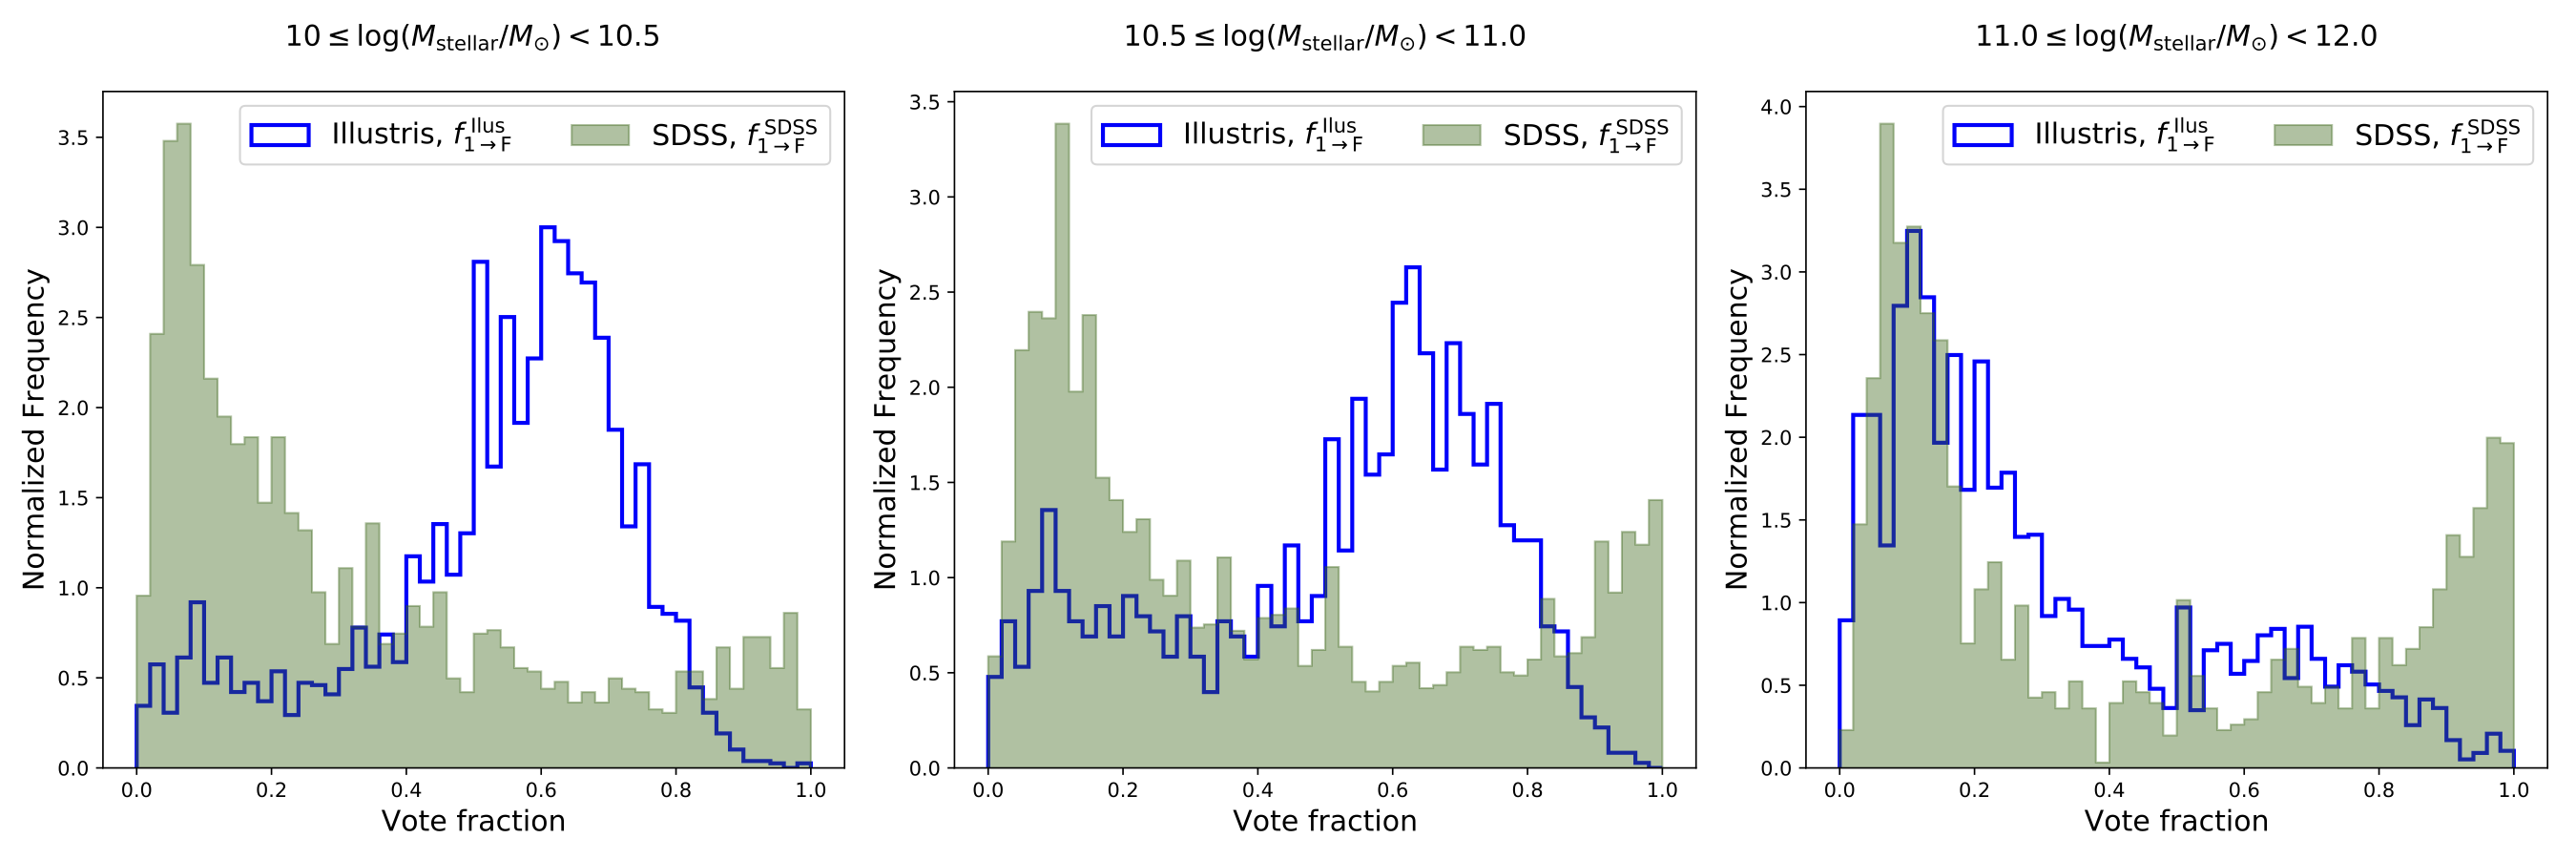
Figure 2: The distributions of the “featured” vote fraction for real (SDSS; Green, filled bars) and simulated (Illustris; Blue, hollow bars) galaxy images. The distributions are shown for sub-groups of galaxies that are subdivided according to stellar mass. The distributions for the most massive galaxies, with stellar masses greater than the mass of 1000 billion suns, are shown in the right-hand panel. It is only for these very massive galaxies that the vote fraction distributions for simulated and real galaxies begin to look similar.
The change in behavior with stellar-mass that we have identified might simply be an artifact of the finite resolution at which Illustris is able to simulate the Universe. Computational power is limited, so Illustris cannot accurately model the positions, interactions and evolution of every star in its simulation volume (and of course tracking individual gas atoms or dark matter particles is completely impossible!). Instead, Illustris models large groups of stars, and large accumulations of gas and dark matter as single “particles” and models the way that they interact with each other. The features that volunteers perceive in Illustris galaxy images manifest substructures formed by groups of many such particles. Simulated galaxies with larger stellar masses contain more stellar particles that enable the simulation to model finer structural details which may be necessary to emulate the appearance of real galaxies.
Studies involving automatic morphological classification of Illustris galaxy images (e.g. Bottrell et al 2017, Snyder et al 2015) have also identified a marked divergence with galaxies in the real Universe below the same 1000 billion solar mass limit that we have found. Confirmation that the visual appearance of galaxies also changes perceptibly complements a growing body of knowledge on this subject.
Dust is another constituent of galaxies that can substantially modify their appearance by absorbing bluer light that typically indicates star formation and re-emitting it at redder wavelengths. This dust reddening effect is not accounted for by the Illustris simulations and could obscure the visibility of features that are actually present in real galaxies. This means that Illustris might be modeling real galaxies better than it seems, and coupling of a dust reddening model to the simulation output might improve the correspondence between the mismatched vote fraction distributions at lower stellar masses.
As is often the case in scientific research, an unanticipated result has provided valuable insight. The results from Galaxy Zoo: Illustris will help cosmologists to improve their models as they develop the next generation of large-scale simulations of our Universe. The results also underline the ongoing potential utility for visual morphological classification of simulated galaxies. The most recent cosmological simulations, including a next-generation Illustris Simulation, address many of the shortcomings that this and other studies have revealed. Comparing their outputs with SDSS galaxy images, as well as observational data produced by other surveys, will undoubtedly yield more insights into the processes that govern the formation and evolution of galaxies. Watch this space!
A preprint of the new paper, which has been accepted by the Astrophysical Journal, can be downloaded from the arXiv.
Radio Galaxy Zoo finds rare HyMoRS!
The following blogpost is from Anna Kapinska about the Radio Galaxy Zoo paper that she published recently with Radio Galaxy Zooite, Ivan Terentev on the first sample of candidate Hybrid Morphology Radio Sources (HyMoRS) from the 1st year of Radio Galaxy Zoo results.
Radio Galaxy Zoo scores another scientific publication! The paper ‘Radio Galaxy Zoo: A search for hybrid morphology radio galaxies’ has been published today in the Astronomical Journal. First of all congratulations to everyone, and what wonderful work from all our citizen scientists and the science team! Special thanks go to Ivan Terentev, one of our very active citizen scientists, whose persistent work on finding and collecting HyMoRS in a discussion thread on RadioTalk (link) without doubt earned the second place in the author list of this paper. But of course the publication wouldn’t be possible without all our volunteers, and special thanks are noted in the paper (check out the Acknowledgements on page 14):
“This publication has been made possible by the participation of more than 11,000 volunteers in the Radio Galaxy Zoo Project. Their contributions are acknowledged at http:// rgzauthors.galaxyzoo.org. We thank the following volunteers, in particular, for their comments on the manuscript or active search for candidate RGZ HyMoRS on RadioTalk: Jean Tate, Tsimafei Matorny, Victor Linares Pagán, Christine Sunjoto, Leonie van Vliet, Claude Cornen, Sam Deen, K.T. Wraight, Chris Molloy, and Philip Dwyer.”
But what are HyMoRS? HYbrid MOrphology Radio Sources, HyMoRS or hybrids for short, are peculiar radio galaxies that show atypical radio morphologies. That is, radio galaxies which we can resolve in our observations come in two principal flavours: 1) FRI – type; and 2) FRII-type — named after two scientists who introduced this classification back in 1974, Berney Fanaroff and Julia Riley [link to paper].
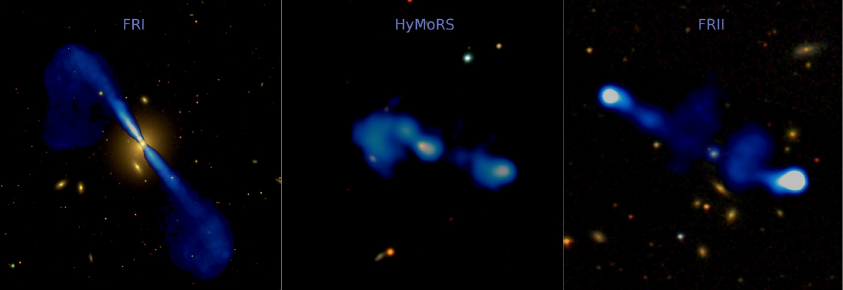
Figure 1. Three main types of radio galaxies. FRI type (3C 296, left panel), FRII type (3C 234, right panel), and a HyMoRS that shows a hybrid radio morphology of FRI on its eastern (left) side and FRII on its western (right) side (RGZ J103435.8+251817, middle panel). The radio emission from the jets is in blue, overlaid on the SDSS true colour images. Credits: Kapinska (based on FIRST/NRAO, SDSS, Leahy+Perley 1991).
Traditionally, FRIs and FRIIs are distinguished by different morphologies observed in radio images, where on the one hand we have archetypal FRIIs showing powerful jets that terminate in so-called hotspots (can be spotted in right panel of Figure 1 as two white bright spots at the ends of the jets), while on the other there are FRIs with their jets often turbulent and brightest close to the host galaxy and its supermassive black hole (left panel of Figure 1). HyMoRS are hybrids, they show both morphologies at the same time, that is they look like FRI on one side and FRII on the other side. Figure 2 shows two examples of the new HyMoRS candidates that Radio Galaxy Zoo identified in this latest paper.
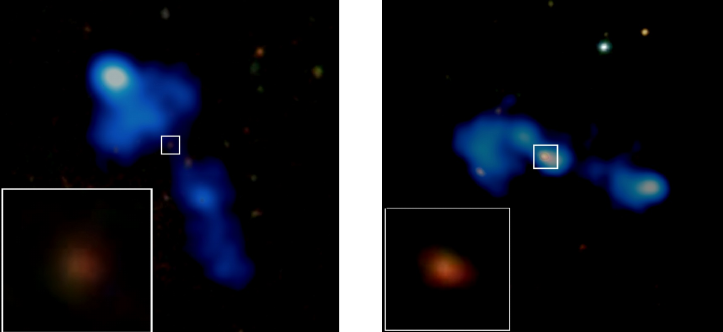
Figure 2. Two new HyMoRS candidates found with Radio Galaxy Zoo: RGZ J150407.5+574918 (left) and RGZ J103435.8+251817 (right). The radio emission from the jets is in blue overlaid on the SDSS true colour images. The inserts show zoom-ins on the HyMoRS’s SDSS images of the hosts galaxies. Credits: Kapinska (based on FIRST/NRAO, SDSS).
How are HyMoRS formed? We still don’t have a very clear answer to this question. The thing is that there may be many reasons why one radio galaxy would have so radically different looking jets. One possibility is that the medium in which the jets travel through (the space around) is different on each side of the galaxy. In this case the FRI morphology could form if the medium is dense or clumpy for one jet, while FRII morphology could form if the medium is smoother or less dense on the other side for the second jet (but watch this space for more work from our science team). But there are also other options. For example, we may simply see the radio galaxy in projection, or we are observing rare events of a radio galaxy switching off, or switching off and on again. The more HyMoRS we know of, the better we can study them and pinpoint the scenarios of how they form.
For example, the science team at the University of Tasmania has produced a simulation of jets from an FRII-type radio galaxy located in the outer regions of a cluster (~550 kpc from the centre) and expanding in a non-uniform cluster environment. The jet on one side propagates into a much denser medium than the jet on the other side. The jets are very powerful (10^38 Watts) and the total simulation time is 310 Myr. The movies display the density changes associated with the jet expansion. Credit goes to Katie Vandorou, Patrick Yates and Stas Shabala for this simulation (link to simulation).
How rare are HyMoRS? We actually don’t really know, and this is because so far there are very few complete surveys of these radio galaxies. Current estimates indicate that they may be comprising less than 1% of the whole radio galaxy population. We are hoping that with Radio Galaxy Zoo and the new-generation telescopes we will be able to finally pin down the HyMoRS population. And our paper is definitely one big step towards that aim. It’s very exciting as with the fantastic efforts of RGZ we now have 25 new HyMoRS candidates — this could possibly double the numbers on known hybrids!”
So well done everyone and let’s keep up the fantastic work! We couldn’t have done it without you 🙂
Anna, Ivan & the coauthors on this latest paper
___________________
The official open access refereed paper can now be found at http://iopscience.iop.org/article/10.3847/1538-3881/aa90b7
The article can also be downloaded from: http://arxiv.org/abs/1711.09611
A CAASTRO story with embedded animation is now available at: http://www.caastro.org/news/2017-hymors
Shedding light on the mutual alignment of radio sources
The following blogpost is from Omar Contigiani about the Radio Galaxy Zoo paper that he published recently on the cosmic alignment of radio sources.
In the Radio Galaxy Zoo an incredible variety of creatures can be found — as our citizen scientists might know by now, radio sources in the sky can have all sorts of shape and sizes. The most powerful among them are plasma-filled jets emitted by the some of the largest elliptical galaxies in existence. Because of their precise structure, anyone can associate orientations to these sources by simply looking at the directions the jets point at.

Figure 1: Illustration of jet orientations distributed in the sky. Note that this figure only depicts a small fraction of the total area covered by the observations upon which RGZ is based. Credit: NASA, ESA, S. Baum & C. O’Dea (RIT), R. Perley & W. Cotton (NRAO/AUI/NSF).
Recently, our scientists have been looking at the directional properties of these fascinating beasts. If a particular source points in a direction, is it possible that its neighbours also tend to do the same? Because the distances between adjacent objects are (quite literally) astronomical, it seems intuitive to assume that the relative orientations should be random. However, nature always finds subtle ways to mess with our intuition and it turns out that this is currently an open question in astronomy. Thanks to Radio Galaxy Zoo’s numerous (almost two million) image classifications, the team was able to report the most precise measurement of this effect to date. The results are available in a scientific article published in Monthly Notices of the Royal Astronomical Society this November.
The analysis performed in the study suggests that relative alignment of radio sources is present on distances which are dubbed as cosmological. This is because only phenomena related to the history of the Universe as a whole are known to be connected to such large scales.
While this is an exciting step towards an answer, formulating any conclusive statement about this alignment and the reasons behind it appears to be difficult. What drives this effect? Is it related to a shared history or environment? More science needs to be done and more galvanising discoveries are waiting for us just around the corner.
Once again, without the contributions made by our volunteers all over the world, we would not have been so successful in our endeavours. A big thank you to all our Radio Galaxy Zooites!
However, we have only reached 74% of our classification target. Head to Radio Galaxy Zoo to become involved and you will be contributing to real science being done today and may be co-authoring another great discovery with us!
Introducing the 100th Zooniverse Project: Galaxy Nurseries
It is my pleasure to announce the launch of a brand new Zooniverse project: Galaxy Nurseries. By taking part in this project, volunteers will help us measure the distances of thousands of galaxies, using their spectra. Before I tell you more about the new project and the fascinating science that you will be helping with, I have an announcement to make. Galaxy Nurseries is actually the 100th Zooniverse project, and we’re launching it in the year that Galaxy Zoo (the project that started the Zooniverse phenomenon) celebrates its 10 year anniversary. We can’t think of a better birthday present than a brand new galaxy project!
To celebrate these watersheds in the histories of the Zooniverse and Galaxy Zoo, we’re issuing a special challenge. Can you complete Galaxy Nurseries – the 100th Zooniverse project – in just 100 hours? We think you can do it. Prove us right!
Back to the science! What is Galaxy Nurseries? The main goal of this new project is to discover thousands of new baby galaxies in the distant Universe, using the light they emitted when the Universe was only half of its current age. Accurately measuring the distances to these galaxies is crucial, but this is not an easy task! To measure distances, images are not sufficient, and we need to analyze galaxy spectra. A spectrum is produced by decomposing the light that enters a telescope camera into its many different colors (or wavelengths). This is similar to the way that water droplets split white light into the beautiful colors of a rainbow after a storm.
The data that we use in this project come from the WISP survey. The “WISP” part stands for WFC3 IR Spectroscopic Parallel. This project uses the Wide Field Camera 3 carried by the Hubble Space Telescope to capture both images and spectra of hundreds of regions in the sky. These data allow us to find new galaxies (from the images) and simultaneously measure their distances (using the spectra).
This animation shows how a galaxy’s white light going through a prism gets decomposed into all its colors. Like the rainbow! The figure shows how the different colors end up in different positions. In this example violet/blue toward the bottom, orange/red toward the top. At each color, we have an image of the galaxy. When we sum the intensity at any given color, we obtained the spectrum to the right.
How do we do that? We need to identify features called “emission lines” in galaxy spectra. Emission lines appear as peaks in the spectrum and are produced when the presence of certain atomic elements in a galaxy (for example oxygen, or hydrogen), cause it to emit light much more strongly at a specific wavelength. The laws of physics tell us the exact wavelengths at which specific elements produce emission lines. We can use that information to tell how fast the galaxy is moving away from us by comparing the color of the emission line we actually measure with the color we know it had when it was produced. In the same way that the Doppler effect changes the apparent pitch of an ambulance’s siren as it approaches or recedes, the apparent color of an emission line depends on the speed of the galaxy that produced it. Then, we can relate the speed of the receding galaxy to how far it is from us through Edwin Hubble’s famous law.
The real trick is finding the emission line features in the galaxy spectra. Like many modern scientific experiments, we have written computer code that tries to identify these lines for us, but because our automatic line finder is only a machine, the code produces many bogus detections. It turns out that the visual processing power and critical thinking that human beings bring to bear is ideally suited for filtering out these bogus detections. By helping us to spot and eliminate the false positives, you will help us find galaxies that are some of the youngest and smallest that have ever been discovered. In addition, we can use your classifications to create a next-generation galaxy and line detection algorithm that is much less susceptible to being fooled and generating spurious detections. All your work will also be very valuable for the new NASA WFIRST telescope and for the ESA/NASA Euclid mission, which both will be launched in the coming decade.
Emission lines in a galaxy’s spectrum can tell us about much more than “just” its distance. For example, the presence of hydrogen and oxygen lines tells us that the galaxy contains very young, newborn stars. Only these stars are hot enough to warm the surrounding gas to sufficiently high temperatures that some of these lines appear. By examining emission lines we can also learn what kind of elements were already present and in what relative proportions. We too are “star-stuff”, and by looking at these young galaxies we are following the earliest formation of the elements that make all of us.

The horizontal rainbows show the spectra for the three objects on the left. The bottom, very compact object is a star in our own Milky Way. The other two objects are an interacting pair of young galaxies, observed as they were 7 billion years ago! We can say this because we see an emission line from hydrogen in both galaxies (indicated with arrows). This emission line allows us to measure the galaxies’ distances.
