
A sad farewell
I recently received word from his wife of the death of Jean Tate on November 6. Jean had been a very active participant in several astronomical Zooniverse projects for a decade, beginning with Galaxy Zoo. It does no disservice to other participants to note that he was one of the people who could be called super-volunteers, carrying his participation in both organized programs and personal research to the level associated with professional scientists. He identified a set of supergiant spiral galaxies, in work which was, while in progress, only partially scooped by a professional team elsewhere, and was a noted participant in the Andromeda project census of star clusters in that galaxy. In Radio Galaxy Zoo, he was a major factor in the identification of galaxies with strong emission lines and likely giant ionized clouds (“RGZ Green”), and took the lead in finding and characterizing the very rare active galactic nuclei with giant double radio sources from a spiral galaxy (“SDRAGNs”). He did a third of the work collecting public input and selecting targets to be observed in the Gems of the Galaxy Zoos Hubble program. Several of us hope to make sure that as much as possible of his research results from these programs are published in full.
Jean consistently pushed the science team to do our best and most rigorous work. He taught himself to use some of the software tools normally employed by professional astronomers, and was a full colleague in some of the Galaxy Zoo research projects. His interests had been honed by over two decades of participation in online forum discussions in the Bad Astronomy Bulletin Board (later BAUT, then Cosmoquest forum), where his clarity of logic and range of knowledge were the bane of posters defending poorly conceived ideas.
Perhaps as a result of previous experiences as a forum moderator, Jean was unusually dedicated to as much privacy as one can preserve while being active in online fora and projects (to the point that many colleagues were unaware of his gender until now). This led to subterfuges such as being listed in NASA proposals as part of the Oxford astronomy department, on the theory that it was the nominal home of Galaxy Zoo. Jean was married for 27 years, and had family scattered in both hemispheres with whom he enjoyed fairly recent visits. Mentions in email over the years had made me aware that he had a protracted struggle with cancer, to the extent that someday his case may be eventually identifiable in medical research. He tracked his mental processes, knowing how to time research tasks in the chemotherapy cycle to use his best days for various kinds of thinking.
This last month, emails had gone unanswered long enough that some of us were beginning to worry, and the worst was eventually confirmed. I felt this again two days ago, which was the first time I did not forward notice of an upcoming Zoo Gems observation by Hubble to Jean to be sure our records matched.
Ad astra, Jean.
Machine Learning Messaging Experiment
Alongside the new workflow that Galaxy Zoo has just launched (read more in this blog post: https://wp.me/p2mbJY-2tJ), we’re taking the opportunity to work once again with researchers from Ben Gurion University and Microsoft Research to run an experiment which looks at how we can communicate with volunteers. As part of this experiment volunteers classifying galaxies on the new workflow may see short messages about the new machine learning elements. Anyone seeing these messages will be given the option to withdraw from the experiment’; just select the ‘opt out’ button to avoid seeing any further messages.
After the experiment is finished we will publish a debrief blog here describing more of the details and presenting our results.
This messaging experiment has ethics approval from Ben Gurion University (reference: SISE-2019-01) and the University of Oxford (reference: R63818/RE001).
Galaxy Zoo Upgrade: Better Galaxies, Better Science
Since I joined the team in 2018, citizen scientists like you have given us over 2 million classifications for 50,000 galaxies. We rely on these classifications for our research: from spiral arm winding, to merging galaxies, to star formation – and that’s just in the last month!
We want to get as much science as possible out of every single click. Your time is valuable and we have an almost unlimited pile of galaxies to classify. To do this, we’ve spent the past year designing a system to prioritise which galaxies you see on the site – which you can choose to access via the ‘Enhanced’ workflow.
This workflow depends on a new automated galaxy classifier using machine learning – an AI, if you like. Our AI is good at classifying boring, easy galaxies very fast. You are a much better classifier, able to make sense of the most difficult galaxies and even make new discoveries like Voorwerpen, but unfortunately need to eat and sleep and so on. Our idea is to have you and the AI work together.
The AI can guess which challenging galaxies, if classified by you, would best help it to learn. Each morning, we upload around 100 of these extra-helpful galaxies. The next day, we collect the classifications and use them to teach our AI. Thanks to your classifications, our AI should improve over time. We also upload thousands of random galaxies and show each to 3 humans, to check our AI is working and to keep an eye out for anything exciting.
With this approach, we combine human skill with AI speed to classify far more galaxies and do better science. For each new survey:
- 40 humans classify the most challenging and helpful galaxies
- Each galaxy is seen by 3 humans
- The AI learns to predict well on all the simple galaxies not yet classified
What does this mean in practice? Those choosing the ‘Enhanced’ workflow will see somewhat fewer simple galaxies (like the ones on the right), and somewhat more galaxies which are diverse, interesting and unusual (like the ones on the left). You will still see both interesting and simple galaxies, and still see every galaxy if you make enough classifications.
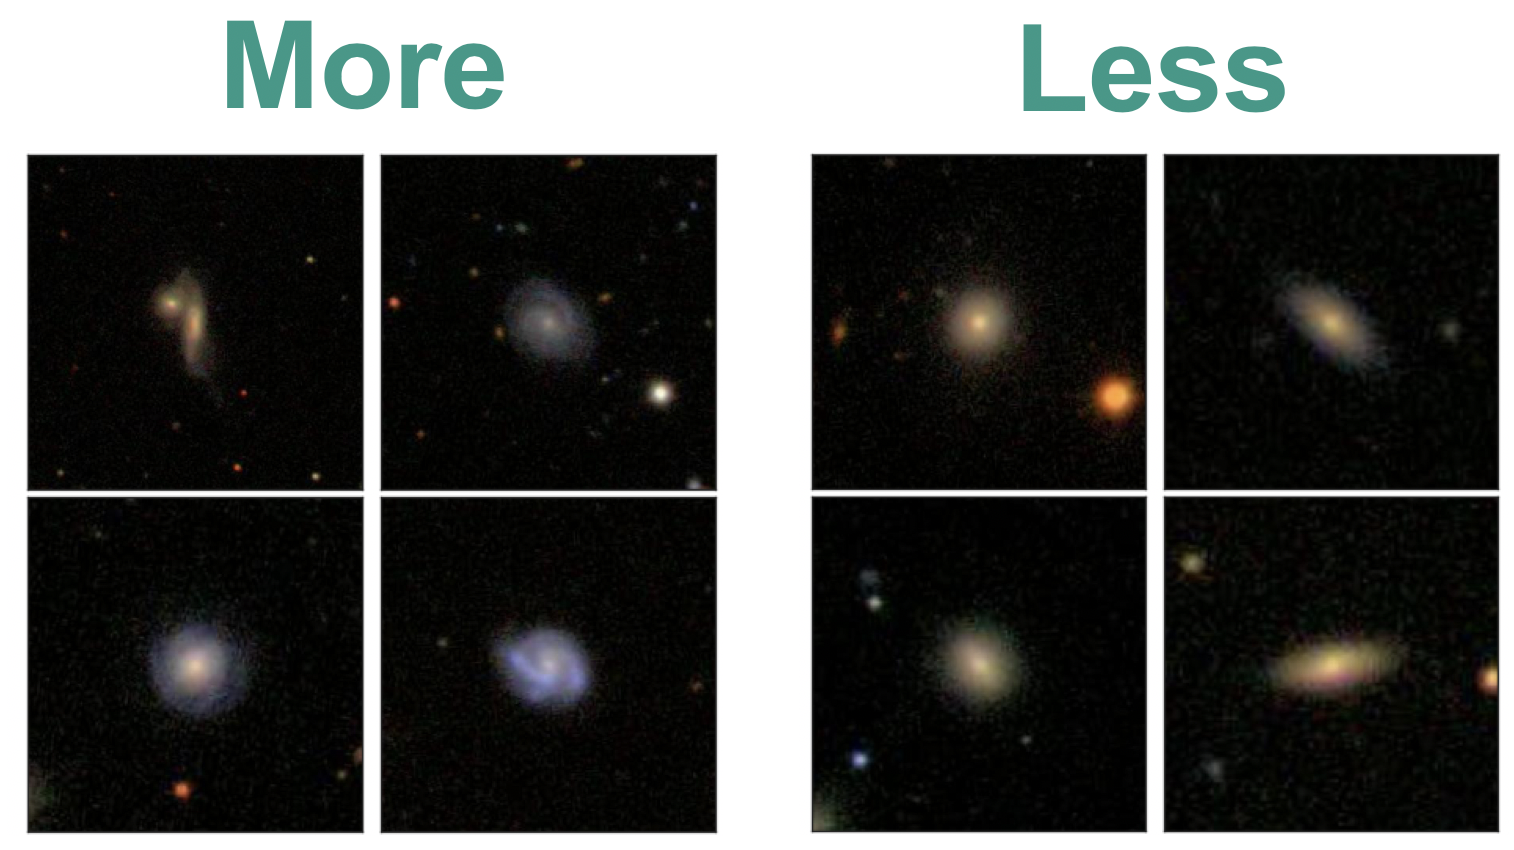
With our new system, you’ll see somewhat more galaxies like the ones on the left, and somewhat fewer like the ones on the right.
We would love for you to join in with our upgrade, because it helps us do more science. But if you like Galaxy Zoo just the way it is, no problem – we’ve made a copy (the ‘Classic’ workflow) that still shows random galaxies, just as we always have. If you’d like to know more, check out this post for more detail or read our paper. Separately, we’re also experimenting with sending short messages – check out this post to learn more.
Myself and the Galaxy Zoo team are really excited to see what you’ll discover. Let’s get started.
Scaling Galaxy Zoo with Bayesian Neural Networks
This is a technical overview of our recent paper (Walmsley 2019) aimed at astronomers. If you’d like an introduction to how machine learning improves Galaxy Zoo, check out this blog.
I’d love to be able to take every galaxy and say something about it’s morphology. The more galaxies we label, the more specific questions we can answer. When you want to know what fraction of low-mass barred spiral galaxies host AGN, suddenly it really matters that you have a lot of labelled galaxies to divide up.
But there’s a problem: humans don’t scale. Surveys keep getting bigger, but we will always have the same number of volunteers (applying order-of-magnitude astronomer math).
We’re struggling to keep pace now. When EUCLID (2022), LSST (2023) and WFIRST (2025ish) come online, we’ll start to look silly.

To keep up, Galaxy Zoo needs an automatic classifier. Other researchers have used responses that we’ve already collected from volunteers to train classifiers. The best performing of these are convolutional neural networks (CNNs) – a type of deep learning model tailored for image recognition. But CNNs have a drawback. They don’t easily handle uncertainty.
When learning, they implicitly assume that all labels are equally confident – which is definitely not the case for Galaxy Zoo (more in the section below). And when making (regression) predictions, they only give a ‘best guess’ answer with no error bars.
In our paper, we use Bayesian CNNs for morphology classification. Our Bayesian CNNs provide two key improvements:
- They account for varying uncertainty when learning from volunteer responses
- They predict full posteriors over the morphology of each galaxy
Using our Bayesian CNN, we can learn from noisy labels and make reliable predictions (with error bars) for hundreds of millions of galaxies.
How Bayesian Convolutional Neural Networks Work
There’s two key steps to creating Bayesian CNNs.
1. Predict the parameters of a probability distribution, not the label itself
Training neural networks is much like any other fitting problem: you tweak the model to match the observations. If all the labels are equally uncertain, you can just minimise the difference between your predictions and the observed values. But for Galaxy Zoo, many labels are more confident than others. If I observe that, for some galaxy, 30% of volunteers say “barred”, my confidence in that 30% massively depends on how many people replied – was it 4 or 40?
Instead, we predict the probability that a typical volunteer will say “Bar”, and minimise how surprised we should be given the total number of volunteers who replied. This way, our model understands that errors on galaxies where many volunteers replied are worse than errors on galaxies where few volunteers replied – letting it learn from every galaxy.
2. Use Dropout to Pretend to Train Many Networks
Our model now makes probabilistic predictions. But what if we had trained a different model? It would make slightly different probabilistic predictions. We need to marginalise over the possible models we might have trained. To do this, we use dropout. Dropout turns off many random neurons in our model, permuting our network into a new one each time we make predictions.
Below, you can see our Bayesian CNN in action. Each row is a galaxy (shown to the left). In the central column, our CNN makes a single probabilistic prediction (the probability that a typical volunteer would say “Bar”). We can interpret that as a posterior for the probability that k of N volunteers would say “Bar” – shown in black. On the right, we marginalise over many CNN using dropout. Each CNN posterior (grey) is different, but we can marginalise over them to get the posterior over many CNN (green) – our Bayesian prediction.

Read more about it in the paper.
Active Learning
Modern surveys will image hundreds of millions of galaxies – more than we can show to volunteers. Given that, which galaxies should we classify with volunteers, and which by our Bayesian CNN?
Ideally we would only show volunteers the images that the model would find most informative. The model should be able to ask – hey, these galaxies would be really helpful to learn from– can you label them for me please? Then the humans would label them and the model would retrain. This is active learning.
In our experiments, applying active learning reduces the number of galaxies needed to reach a given performance level by up to 35-60% (See the paper).
We can use our posteriors to work out which galaxies are most informative. Remember that we use dropout to approximate training many models (see above). We show in the paper that informative galaxies are galaxies where those models confidently disagree.
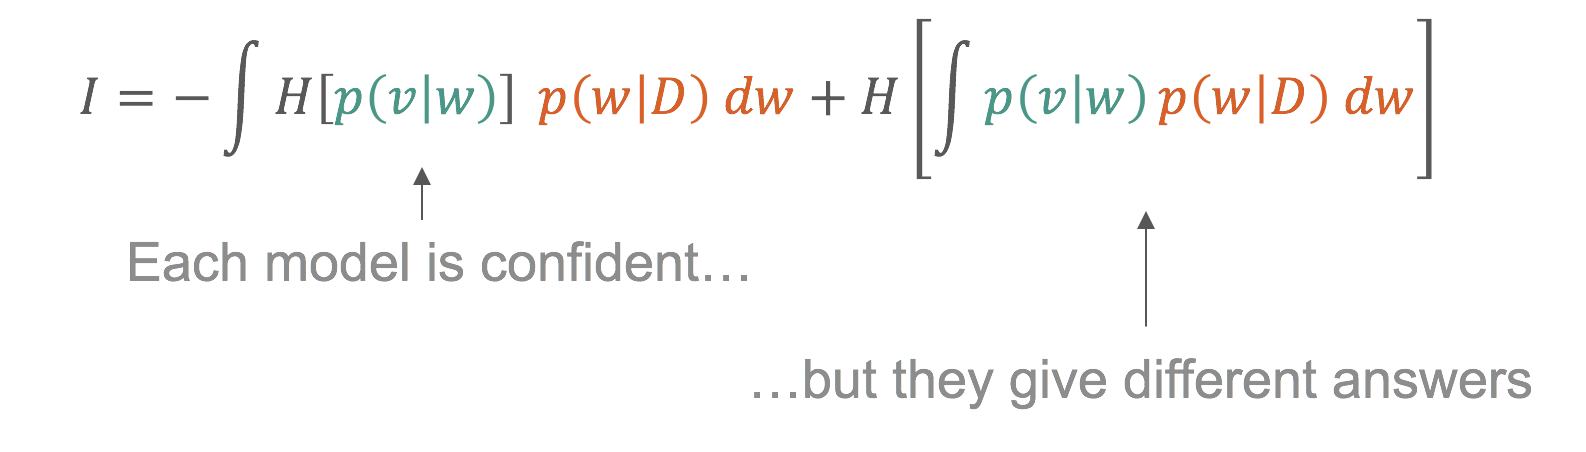
This is only possible because we think about labels probabilistically and approximate training many models.
What galaxies are informative? Exactly the galaxies you would intuitively expect.
- The model strongly prefers diverse featured galaxies over ellipticals
- For identifying bars, the model prefers galaxies which are better resolved (lower redshift)
This selection is completely automatic. Indeed, I didn’t realise the lower redshift preference until I looked at the images!
I’m excited to see what science can be done as we move from morphology catalogs of hundreds of thousands of galaxies to hundreds of millions. If you’d like to know more or you have any questions, get in touch in the comments or on Twitter (@mike_w_ai, @chrislintott, @yaringal).
Cheers,
Mike
Bayesian View of Galaxy Evolution
The Universe is pretty huge, and to understand it we need to collect vast amounts of data. The Hubble Telescope is just one of many telescopes collecting data from the Universe. Hubble alone produces 17.5 GB of raw science data each week. That means since its launch to low earth orbit in April 1990, it’s collected roughly a block of data equivalent in size to 6 million mp3 songs! With the launch of NASA’s James Webb Telescope just around the corner – (a tennis court sized space telescope!), the amount of raw data we can collect from the Universe is going to escalate dramatically. In order to decipher what this data is telling us about the Universe we need to use sophisticated statistical techniques. In this post I want to talk a bit about a particular technique I’ve been using called a Markov-Chain-Monte-Carlo (MCMC) simulation to learn about galaxy evolution.
Before we dive in into the statistics let me try and explain what I’m trying to figure out. We can model galaxy evolution by looking at a galaxy’s star formation rate (SFR) over time. Basically we want know to how fast a particular galaxy is making stars at any given time. Typically, a galaxy has an initial constant high SFR then at a time called t quench (tq) it’s SFR decreases exponentially which is characterised by a number called tau. Small tau means the galaxy stops forming stars, or is quenched, more rapidly. So overall for each galaxy we need to determine two numbers tq and tau to figure out how it evolved. Figure 1 shows what this model looks like.
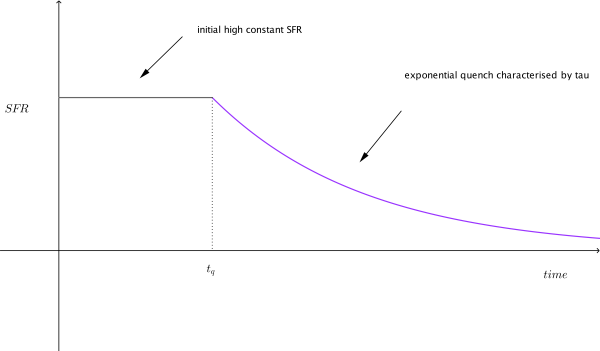
Figure 1: Model of a single galaxy’s SFR over time. Showing an initial high constant SFR, follow by a exponential quench at tq.
To calculate these two numbers, tq and tau, we look at the colour of the galaxy, specifically the UVJ colour I mentioned in my last post. We then compare this to a predicted colour of a galaxy for a specific value of tq and tau. The problem is that there are many different combinations of tq and tau, how to we find the best match for a galaxy? We use a MCMC simulation to do this.
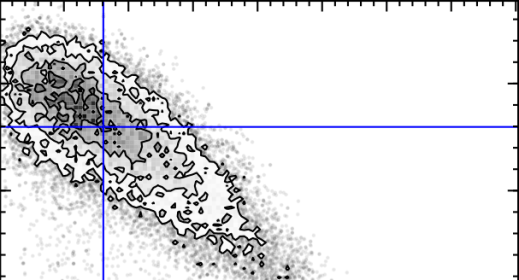
The first MC – Markov-Chain – just means an efficient random walk. We send “walkers” to have a look around for a good tq and tau, but the direction we send them to walk at each step depends on how good the tq and tau they are currently at is. The upshot of this is we quickly home in on a good value of tq and tau. The second MC – Monte Carlo – just picks out random values of tq and tau and tests how good they are by comparing the UVJ colours and our SFR model. Figure 2 shows a gif of a MCMC simulation of a single galaxy. The histograms shows the positions of the walkers searching the tq and tau space, and the blue crosshair shows the best fit value of tq and tau at every step. You can see the walkers homing in and settling down on the best value of tq and tau. I ran this simulation by running a modified version of the starpy code.
Figure 2: MCMC simulation for a single galaxy, pictured in the top right corner. Main plot shows density of walkers. Marginal histograms show 1D projections of walker densities. Blue crosshair shows best fit values of tq and tau at each step.
The maths that underpins this simulation is called Bayesian Statistics, and it’s quite a novel way of thinking about parameters and data. The main difference is that instead of treating unknown parameters as fixed quantities with associated error, they are treated as random variables described by probability distributions. It’s quite a powerful way of looking at the Universe! I’ve left all of the gory maths detail about MCMC out but if you’re interested an article by a DPhil student here at Oxford does are really good job of explaining it here.
So how does this all relate to galaxy morphology, and Galaxy Zoo classifications? I’m currently running the MCMC simulation showing in Figure 2 over the all the galaxies in the COSMOS survey. This is really cool because apart from getting to play with the University of Oxford’s super computer (544 cores!), I can use galaxy zoo morphology to see if the SFR of a galaxy over time is dependent on the galaxy’s shape, and overall learn what the vast amount of data I have says about galaxy evolution.


Eight Years of Galaxy Zoo
It’s our eighth birthday! The team have done a great job exploring the various ways the number eight connects to the Galaxy Zoo Universe and that collection of blogs does a brilliant job of illustrating the dramatic variety of places we’ve explored together. Some of them were familiar, but others we didn’t even dream of before the start of the project.

An 8 for our 8th birthday!
Once you start thinking about it, thinking of Galaxy Zoo as an exploration, as a journey undertaken as a group makes a lot of sense. Lots of you have joined us for the whole journey, as we’ve travelled further and further from familiar ground, while others – just as welcome – have walked only a little way. The science team, too, has grown as it has become apparent quite how much can be done with your classifications, and the whole grand parade has attracted a following of computer scientists, web developers and other assorted camp followers.
I’m writing this on my way to report on the arrival of New Horizons at Pluto for the Sky at Night. For the first time, we’ll see close up images of a world that until now has been little more than a point of light. The missions is part of the glorious tradition of Solar System exploration, but our journey through the datasets provided by the Sloan Digital Sky Survey and by Hubble are voyages of exploration too. We need not travel to distant galaxies to understand them; encountering something new and never-before-seen in your web browser is thrill enough. Thanks for all the classifications of the last eight years – here’s to many more.
Chris
Eight Years & the 8th Paper: Green Peas – Living Fossils of Galaxy Evolution

As we approach the 8th anniversary of the Galaxy Zoo project, it is a great opportunity to look back at one of the most fascinating discoveries of citizen science in Galaxy Zoo – the “Green Pea” galaxies. Volunteers on the forum first noted these galaxies due to their peculiar bright green color and small size. Their discovery was published in our 8th paper: ‘Galaxy Zoo Green Peas: discovery of a class of compact extremely star-forming galaxies’ and is noted on the blog here. But the story doesn’t end with their discovery.

Top Row: Green Peas in the original imaging are compact & bright green.
Bottom Row: Green Pea galaxies as imaged by the Hubble Space Telescope show patches of starformation.
In the years since the publication of their discovery paper by the Galaxy Zoo Science Team, the Green Peas are beginning to fulfill their promise as a living fossil of galaxy evolution. Because they aren’t too far away, they provide a unique local laboratory in which we can investigate processes key to the formation and evolution of galaxies in the early universe. They are living ‘fossils,’ undergoing extraordinary, intense starbursts unlike any other galaxies known in the local universe. Their color is due to a large amount of emission in an oxygen line [OIII]/5007A that made their appearance green in the images.
Follow-up studies of the Green Peas have looked in great detail at their abundances of various elements, something that cannot be done in their high redshift analogs. The results of these studies show that they have energetic outflows of gas and lower oxygen abundances than other typical local galaxies with similar masses. They also suggest what might be responsible for ionizing the gas in the galaxies and producing those bright emission lines (e.g., Wolf-Rayet stars). Their clumpy morphologies (or shapes) have been confirmed and suggest that star formation in the peas occurs in several separate knots throughout the galaxy. Their radio emission implies they have strong magnetic fields, larger than that of the Milky Way. All of these results paint a picture of galaxies very similar to those that formed in the early Universe.

This image shows radio emission detected from a combination (stack) of 32 different Green Pea Galaxies.
Results from studies of these galaxies can provide challenges to commonly accepted models. For example, the strong magnetic fields challenge models that suggest magnetic fields grow slowly over time and observations of the variation in Lyman alpha emission line profiles and strengths challenge models of the dependence of the emission line shape on gas properties in the galaxy. The Green Peas have held up their promise of lending new insights into galaxy evolution by characterizing an active mode of star formation, which contrasts with the typical more passive evolution dominating the local galaxy population. Studies of the Peas have suggested that a galaxy’s evolutionary pathway may depend on stochastic initial conditions, leading insights into our understandings of how galaxies throughout the Universe form.
New ATLAS images for Radio Galaxy Zoo
Dear Radio Galaxy Zoo volunteers,
Thanks again for all your help so far in classifying radio galaxies through RGZ. We’re rapidly approaching our 1 millionth classification, probably by the end of this week (Jan 15-17) at the current rate. Don’t forget that we’ll be awarding prizes!
In the meantime, we’re excited to announce that we’ve just finished processing a new set of images for RGZ. There are 2,461 new images in total: the radio images are from a survey named ATLAS, carried out by the ATCA telescope in Australia. The corresponding infrared images come from the Spitzer Space Telescope as part of a survey named SWIRE.
Due to the differences in telescopes (ATCA has fewer dishes and a different arrangement of them than the VLA, while Spitzer has a much bigger mirror than WISE) and the depths of the two surveys, the data will look a little bit different. If you’ve done lots of classifications on Radio Galaxy Zoo already, you may notice more elongated radio beams in the ATLAS data, as well as a slightly larger size of the smaller unresolved noise spots. ATLAS can also detect fainter objects than the FIRST survey.
The new SWIRE infrared images have about twice the angular resolution of WISE (it can separate objects down to 3 arcseconds apart) and are more than 20 times as sensitive. That means you’ll likely see more infrared objects in the new images, and might have more choices for likely host galaxies for radio emission.

An example of one of the new ATLAS/SWIRE images for Radio Galaxy Zoo, as seen in Talk. From left to right: radio contours, infrared overlaid with radio, infrared only.
Since the images are mostly similar, the task for RGZ hasn’t changed (in fact, the original tutorial image was from ATLAS data). We’re still asking you to pick out individual radio components (or groups of components) and match them to their IR host galaxies. The new images will be randomly mixed in with the older images; you should see an ATLAS image every 6th or 7th classification, on average. If you’re curious whether a galaxy you’ve just classified is in ATLAS, the easiest way is to look at it in Talk: the new galaxy names will begin with a “C” (eg, “CI3180”) and will have declinations that are negative (eg, -27.782) showing that they’re in the Southern Hemisphere.
We’ll post a longer blog post very shortly with more information on ATLAS, SWIRE, and what we’re hoping to learn from these new images. In the meantime, please post here or on Talk if you have any questions!
And keep up the classifications in the next few days — hopefully you can be our 1 millionth image!
Images and artifacts in Galaxy Zoo: UKIDSS
Last October, Galaxy Zoo began including new images from the UKIDSS survey on the main site. These are many of the same galaxies that were classified in GZ2, but the images come from a completely different telescope and a different wavelength — the infrared. While there’s a lot of science we’ll be able to do comparing galaxy morphologies at different wavelengths, many volunteers have noticed artifacts (features that aren’t real astronomical objects) in the UKIDSS images that can look very different from what you’re used to seeing in the SDSS or Hubble images:
- green squares
- rings and ghosts
- grid patterns and speckles
These are only a small percentage of the images we’re looking at, but it’s important to identify them and try to separate them cleanly from the galaxies we’re classifying. So here’s our “spotter’s guide” to UKIDSS image artifacts.
Green squares
All of the UKIDSS images you see in Galaxy Zoo are what we call “artificial-color” — we use images captured by the telescope’s infrared detector, and then combine the different infrared wavelengths into a single color image. For our images, we use data from the Y-band filter (1.03 microns) for the red channel, J-band filter (1.25 microns) for green, and K-band (2.20 microns) for the blue channel.
The images in Y, J, and K were taken at separate times and with different detectors and filters. So for changes in either the camera or the sky, these will often only show up in one color in the GZ images.
Some users have identified a persistent pattern in the images that looks like four little green pixels arranged in a square (looks a little like the UKIDSS logo!). This is from the J-band images.
The origin of the squares comes from the way that UKIRT processes data. Each patch of the sky is imaged in multiple exposures, and then these exposures are combined to get the final, deeper image. So each pixel in the image comes from four different locations on the detector. In the case of J-band images, the telescope actually took 8 different exposures during the dither pattern. For a few of the observing runs, the telescope lost the guidestar which keeps it positioned at the correct location; that means that the expected number of counts at the position of a bright star is lower due to the bad frame in the interlaced data. Normally, the software algorithms in UKIDSS drop the bad frames and correct for this effect; as GZ volunteers have identified, though, there are some cases where it didn’t work perfectly. (Many thanks to UKIDSS Survey Scientist Steve Warren at Imperial College London for his help in explaining this phenomenon.)
Since the exposure pattern is in a square, the bad pixels will show up where there’s a bright star and one of the four frames is bad (meaning counts are lower than they should be). That’s the origin of the pattern showing up in some images.
The four green dots in a square pattern on the left side of the image are from a single bad frame in the J-band processing of the data.
Grid patterns
As mentioned above, the telescope takes multiple exposures for each part of the sky that it images. To improve this, for some of the bands, it images the same part of the sky for a second round, but offsets the location of these by either an integer or half-integer pixel. The reason for this is so we can improve the angular resolution of the telescope – that is, distinguishing small features in the galaxy that are normally blurred out by either the Earth’s atmosphere or the limiting power of the telescope itself.
In the final data products, images from these offset frames are combined onto a fixed pixel scale in a process called interleaving. In some sources (bright ones especially), the gridding isn’t perfect and you can see some of the scale for this in the images.

Gridding pattern (the square pixels at the center of the bright blue star) are due to the interleaving process of combining data.
Green ghosts
Another feature people have spotted are what have been called “ghosts”: these can be either regular or irregularly shaped objects appearing in a couple specific colors. There might be multiple causes for these, but one of the most common is the presence of an actual contaminant (a speck of dust, for example) that got into the optics of the telescope. Since the telescope isn’t designed to focus on nearby objects, the point source is distorted, usually into a ring-like shape. The color of these images, like the green squares, depends on what band they were imaged in; red for Y-band, green for J-band, or blue for K-band.
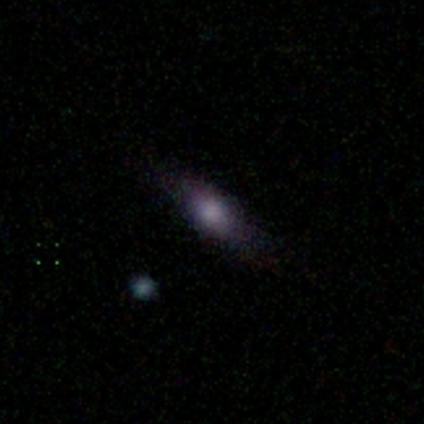
Here’s one example: you can see the green and blue ring to the right of the galaxy in the color GZ image. The raw data (in black and white) shows the same ring in multiple locations, which tells us that it remained in the same position on the detector, but appears several times as the telescope moves over the sky.

This image has an artifact (blue/green ring) to the right of the spiral galaxy AGZ00077ec.

The raw Y-band image of the data shows the same artifact appearing multiple times as the telescope tracks across the sky.
Result
We hope this has been useful, but please continue to discuss these in Talk and on the forums; particularly if there are any artifacts that impede your ability to make a good galaxy classification. Happy hunting, and thanks for continuing to participate with us on Galaxy Zoo.
