
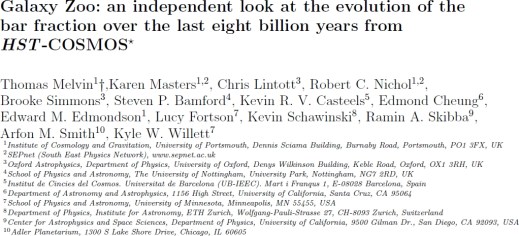
Here be SDRAGNS! Results from Radio Galaxy Zoo and Hubble’s Zoo Gems
It’s taken a while to get this finished, but I am happy to say that our paper combining Radio Galaxy Zoo and Hubble data on the rare spiral galaxies with large double radio sources (also known as SDRAGNs, Spiral Double Radio AGNs) has been accepted by the Astronomical Journal. The RGZ-HST sample is the largest set of such objects known (we found 15 cases, compared to 11 from everyone else published up through late 2025). With the collaboration of Alexei Moiseev and students using the 6-meter telescope, we could complete the set of redshifts and optical spectroscopic properties for these SDRAGNs
The Zoo Gems project of short-exposure Hubble observations gave us images of 36 potential SDRAGNs. Most of these turned out to be something else – a disturbed but not spiral galaxy, a spiral almost in front of the more distant radio galaxy… Still, we confirmed enough to more than double the known sample of these rare systems from 11 to 26, selected in more systematic ways than their predecessors. As a group, SDRAGNs have a wide range of Hubble types, from Sa to Sc – this was a bit unexpected, since the mass of the central black holes correlates with the bulge starlight, and the radio sources are probably powered by very massive black holes. (Also, another group including Wu, Ho, and Zhuang analyzed many of the Zoo Gems SDRAGN candidates and found that most of them have pseudobulges rather than classical bulges, which suggests that these galaxies have not undergone a major merger over their history). SDRAGN host galaxies are seen nearly edge-on more often than would be expected for a random set of spirals. We do not see many strong interactions, although there are several SDRAGNs with dust lanes twisted out of the galaxy plane which could result from a weak interaction a billion years before our current view. These galaxies occur in denser environments than average as traced by other galaxies, which fits with our understanding of the need to have circumgalactic gas for the radio jets to interact with in order to produce the powerful lobes of radio-emitting material. Combining the radio structures with galaxy properties from the Hubble images, perhaps our key results is that the radio jets merge preferentially within about 30 degrees of the poles of the galaxy disks. This helps understand why the jets make it outside the galaxy – they encounter the least interference from gas within the galaxy that way. This contrasts with the random orientations of those radio jets which happen in spiral Seyfert galaxies, which really do seem to have random directions and mostly dissolve within a few thousand light-years as they encounter the dense gas within the galaxy itself. Returning to the incidence of pseudobulges, within a major merger we expect the black hole to grow by incorporating material from within the galaxy, so it would keep roughly the same “spin” direction as the galaxy disk and impart that to the accretion disk and jets. This directionality seems to be more important than the mass or accretion rate of the black hole in producing SDRAGNs.
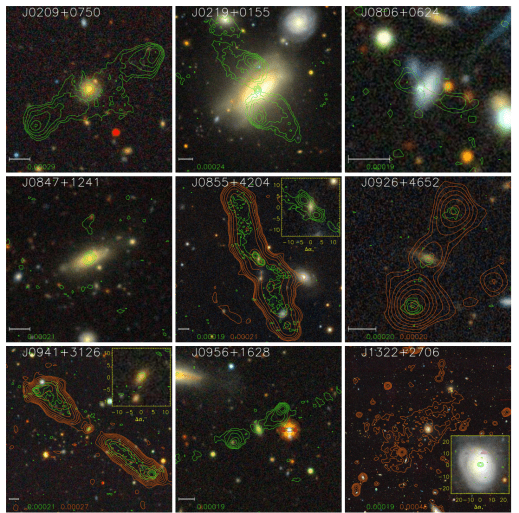
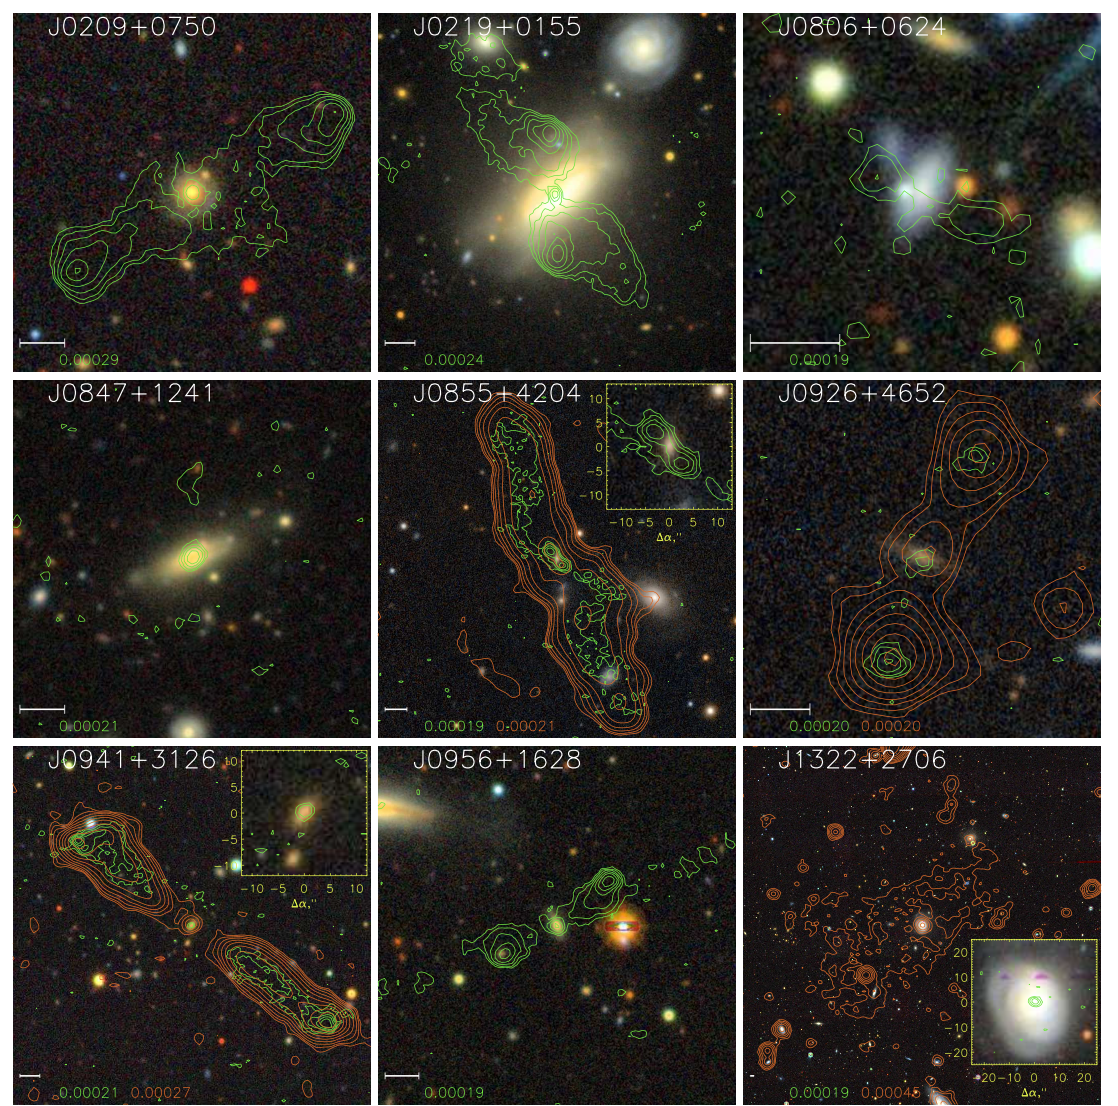
As examples of the data we could work with, here is a montage of 9 SDRAGNs using SDSS images overlaid with VLA Sky Survey contours (green) and contours from the lower-frequency LOFAR sky survey (orange). The LOFAR data became available only after the original Radio Galaxy, and are much more sensitive to the diffuse emission from radio lobes.
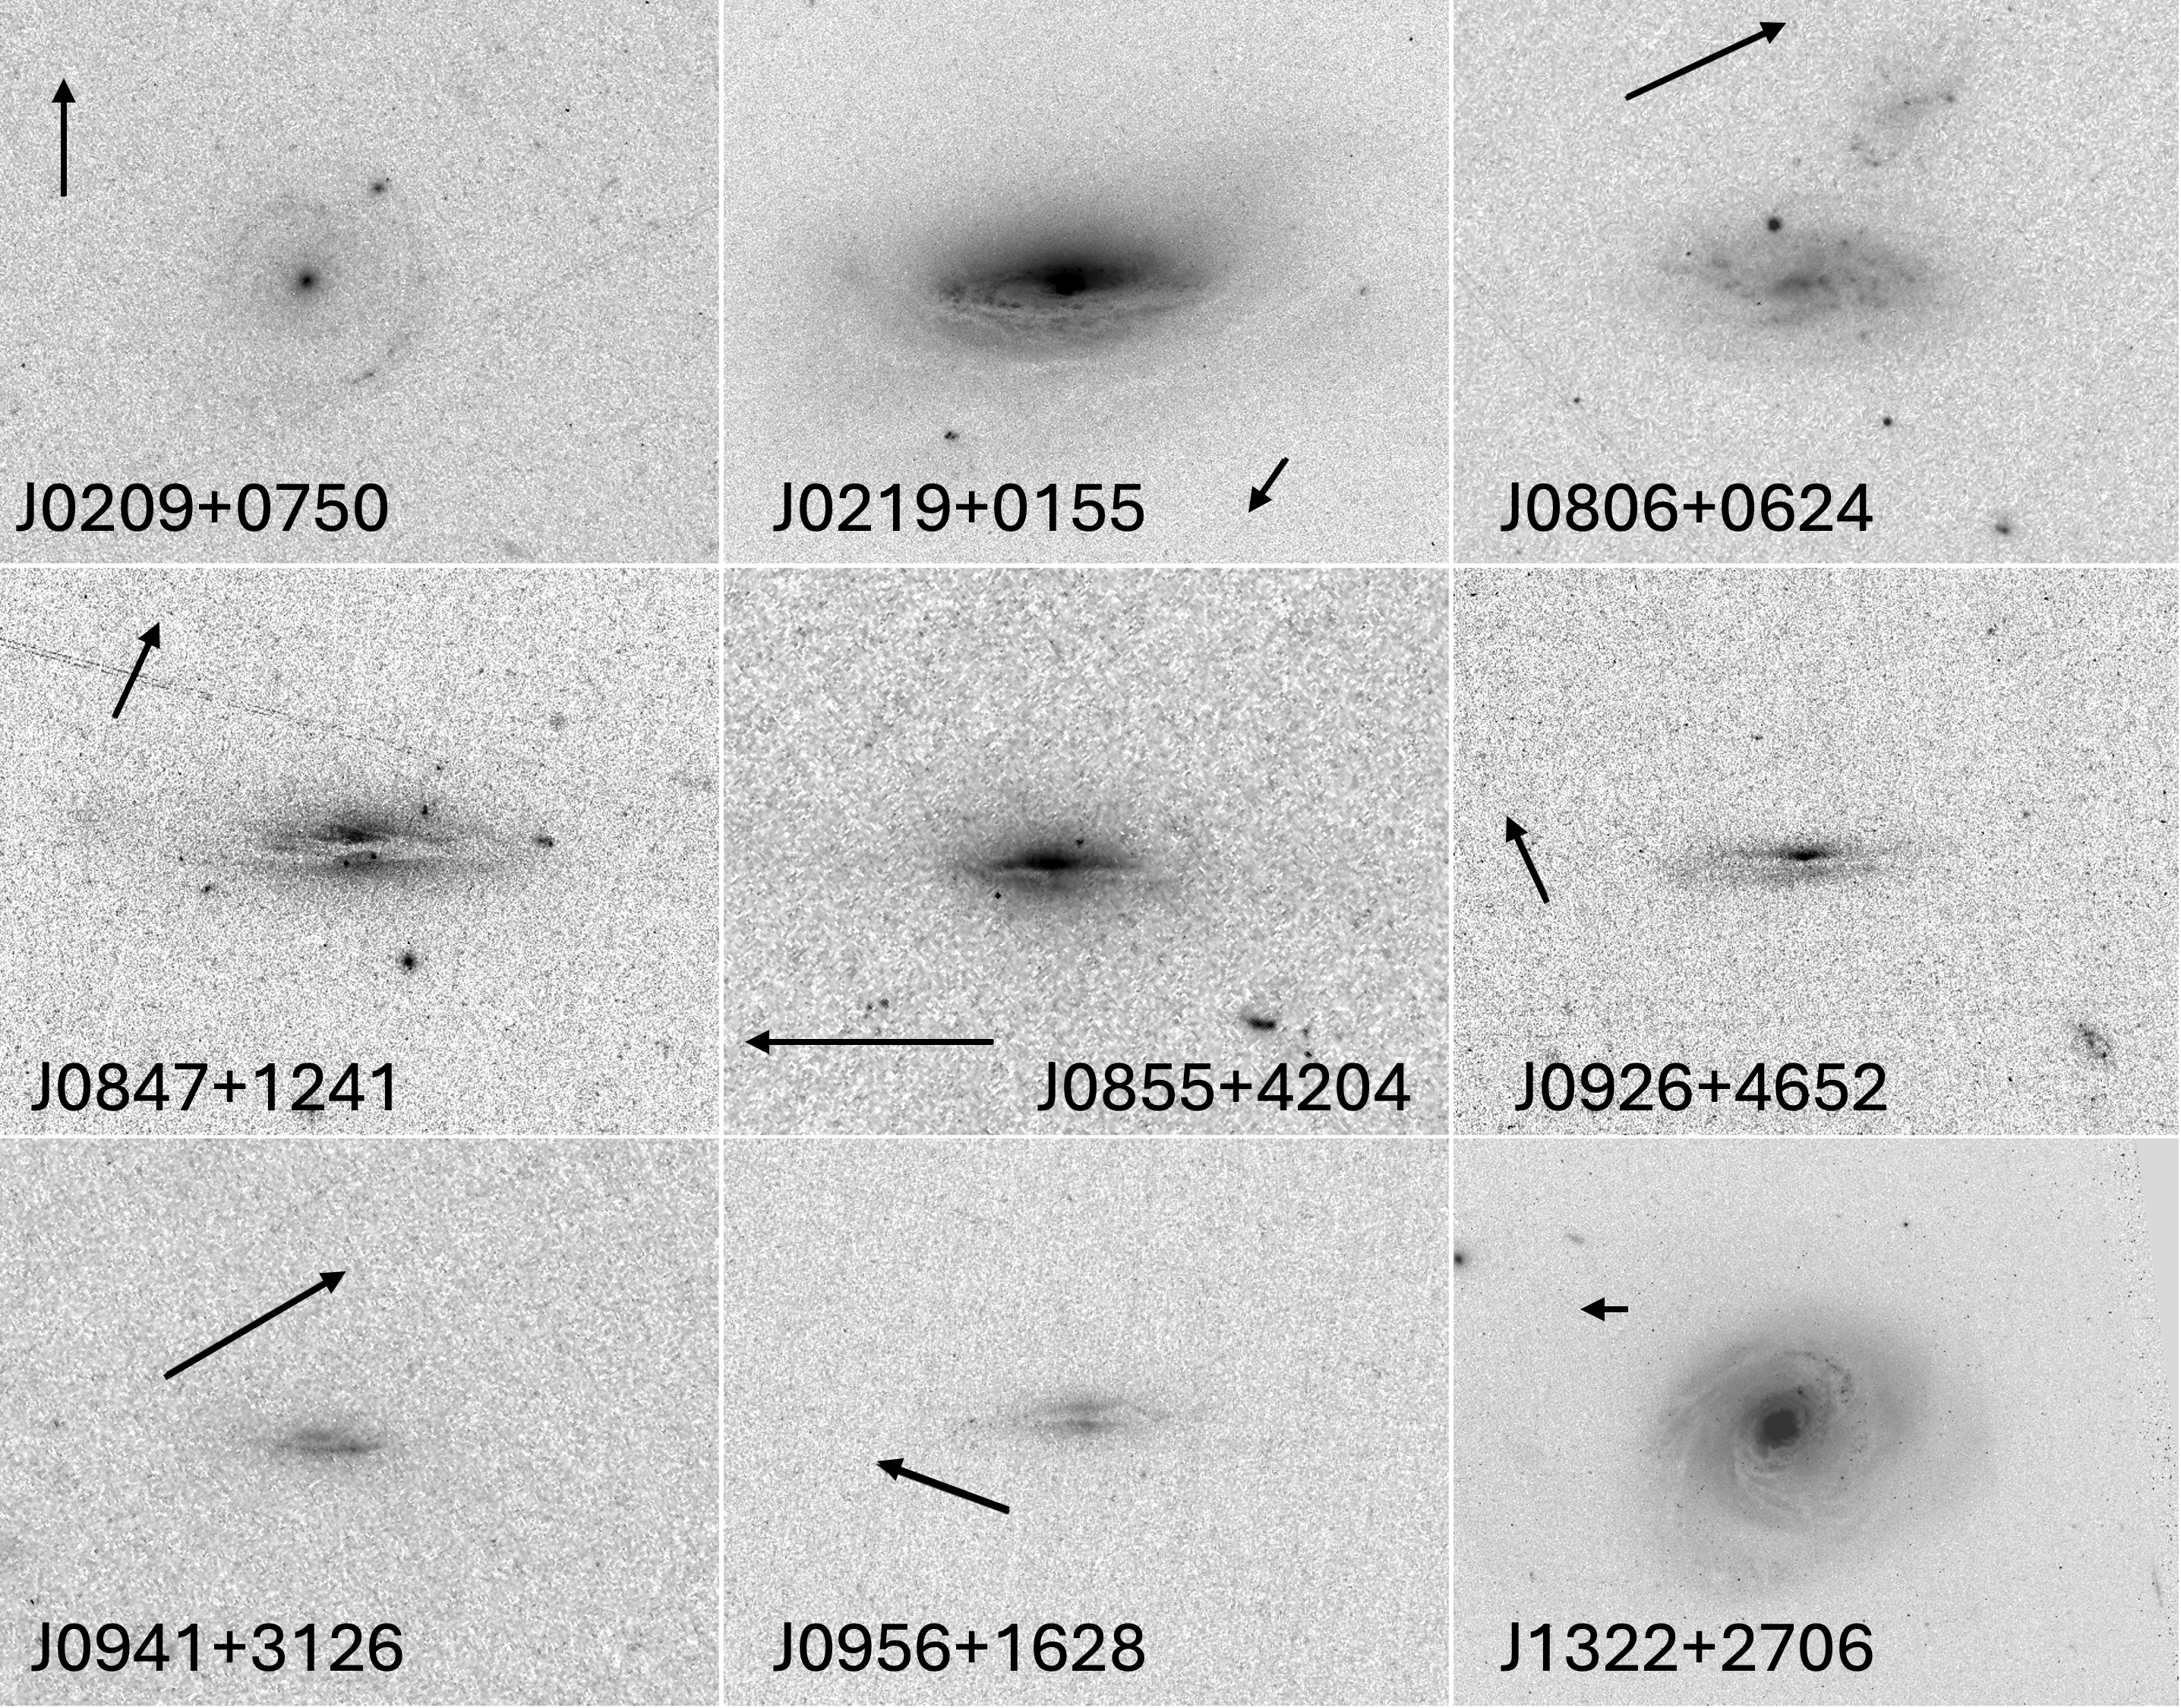
This montage shows the same nine SDRAGNs in negative views of the Hubble blue-light images. They are oriented so the galaxy plane is horizontal; arrows mark north and are 5 arcseconds long (matching the scale bars on the radio overlays).
Given the roots of Radio Galaxy Zoo and Zoo Gems in the Galaxy Zoo family, it would happen that one of the Hubble targets which turns out to not be a spiral does have a giant emission region similar to Voorwerpjes. We can’t help it, they are everywhere (and from some JWST data, almost everywhen too).
The manuscript is available from the arxiv repository (and from the AJ web site in a couple of months, after formal publication). Much of the text in the first two sections comes from a draft written by the late Jean Tate even before Hubble data started to arrive, and once again we regret that he did not live to see some of the later Hubble images. This was a favorite project of Jean, who managed most of the initial voting to select HST imaging candidates and kept the SDRAGN material in a PBWorks online repository, so well organized that we could reconstruct a great deal of the project detail from there. (The paper includes the master table of all 215 RGZ SDRAGN candidates in case someone else wants to follow them up).
Galaxy Zoo + Galaxy Zoo: 3D
Hi! I’m Tom, and I’m a PhD student at the University of Nottingham, doing some research to try to understand how spiral galaxies have grown and changed over their lifetimes. I’m especially interested in looking at how the spiral arms have been affecting the galaxy as a whole. I’ve recently finished up a paper in MNRAS in which I’ve been demonstrating a couple of new methods using some Galaxy Zoo data.
Amelia has already written [ https://blog.galaxyzoo.org/2018/07/17/finding-bars-in-galaxy-zoo-3d/ ] about how she is using the MaNGA survey [ https://www.sdss.org/surveys/manga/ ] to try to understand what’s happening in bars, so I won’t go into too much detail about this fantastic survey. I’ll just say that it’s part of the Sloan Digital Sky Survey, and for each of its sample of 10,000 galaxies, we have measurements of the spectrum at every position across the face of the galaxy.
MaNGA is really useful for trying to understand how galaxies have grown to their current size, because it is possible to get some sort of estimation of what kinds of stars are present in different locations of the galaxy. It’s a difficult thing to measure, so we can’t say exactly how many of every different type of star is present, but we can at least get a broad picture of the kinds of stellar ages and chemical enrichment (“metallicity”) in the stars. Astronomers have used these kinds of tools to measure the average age or metallicity of stars in different parts of galaxies, and found that in most spirals, the further out you go in the galaxy, the younger the stars are on average. The usual interpretation of this is that bulges tend to have formed first, and the disks have grown in size over time afterwards.

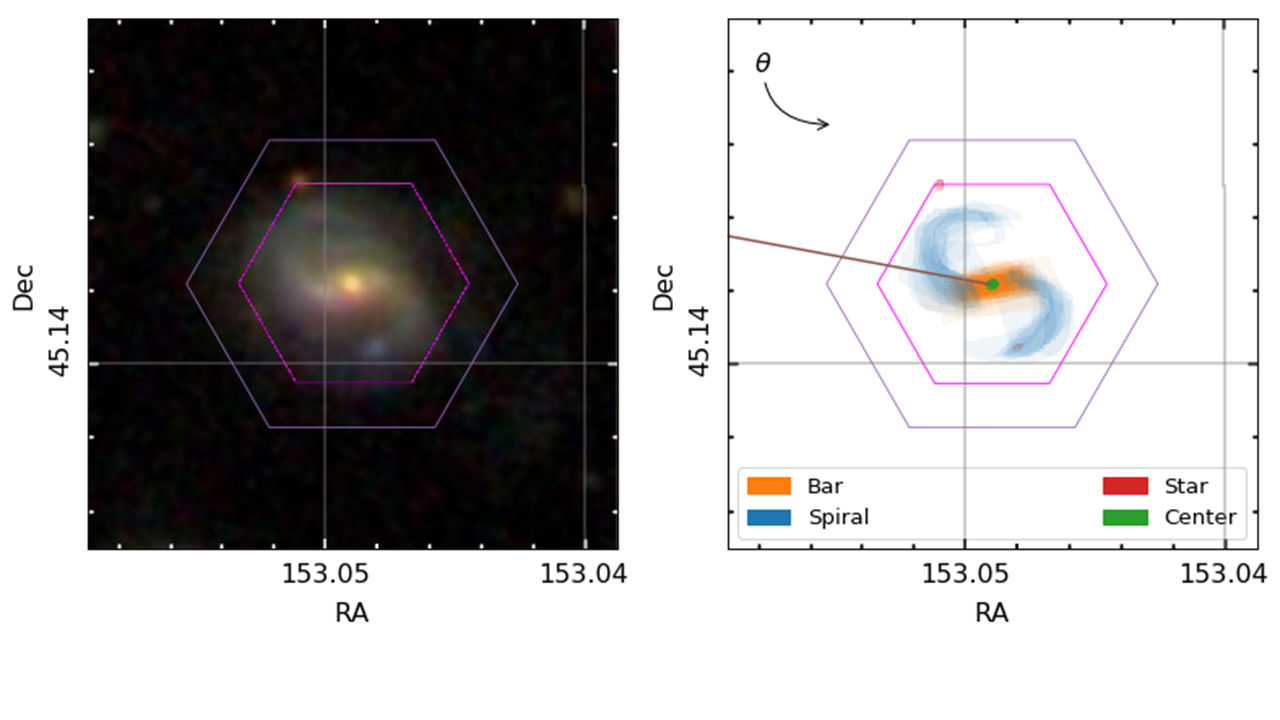
A MaNGA spiral galaxy. We can obtain information about the kinds of stars residing across the hexagonal area, which helps us understand how they’ve grown and evolved.
I’m really interested in trying to push this picture in two ways. Firstly, I’ve been trying to see what we can learn from looking at the general distribution of stars of different ages and metallicities – not just the average properties – at each location in the galaxy. Secondly, I think there is a lot of information that we risk ignoring by only looking at how things change with galactic radius. Spiral arms and the bar aren’t evenly distributed around the galaxy, so if we can see how the stellar properties change as we move around the galaxy, we should be able to measure what effect the spiral arms and bars have on the stars. The goal would be to try to confirm whether the most popular models of the nature of spiral arms and bars are correct or not.
To properly do this, we need to know exactly where the spiral arms and bars are in the MaNGA galaxies, so that we can see how the stars vary in these different regions. Enter Galaxy Zoo: 3D, where volunteers are asked to tell us where the different components are.
An example galaxy in MaNGA, where we’ve managed to split the galaxy into different stellar populations of different ages. Each frame shows where we find stars of a given age in this galaxy, starting from the oldest stars and finishing with the most recently formed stars. The colour denotes the mean metallicity of the stars, shown by the scale at the bottom.
All of this is what my most recent publication is about (read it in full at https://doi.org/10.1093/mnras/stz2204); we’ve shown that by combining the full spatial information available from MaNGA (augmented by Galaxy Zoo:3D) with the full distributions of the ages and metallicities of stars in each location, we can start to see some interesting things in the bar and spiral arms. It’s definitely best illustrated by an animation.
By splitting the age distributions up into different “time-slices”, we can create images of where stars of different ages are located in each of our MaNGA galaxies. Immediately from this one example, it’s obvious that there’s a lot of things going on here.
There are a few features in the animation that we’re not entirely convinced are real, but the main exciting things are that the spiral arms only show up in the youngest stars, and the bar grows and rotates as we move from older to younger stars. The growth of the bar is intriguing; this might be showing us how it formed. The bar changing with angle is even more exciting, and we think it shows us how quickly new-born stars become mixed and “locked” into the bar. The arms show what we should expect; spiral arms are areas of intense star formation, but over time the stars formed there will become mixed around the disk. We measured this effect by looking at what fraction of stars of each age are located in the volunteer-drawn spiral arms from Galaxy Zoo:3D.
This is really interesting, and highlights the power of combining large surveys like MaNGA with crowd-sourced information from the Zooniverse.
The next step is to do these kinds of things with more than just this one galaxy though. I’ve started looking at how these techniques can measure how fast the disks of spiral galaxies grew, using a large sample of spiral galaxies identified by Galaxy Zoo 2 volunteers. I’m also trying to measure how quickly stars get mixed away from spiral arms in different types of spiral galaxies. I have started to find some hints of some exciting results on both of these topics, which I would love to share in a future blog post if you’re interested.
We need volunteers to tell us where the spiral arms and bars are in galaxies, so that we can start to see what makes these regions special.
However, I’m currently limited in the number of galaxies with spiral arm regions identified by Galaxy Zoo:3D volunteers, so it would be really helpful if we could get some more! Understanding what makes spiral structure appear in disky galaxies is one of the unsolved problems in galaxy evolution and formation, and the clues to finding out might well lie in measuring how spiral arms affect the galaxy’s stars. Galaxy Zoo:3D will definitely be able to play a role in this! Help us out at https://www.zooniverse.org/projects/klmasters/galaxy-zoo-3d.
New paper on active black holes affecting star formation rates!
Good news everyone, another Galaxy Zoo paper was published today! This work was led by yours truly (Hi!) and looks at the impact that the central active black holes (active galactic nuclei; AGN) can have on the shape and star formation of their galaxy. It’s available here on astro-ph: http://arxiv.org/abs/1609.00023 and will soon be published in MNRAS.
Turns out, despite the fact that these supermassive black holes are TINY in comparison to their galaxy (300 light years across as opposed to 100,000 light years!) we see that within a population of these AGN galaxies the star formation rates have been recently and rapidly decreased. In a control sample of galaxies that don’t currently have an AGN in their centre, we don’t see the same thing happening. This phenomenon has been seen before in individual galaxies and predicted by simulations but this is the first time its been statistically shown to be happening within a large population. It’s tempting to say then that it’s the AGN that is directly causing this drop in the star formation rate (maybe because the energy thrown out by the active black hole blasts out or heats the gas needed to fuel star formation) but with the data we have we can’t say for definite if the AGN are the cause. It could be that this drop in star formation is being caused by another means entirely, which also coincidentally turns on an AGN in a galaxy.

A random sample of galaxies which host a central active black hole used in this work. The disc vote fraction classification from Galaxy Zoo 2 is shown for each image. Images from SDSS.
These galaxies were also all classified by our wonderful volunteers in Galaxy Zoo 2 which meant that we could also look whether this drop in the star formation rate was dependent on the morphology of the galaxy; turns out not so much! If the drop in the star formation rate is being caused directly by the AGN (and remember we still can’t say for sure!) then the central black hole of a galaxy doesn’t care what shape galaxy it’s in. An AGN will affect all galaxies, regardless of morphology, just the same.
Eight Years and the 8th Most Cited Paper from Galaxy Zoo
At Galaxy Zoo we’re really proud of our publication record – 48 papers and counting, just from the team using your classifications. In academic research one of the most important numbers a published paper has is the number which counts how many citations that paper has – simply a count of the number of other academic publications mention your work.
And we’re not only proud of the Galaxy Zoo publication record, but the citation record is becoming impressive too (if we do say so ourselves). For this post in the lead up to the 8th anniversary of the launch of Galaxy Zoo, here are the 8 most cited of our papers:
1. Lintott et al. 2008: “Galaxy Zoo: morphologies derived from visual inspection of galaxies from the Sloan Digital Sky Survey “(with 279 citations)
2. Bamford et al. 2009: “Galaxy Zoo: the dependence of morphology and colour on environment” (219 citations)
3. Lintott et al. 2011: “Galaxy Zoo 1: data release of morphological classifications for nearly 900 000 galaxies” (152 citations)
4. Skibba et al. 2009: “Galaxy Zoo: disentangling the environmental dependence of morphology and colour” (114 citations)
5. Schawinski et al. 2010: “Galaxy Zoo: The Fundamentally Different Co-Evolution of Supermassive Black Holes and Their Early- and Late-Type Host Galaxies” (102 citations)
6. Cardamone et al. 2009: “Galaxy Zoo Green Peas: discovery of a class of compact extremely star-forming galaxies” (101 citations)
7. Darg et al 2010: “Galaxy Zoo: the properties of merging galaxies in the nearby Universe – local environments, colours, masses, star formation rates and AGN activity” (92 citations)
8. Masters et al. 2010: “Galaxy Zoo: passive red spirals” (86 citations)
I’m personally especially proud of paper number 8 on that list, because it is one of the first papers I led making use of Galaxy Zoo classifications (and one of my most cited first author papers in fact). In that paper we explored the properties of the unusually passive (ie. not star forming) red spirals that had been noted in both Bamford et al. 2009 and Skibba et al. 2009. For astronomers this is one of the more well known discoveries from Galaxy Zoo, and these passive red spirals continue to be studied for what they can reveal about the modes of evolution of galaxies in our Universe, and that many spirals must stop forming stars before they lose their spiral structure.

A red elliptical and blue spiral (top), with a blue elliptical and red spiral (lower).
(By the way for academics who might be interested the h-index of Galaxy Zoo is 24).
The Green Valley is a Red Herring
Great news everybody! The latest Galaxy Zoo 1 paper has been accepted by MNRAS and has appeared on astro-ph: http://arxiv.org/abs/1402.4814
In this paper, we take a look at the most crucial event in the life of a galaxy: the end of star formation. We often call this process “quenching” and many astrophysicists have slightly different definitions of quenching. Galaxies are the place where cosmic gas condenses and, if it gets cold and dense enough, turns into stars. The resulting stars are what we really see as traditional optical astronomers.
Not all stars shine the same way though: stars much more massive than our sun are very bright and shine in a blue light as they are very hot. They’re also very short-lived. Lower mass stars take a more leisurely pace and don’t shine as bright (they’re not as hot). This is why star-forming galaxies are blue, and quiescent galaxies (or “quenched” galaxies) are red: once star formation stops, the bluest stars die first and aren’t replaced with new ones, so they leave behind only the longer-lived red stars for us to observe as the galaxy passively evolves.

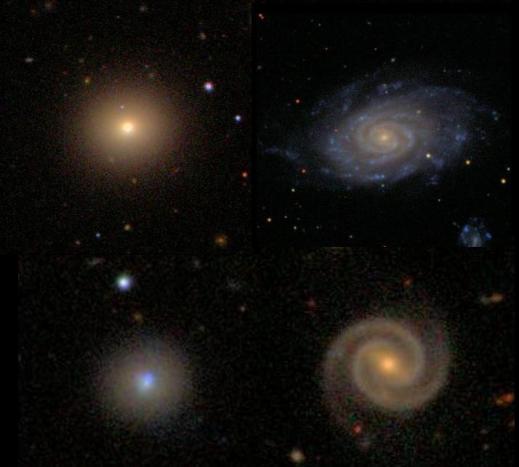
Example images of galaxies classified by you. There are blue, green and red spirals, and blue, green and red ellipticals.

As @penguin galaxy (aka Alice) put it….
Blue Ellipticals & Red Spirals
The received wisdom in galaxy evolution had been that spirals are blue, and ellipticals are red, meaning that spirals form new stars (or rather: convert gas into stars) and ellipticals do not form new stars (they have no gas to convert to stars). Since you’re taking part in Galaxy Zoo, you know that this isn’t entirely true: there are blue (star-forming) ellipticals and red (passive) spirals. It’s those unusual objects that we started Galaxy Zoo for, and in this paper they help us piece together how, why and when galaxies shut down their star formation. You can already conclude from the fact that blue ellipticals and red spirals exist that there is no one-to-one correlation between a galaxy’s morphology and whether or not it’s forming stars.

The colour-mass diagram of galaxies, split by shape. On the right: all galaxies. On the left: just the ellipticals (or early-types) on top and just the spirals (or late-types) on the bottom. On the x-axis is the galaxy mass. On the y-axis is galaxy colour. Bottom is blue (young stars) and top is red (no young stars).
Blue, Red and…. Green?
A few years back, astronomers noticed that not all galaxies are either blue and star forming or red and dead. There was a smaller population of galaxies in between those two, which they termed the “green valley” (the origin of the term is rather interesting and we talk about it in this Google+ hangout). So how do these “green” galaxies fit in? The natural conclusion was that these “in between” galaxies are the ones who are in the process of shutting down their star formation. They’re the galaxies which are in the process of quenching. Their star formation rate is dropping, which is why they have fewer and fewer young blue stars. With time, star formation should cease entirely and galaxies would become red and dead.
The Green Valley is a Red Herring
Ok, why is this green valley a red herring you ask? Simple: the green valley galaxies aren’t a single population of similar galaxies, but rather two completely different populations doing completely different things! And what’s the biggest evidence that this is the case? Some of them are “green spirals” and others are “green ellipticals”! (Ok, you probably saw that coming from a mile away).
So, we have both green spirals and green ellipticals. First: how do we know they must be doing very different things? If you look at the colour-mass diagram of only spirals and only ellipticals, we start to get some hints. Most ellipticals are red. A small number are blue, and a small number are green. If the blue ellipticals turn green and then red, they must do so quickly, or there would be far more green ellipticals. There would be a traffic jam in the green valley. So we suspect that quenching – the end of star formation – in ellipticals happens quickly.
In the case of spirals, we see lots of blue ones, quite a few green one and then red ones (Karen Masters has written several important Galaxy Zoo papers about these red spirals). If spirals slowly turn red, you’d expect them to start bunching up in the middle: the green “valley” which is revealed to be no such thing amongst spirals.

We can time how fast a galaxy quenches. On the x-axis is the optical colour, dominated by young-ish stars, while on the y-axis is a UV colour, dominated by the youngest, most short-lived stars.
Galaxy Quenching time scales
We can confirm this difference in quenching time scales by looking at the ultraviolet and optical colours of spirals and ellipticals in the green valley. What we see is that spirals start becoming redder in optical colours as their star formation rate goes down, but they are still blue in the ultraviolet. Why? Because they are still forming at least some baby stars and they are extremely bright and so blue that they emit a LOT of ultraviolet light. So even as the overall population of young stars declines, the galaxy is still blue in the UV.
Ellipticals, on the other hand, are much redder in the UV. This is because their star formation rate isn’t dropping slowly over time like the spirals, but rather goes to zero in a very short time. So, as the stellar populations age and become redder, NO new baby stars are added and the UV colour goes red.
It’s all about gas
Galaxies form stars because they have gas. This gas comes in from their cosmological surroundings, cools down into a disk and then turns into stars. Galaxies thus have a cosmological supply and a reservoir of gas (the disk). We also know observationally that gas turns into stars according to a specific recipe, the Schmidt-Kennicutt law. Basically that law says that in any dynamical time (the characteristic time scale of the gas disk), a small fraction (around 2%) of that gas turns into stars. Star formation is a rather inefficient process. With this in mind, we can explain the behaviour of ellipticals and spirals in terms of what happens to their gas.

A cartoon version of our picture of how spiral galaxies shut down their star formation.
Spirals are like Zombies
Spirals quench their star formation slowly over maybe a billion years or more. This can be explained by simply shutting off the cosmological supply of gas. The spiral is still left with its gas reservoir in the disk to form stars with. As time goes on, more and more of the gas is used up, and the star formation rate drops. Eventually, almost no gas is left and the originally blue spiral bursting with blue young stars has fewer and fewer young stars and so turns green and eventually red. That means spirals are a bit like zombies. Something shuts off their supply of gas. They’re already dead. But they have their gas reservoir, so they keep moving, moving not knowing that they’re already doomed.

A cartoon version of how we think ellipticals shut down their star formation.
Ellipticals life fast, die young
The ellipticals on the other hand quench their star formation really fast. That means it’s not enough to just shut off the gas supply, you also have to remove the gas reservoir in the galaxy. How do you do that? We’re not really sure, but it’s suspicious that most blue ellipticals look like they recently experienced a major galaxy merger. There are also hints that their black holes are feeding, so it’s possible an energetic outburst from their central black holes heated and ejected their gas reservoir in a short episode. But we don’t know for sure…
So that’s the general summary for the paper. Got questions? Ping me on twitter at @kevinschawinski
First Result from Galaxy Zoo Hubble
Posted on behalf of Tom Melvin:
Hello everyone, my name is Tom Melvin and I’m a 3rd year PhD student at Portsmouth University. I have been part of the Galaxy Zoo team for over two years now, but this is my first post for the Galaxy Zoo blog, hope you enjoy it!
I’m very happy to bring you news of the latest paper based on Galaxy Zoo classifications, and the first paper based on Galaxy Zoo: Hubble classifications. Galaxy Zoo: Hubble was the first Galaxy Zoo project to look at galaxies beyond our local universe, using the awesome power of the Hubble Space Telescope. These images contained light from galaxies which have taken up to eight billion years to reach us, so we see them as they appeared eight billion years ago, or when the universe was less than half its current age! So what is the first use of this data? Well, we combine our Galaxy Zoo: Hubble classifications with Galaxy Zoo 2 classifications to explore how the fraction of disk galaxies with galactic bars has changed over eight billion years.
Here’s the title…..
Our work is based on a sample of 2380 disk galaxies, which are from the Cosmic Evolution Survey (COSMOS), the largest survey Hubble has ever done. To see how the bar fraction varies over such a large time-scale, we look at the number of disk galaxies and what fraction of them have bars in 0.3 Gyr (300 million year) time steps. In Figure 1 we show that eight billion years ago only 11% of disk galaxies had bars. By 4 billion years ago this fraction had doubled, and today at least one third of disk galaxies have a bar.
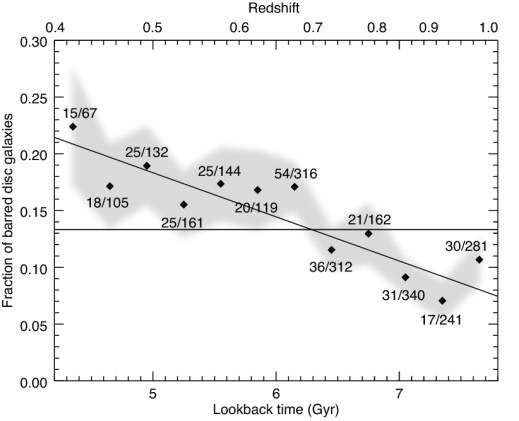
Figure 1: The evolving bar fraction with cosmic time (Figure 7 in the paper).
We know that bars tend to only form in disk galaxies which have low amounts of atomic gas and are in a relaxed state, or what we call ‘mature’. Combining this knowledge with our observations, we can say that, as the Universe gets older, the disk galaxy population as a whole is maturing. To see whether this is true for all disk galaxies, we split our sample up into three stellar mass bins, allowing us to look at the evolving bar fraction trends for low, intermediate and high mass disk galaxies.

Figure 2: Mass dependent evolution of the bar fraction with cosmic time (Figure 8 in the paper)
The results for this are shown in Figure 2, where we observe an intriguing result. The bar fraction increases at a much steeper rate with time for the most massive galaxies (red), compared to the lower mass galaxies (blue). From this we can say that the population of disk galaxies is maturing across the whole stellar mass range we explore, but it is predominantly the most massive galaxies which drive the overall time evolution of the bar fraction we observe in Figure 1.
At the end of the paper we offer an explanation as to why the time evolution of the bar fraction differs for varying stellar mass bins. We can make the reasonable assumption that, by eight billion years ago, the majority of massive disk galaxies have formed, and have been, and continue to form bars up to the present day – hence the steeply increasing bar fraction we observe. However, the same assumption is not true for the low mass galaxies. There are some which are ‘mature’ disk galaxies eight billion years ago, but not all are ‘mature’ enough to be classified as disks. As with the most massive galaxies, these low mass disks are forming bars at a similar rate up to the present day, but the difference with this low mass sample is that there are still low mass disks forming up to the present day as well – leading to the much shallower increase in the bar fraction with time we observe.
In addition to these results, we are also able to present an interesting subset of disk galaxies. Your visual classifications has allowed our work to include a sub-sample of ‘red’ spiral galaxies (like those found from Galaxy Zoo 2 classifications). This sub-sample is generally omitted from other works that have explored this topic, as their way of identifying disks is based on galaxy colours. This means that these ‘red’ galaxies would have been classified as elliptical galaxies! Figure 3 shows a few of these ‘red’ disk galaxies (with the full sample of 98 here), so why don’t you take a look and decide for yourself! Not only is it very cool that you are able to identify these ‘red’ disks, but they also influence the results we observe. Just like in our local universe, these ‘red’ disks have a high bar fraction, with 45% of them having a bar! Could this be a further sign that bars ‘kill’ galaxies, even at high redshifts?

Figure 3: A sample of ‘red’ disk galaxies found by Galaxy Zoo volunteers (Figure 10 in the paper).
So that is a summary of the first results from Galaxy Zoo: Hubble. If you want more detail have a read of the paper in full here and take a look at the press release too! Thanks for all your hard work and help in classifying these galaxies!
Posted on behalf of Tom Melvin.
Congratulations Edmond: another Galaxy Zoo paper accepted
A quick post to say congratulations to new Galaxy Zoo science team member Edmond Cheung, a PhD student from UC Santa Cruz, on the publication of his first Galaxy Zoo paper. Edmond approached us some time ago and was interested in doing further study on the barred galaxies in both Galaxy Zoo 2 and GZ: Hubble. This paper is the result of the excellent work he’s done looking at more detail on the properties of bars in the Galaxy Zoo 2 classifications.
The paper has recently been accepted to the Astrophysical Journal, and will appear on the arxiv very shortly.
The main result is a stronger proof than has ever before been seen that secular (that is, very slow) evolution affects the properties of barred galaxies, which grow larger bulges and slow down in their star formation the longer the bars grow (or the older the bars are).
Edit: This paper is now available on the arXiv at http://arxiv.org/abs/1310.2941
New paper on Red and Blue Spirals and Ellipticals
Just a quick note to point out a new paper based on Galaxy Zoo classifications appeared on the arxiv this morning (and just accepted to MNRAS): The Differing Star Formation Histories of Red and Blue Spirals and Ellipticals, by Rita Tojeiro et al.
In this work we took samples of galaxies split by their morphological classifications (from you all, and actually going back to the original Galaxy Zoo project) as well as by their optical colour. With the help of an Ogden Trust undergraduate summer student (Joshua Richards) we then compiled the average star formation histories of these samples, based on fits of star formation models to the Sloan Digital Sky Survey spectra of the galaxies (previously published and called VESPA, or “VErsatile SPectral Analysis” by Rita).
Our main result was that red spirals differ in their star formation histories from blue spirals only in the last billion years or less. We also find that blue ellipticals have very similar star formation histories to blue spirals. We show some results about the dust and metal (astronomers metal) content of the galaxies as well. I think it’s a nice project and I’m very happy to see it finally finished and published.
Thanks again for the classifications.
Chandra X-ray Observations of Mergers found in the Zoo Published
I hope you all had clear skies during the Transit of Venus. If not, it’ll be over a hundred years before you get another chance…. and in Zoo-related news, the Transit of Venus is an example of one way we find planets around other stars. We look for a dip in the brightness of the star as a planet moves across it from our point of view. Want to know more? Head over to the Planethunters blog, or put in some clicks looking for transits yourself!
So, in actual Galaxy Zoo news, I am very happy to report that the latest Galaxy Zoo study has been accepted for publication in the Astrophysical Journal. As we blogged a while back, we got Chandra X-ray time to observe a small sample of major mergers found by the Galaxy Zoo to look for double black holes. The idea is to look for the two black holes presumably brought into the merger by the two galaxies and see if we find both of them feeding by looking for them with an X-ray telescope (i.e. Chandra).
The lead author of the paper is Stacy Teng, a NASA postdoctoral fellow at NASA’s Goddard Space Flight Center and an expert on X-ray data analysis. In a sample of 12 merging galaxies, we find just one double active nucleus.

Image of the one merger with two feeding black holes. The white contours are the optical (SDSS) image while the pixels are X-rays. The red pixels are soft (low energy) X-ray photons, while the blue are hard (high energy) photons. You can see that both nuclei of the merger are visible in X-rays emitted by feeding supermassive black holes.
We submitted the resulting paper to the Astrophysical Journal where it underwent peer review. The reviewer suggested some changes and clarifications and so the paper was accepted for publication.
You can find the full paper in a variety of formats, including PDF, on the arxiv.
So what’s next? We submitted a proposal, led by Stacy, for the current Chandra cycle. To do a bigger, more comprehensive search for double black holes in mergers to put some real constraints on their abundance and properties. We hope to hear about whether the proposal is approved some time later this summer, so stay tuned and follow us on Twitter for breaking news!
Zoo 1 data set free
Hi all
It’s taken longer than it should have done – more than three years since the launch of the site – but the data from the original galaxy zoo is now available.

The paper describing the data set was only accepted by the journal yesterday, but we were confident enough after an earlier report to go ahead and make it public. The data can also be downloaded in a variety of formats from our site, or via Casjobs.
The data set is slightly updated from our previous efforts; while we’ve been busy with Galaxy Zoo, the good people of the Sloan Digital Sky Survey produced a new data release which included more spectra, allowing us to estimate biases for more galaxies than ever before.
We’ve had a lot of fun exploring this data set, and we hope that by making it available to all other astronomers then they will make use of your classifications too.
Knowing the Zoo, I wouldn’t be too surprised to see something interesting come from any of you who wanted to have a play – feel free to download and dig in, and let us know how you get on. Meanwhile, the team are working hard on Zoo 2, and hopefully it won’t take as long before that data set too is ready to go.
