
A first Galaxy Zoo:Rubin project
We’re delighted to announce the first Galaxy Zoo workflow to include images from the NSF-DOE Vera C Rubin Observatory, using galaxies drawn from its first Data Preview.
First look image showing the diversity of galaxies we can expect from the Vera C Rubin’s LSST survey.
The new workflow went live on the site just now, but with only 10,359 subjects it won’t stick around for long, so do jump in and get classifying. While the goal, as ever, is to understand the processes which shape the galaxies revealed by this new survey, we will also use the results from this project to help us decide which of the millions of galaxies that will be included in images from the Observatory’s upcoming Legacy Survey of Space and Time (LSST), which will start soon, should be classified. To this end, we’ve also included three different images of each galaxy, combining images taken with different filters (technically, these are ugri, riz, and gri images) so that we can see how classifications change if we include information from the ultraviolet (u band) and infrared (i and z bands).
These images were taken as part of the testing and commissioning the observatory teams carried out while preparing the telescope and camera for action. They are a little more rough and ready than those we will expect from the main survey, but they are just the start.
Once the main survey starts, Rubin will produce a spectacular treasury of galaxy images, and we’ve been looking forward to it for a long time. The first mention of the survey on this blog comes from 2008 (when we expected the start date to be, um, 2013, which may have been ambitious even then). Still, good things come to those who wait, and we’re excited to see what you make of these new images.
Chris & the Galaxy Zoo team.
From Galaxy Zoo to JWST – dust and gravitational lensing

My previous post on the Zooniverse blog gave some history of how having Galaxy Zoo participants call attention to backlit galaxies led to the galaxy pair VV191 being on the schedule for observations with the James Webb Space Telescope (JWST), what we expected to learn, and a final note to watch for the outcome in mid-2023. It is not yet mid-2023, and here we are with the outcome. A short-notice schedule reshuffling (which I suspect was enabled by how rapidly the commissioning process went, and the fact that this was a brief series of observations totaling only 30 minutes of exposure) brought these observations up to mid-July of this year.
Short form: we got what we came for, and the Universe provided interesting bonuses. NASA is releasing this nicely processed rendering of our combined Hubble and HST image sets today. The Hubble near-ultraviolet and red-light data are shown in blue, with green and red showing progressively deeper-infrared bands from JWST. 
The dust in the spiral arms of the big spiral (VV191b) stands out where it is silhouetted by the bright light of the elliptical galaxy VV191a. In fact, the dusty arms can be traced farther from the spiral’s center than even the JWST data show bright spiral arms, cutting off very sharply at a radius of 20 kiloparsecs (66,000 light-years, about 8 times the distance from us to our own galactic center). This testifies to the past history of star formation in VV191b. Having a map of the light transmitted through the dust at different wavelengths lets us examine the so-called reddening law, the relative amount of light blocked at different wavelengths. This is characteristic of the sizes of interstellar dust grains, and how they are distributed on scales smaller than we can resolve in our data. This RGB display shows the transmitted light at wavelengths 0.6-1.5 microns (plus background galaxies and foreground star-forming regions we masked in numerical analysis). The dust lanes are redder (or, to my eye, browner) than the surroundings, illustrating how blue light is more effectively blocked than red (and red more effectively than deeper red, and both of those compared to near-infrared, until at the 4.4-micron longest-wavelength band of JWST’s NIRCam detectors the absorption is too small to measure)
.
Analyzing these maps pixel by pixel (after matching the image resolutions; JWST images at 1.5 microns are still sharper than HST data at 0.6 microns, a welcome outcome which was not guaranteed) we can ask more precisely how the dust in VV191b reddens light passing through the galaxy. The answer is – a lot like typical dust grains in our part of the Milky Way. This was a bit unexpected first because while both are large spiral galaxies, VV191b is considerably larger than the Milky Way, and we are examining its outermost spiral features in ways that are very difficult in our own Galaxy. Second, where there are clumps with more dust than their surrounding, so smaller that our data blur them together with their surroundings, we will measure less reddening than we would if we could use single stars as background sources (“greyer extinction”).
There is more to learn, but these data are a great step. The research paper has been submitted to the Astronomical Journal, and is now under review; a preprint version is at https://arxiv.org/abs/2208.14475
In our first looks at the JWST data, something else became obvious. Near the core of the elliptical galaxy VV191a is a very red arc appearing to partly wrap around its nucleus. Opposite the nucleus is a much smaller red spot. Together these fit perfectly for being a gravitational lens, light from a galaxy over 10 billion light-years away, seen as the gravity of the foreground galaxy distorts and magnifies it. While hundreds of such lenses are known from more distant galaxy clusters (eagerly sought to improve our knowledge of very early galaxies), only a handful of single-galaxy lenses have been found so nearby. (There is a bit of irony in finding this – the overall project these data came from, led by Rogier Windhorst at Arizona State University, acquired the name PEARLS, Prime Extragalactic Areas for Reionization and Lensing Science, so now VV191 honestly belongs through that L). Team members Giovanni Ferrami and Stuart Wyithe from the University of Melbourne in Australia were able to get a good match to the lensing distortion using the galaxy’s light distribution and estimating the background galaxy distance from its colors. In fact, because everything is connected if you look closely, this measurement tells how much mass including dim dwarf stars plus dark matter is in that part of the foreground galaxy. A second distant background galaxy has only a single image, but is distorted in a way similar to the arc. These distant galaxies are so red that the lensing was not seen in the Hubble images, even though the arc was obvious in each of the JWST images. This crop shows the arc and its counterimage on either side of the elliptical-galaxy core.

Around the edge of the image above (which comes from only a single one of the eight near-IR detectors in the NIRCam instrument), many other background galaxies appear (they are everywhere with JWST, even showing up the recent Jupiter image). To the upper left of the elliptical galaxy are two patchy spiral galaxies that look almost the same size but have very different colors (one so red that, again, Hubble data did not show it). Without further data they could be at similar distances but one so dusty that dust reddening change sits colors, something we need to know more about to interpret incoming results in the early Universe). Or the red one could be very bright and at a much higher redshift – in an expanding Universe, very distant objects can look large although dim (more or less because they were much closer to us when that light was emitted). This means that galaxies of the same actual size will look nearly the same size to us at any distance beyond about 5 billion light-years (although progressively more redshifted and a great deal dimmer with distance).
Some readers may have followed the public discussion about how JWST calibration uncertainties (since it’s so early in what we hope will be a very long mission) may have affected initial attempts to identify the highest-redshift galaxies. In this light, this was a very good project to do so early – for our dust analysis, all that matters is how the brightness in various parts of each galaxy is compared, using uniformity within a single detector and not at all needing to know its absolute sensitivity. To get the absolute sensitivity for colors of the gravitationally lensed galaxy (which we did not initially know we’d need to do), we were able to combine a Sloan Digital Sky Survey spectrum of the elliptical galaxy with the very well-known near-IR properties of giant ellipticals to reduce calibration uncertainties.
As said above, this all comes from 30 minutes’ worth of data using 1/8 of the field of view of JWST’s NIRCam camera. There are a lot more galaxies out there. Watch this space as we try to work out the best way to do JWST Galaxy Zoo.
VV191: from Galaxy Zoo to JWST
Almost 15 years ago, what first attracted me to be involved with Galaxy Zoo was the ability of participants to pick out rare galaxy types, especially silhouetted or overlapping galaxy systems. These highlight the effects of dust in the foreground galaxy on passing light, and offer ways to study the dust which are complementary to, for example, observations in the deep infrared where the dust itself shines, giving off the energy it absorbs from starlight. Visible-light measurements of backlit galaxies show us the dust no matter how cold it might be, where it can hide from IR detection, and at the high resolution available to optical telescopes (including the Hubble Space Telescope) rather than the more modest, wavelength-limited resolution we can achieve at longer wavelength. Better measurements of dust in galaxies affect our understanding of their energy output, stellar content, and even our view of the more distant Universe. Galaxy Zoo volunteers contributed to a catalog of nearly 2000 suitable galaxy pairs from the first iteration of the project, since expanded from Galaxy Zoo 2, GZ Hubble, and the most recent examinations using the Legacy Survey data. We have used this list for number of followup studies – although, truth be told, I have also been distracted by other rare systems found by volunteers (cough, Hanny’s Voorwerp and the Voorwerpjes, for example).
The backlit-galaxy system VV191 was first reported in the Galaxy Zoo forum as a possible galaxy merger, by user Goniners on November 2, 2007. Despite its near-perfect geometry for study of foreground dust, VV191 had eluded our earlier searches because the inner regions, where one can see that this is a superposition of undisturbed galaxies rather a merging galaxy pair, are saturated in prints of the Palomar Sky Survey, which was the best visible-light survey before the Sloan Digital Sky Survey. At the time VV191 was selected for further study, catalogs showed a substantial redshift difference between the two galaxies, which is desirable so the two galaxies are unlikely to be physically interacting with each other, and light from the background galaxy scattered by the dust becomes much fainter. That has been revised by later data which put the redshifts closer; we can’t win them all, though the two galaxies are very symmetric and undisturbed in all our later data.

(Hubble red-light image of VV191, showing silhouetted dust in the foreground spiral arms)
We got a closer look with the STARSMOG project led by colleague Benne Holwerda, which was a Hubble snapshot program – one where short exposures are inserted into gaps in the telescope schedule, much like the Zoo Gems gap-filler project. STARSMOG drew promising overlapping-galaxy pairs from Galaxy Zoo forum posts and the GAMA (Galaxy And Mass Assembly) project. Over several years, it acquired images of 55 galaxy pairs of interest. Among those was VV191, generating a very detailed map of the dust silhouette of the spiral galaxy. This was one of the galaxy pairs analyzed in a project based on the master’s thesis work by Sarah Bradford at the University of Alabama which went into a poster presentation at the January 2017 meeting of the American Astronomical Society in Texas. In fact, I used a low-contrast version of the VV191 image as the poster background. (The poster should still just be legible in this compressed PNG version):
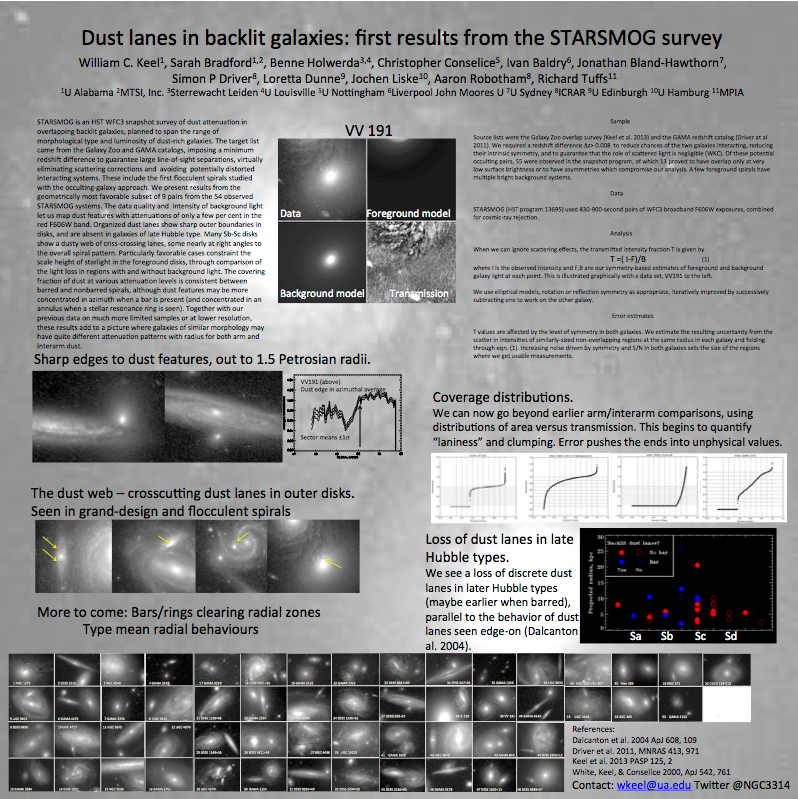
The data quality for VV191 stood out, because the background elliptical galaxy has its brightest region right behind the edge of the dust in the spiral. We then had a 2-dimensional map of how much light gets through the dust in the spiral at the wavelengths included in that single observation. The poster was viewed by my longtime collaborator Rogier Windhorst, who is one of the interdisciplinary scientists with the James Webb Space Telescope (JWST) project. In this capacity, he had an allocation of so-called GTO (guaranteed-time) observations, asked what we could do with JWST. Rogier was struck by these images, and wondered what we could add to the science output with a little bit of JWST observing time.
This led to a plan of tracking the dust signature from ultraviolet to infrared in a single galaxy with a single technique. First Hubble had to do its part with more data, using not only its high resolution but UV sensitivity. We got Hubble images in filters around 2250 and 3360 Angstroms (0.22 and 0.34 microns) , with the short end limited mostly by the elliptical galaxy being so faint in the deeper UV that we couldn’t detect its light well enough in reasonable exposure times. These data have been processed, so we are ready for the next step – JWST. Its near-infrared camera (NIRCAM) will observe this system in four filters from 0.9-4.0 microns wavelength (two at a time since the camera can use short- and long-wavelength channels simultaneously). The wavelengths are chosen to trace the way the dust effects fall off toward longer wavelengths, which is affected both by the sizes of the interstellar dust grains and how strongly they are clumped together. One filter matches one of the wavelengths at which small grains (or indeed large molecules, so-called PAH particles) emit, so we might be able to tell how they correlate with the larger particles blocking most of the light.
Because of the enormous sensitivity of JWST and NIRCAM, each filter is exposed for only 15 minutes to get very high measurement accuracy. (The telescope will probably take longer than that to point to VV191, depending on what it’s doing beforehand). Based on when JWST can view this part of the sky, these observations are most likely to be made between December 2022-March 2023, or May-July of 2023 (we should know more in a couple of weeks when the first year’s observation schedule is released). Watch this space…
Zoo Gems – Hubble does Galaxy Zoo(s)
Since mid-2018, the Hubble Space Telescope has taken occasional short-exposure images, filling what would otherwise be gaps in its schedule, of galaxies in the list from “Gems of the Galaxy Zoos” (otherwise known as Zoo Gems). The Zoo Gems project just passed a milestone, with acceptance of a journal paper describing the project, including how votes from Galaxy Zoo and Radio Galaxy Zoo participants were used to select some of the targeted galaxies, and acting as a sort of theatrical “teaser trailer” for the variety of science results coming from these data. (The preprint of the accepted version is here; once it is in “print”, the Astronomical Journal itself is now open-access as of last month). The journal reviewer really liked the whole project: “The use of the Galaxy Zoo project’s unique ability to spot outliers in galaxy morphology and use this input list for a HST gap filler program is a great use of both the citizen science project and the Hubble Space Telescope” and “I think it is a wonderful program with a clever, useful, and engaging use of both SDSS and Hubble.” (We seldom read statements that glowing in journal reviews).
Zoo Gems got its start in late 2017, when the Space Telescope Science Institute (STScI) asked for potential “gap-filler” projects. Even with what are known as snapshot projects, there remained gaps in Hubble’s schedule long enough to set up and take 10-15 minutes’ worth of high-quality data. We put together a shockingly brief proposal (STScI wanted 2 pages, originally to gauge interest) and were very pleased to find it one of 3 selected (the other two also deal with galaxies. Makes sense to me). We had long thought that the ideal proposal for further observations of some of the rare objects identified in Galaxy Zoo ran along the lines of “Our volunteers have found all these weird galaxies. We need a closer look”. That was essentially what the gap-filler project offered.
We estimated that we could identify 1100 particularly interesting galaxies (where short-exposure Hubble images would teach us something we could foresee) from Galaxy Zoo and Radio Galaxy Zoo. We were allocated 300 by STScI, so some decisions had to be made. A key feature of our project was the wide range of galaxy science goals it could address, so we wanted to keep a broad mix of object types. Some types were rare and had fewer than 10 examples even from Galaxy Zoo, so we started by keeping those. When there were many to choose from, we did what Galaxy Zoo history (and STScI reviewers) suggested – asked for people to vote on which merging galaxies, overlapping galaxies, and so on should go into the final list. This happened in parallel for Galaxy Zoo and Radio Galaxy Zoo objects (the latter largely managed by the late Jean Tate, not the last time we are sadly missing Jean’s contributions as one of the most assiduous volunteers). Even being on that observing list was no guarantee – gap-filler observations are selected more or less at random, taking whichever one (from whichever project’s list) fits in a gap in time and location in the sky. The STScI pilot project suggested that we could eventually expect close to half to be observed; we are now quite close to that, with 146 observations of 299 (one became unworkable due to a change in how guide stars are selected by Hubble). These include a fascinating range of galaxies. From Galaxy Zoo, the list includes Green Pea starburst galaxies, blue elliptical and red spiral galaxies, ongoing mergers, backlit spiral galaxies, galaxies with unusual central bars or rings, galaxy mergers with evidence for the spiral disks surviving the merger or reappearing shortly thereafter, and even a few gravitational lenses. From Radio Galaxy Zoo, we selected sets of emission-line galaxies (“RGZ Green”) and possibly spiral host galaxies of double radio sources (SDRAGNs, in the jargon, and so rare that we’ve more than doubled the known set already). Both kinds of RGZ selection were largely managed by Jean Tate, who we are missing once again. By now, of 300 possible objects, 146 have been successfully observed. One can no longer be observed due to changes in Hubble’s guide-star requirements, and two failed for onboard technical reasons (it was during one of those, a few months ago, that a computer failure sent the telescope into “safe mode”; I have been assured that it was not our fault).

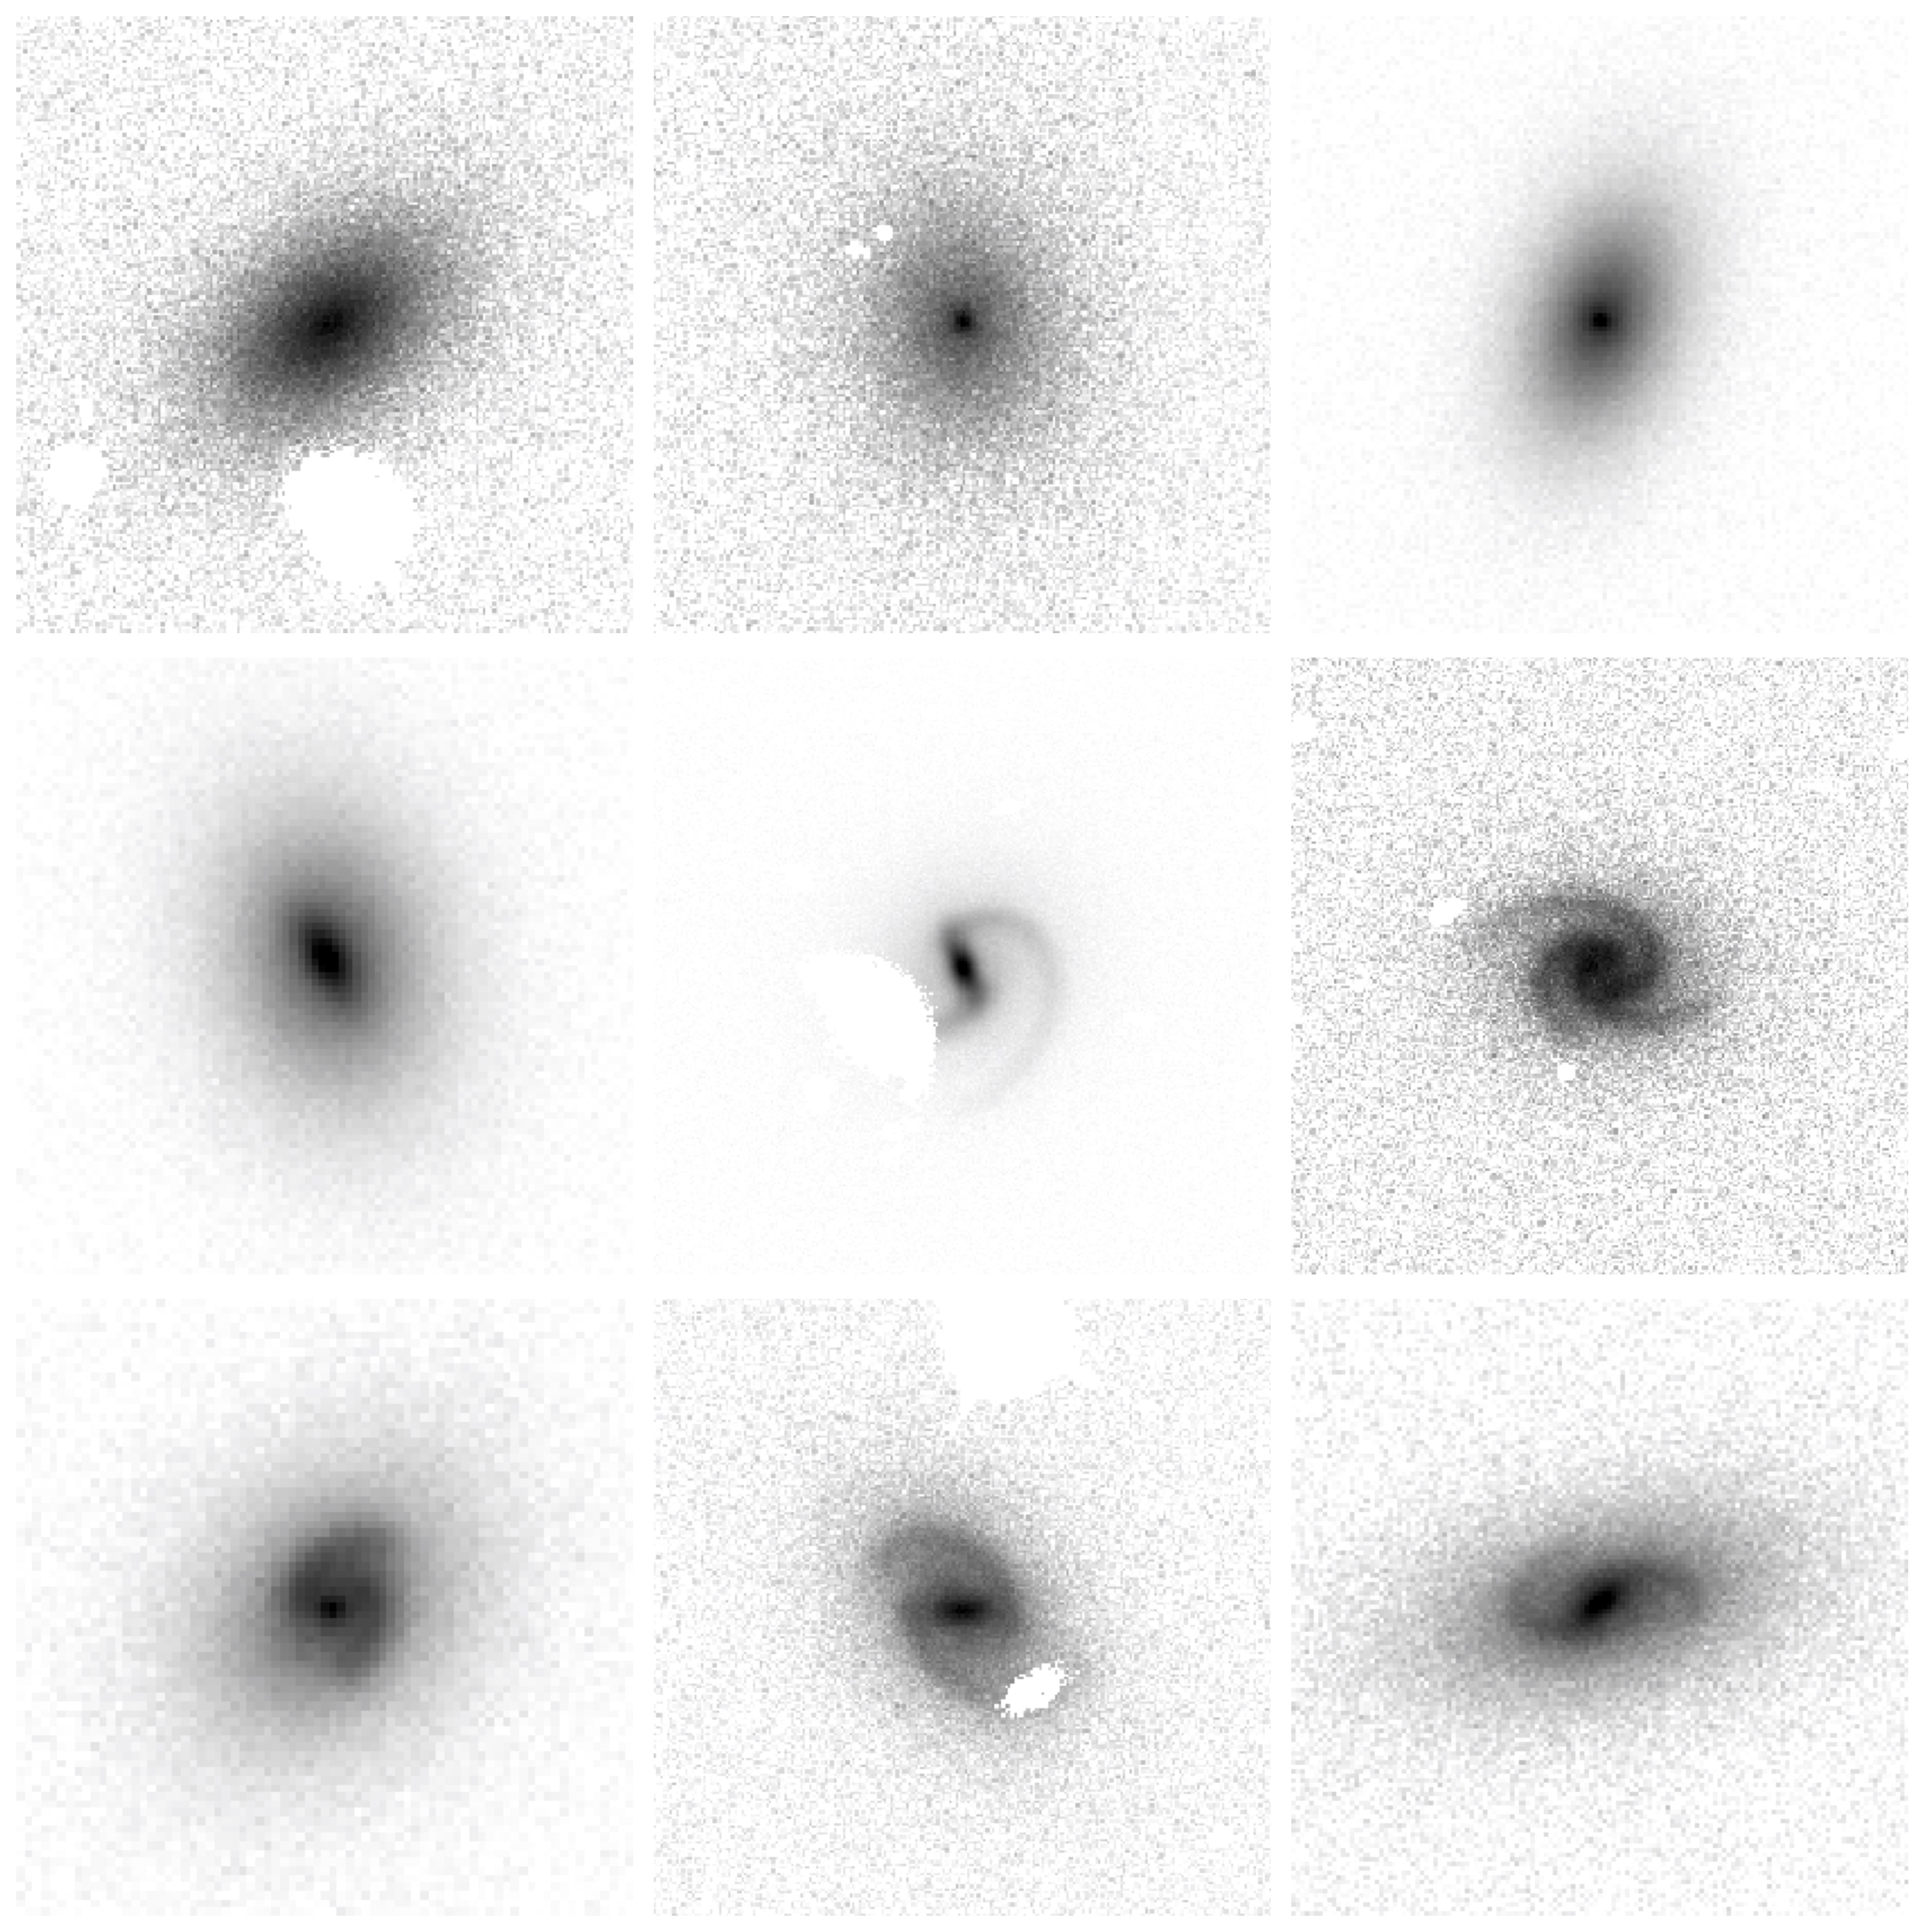
Zoo Gems images show that every blue elliptical galaxy observed shows a tightly wound spiral pattern near the core, so small that it was blurred together in the Sloan Survey images used by Galaxy Zoo, and broadly fitting with the idea that these galaxies result from at least minor mergers bringing gas and dust into a formerly quiet elliptical system.
There is much more to come as harvesting the knowledge from these data continues. Already, a project led by Leonardo Clarke at the University of Minnesota used Zoo Gems images to demonstrate that Green Peas are embedded in redder surroundings, possibly the older stars in the galaxies that host these starbursts. Beyond these, these data can be used to examine the histories of poststarburst galaxies, dynamics and star-formation properties of 3-armed spirals, and nuclear disks and bars – some of these show galaxies-within-galaxies patterns where the central region nearly echoes the structure of the whole galaxy.
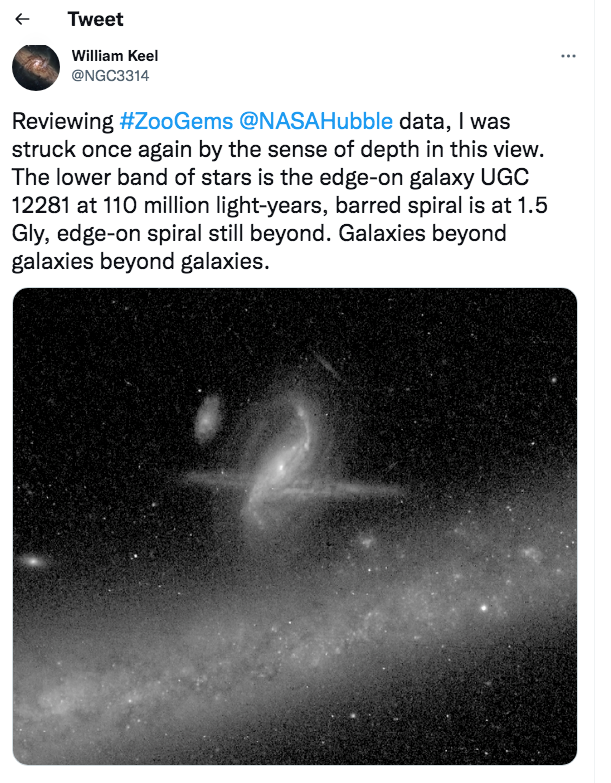
While going through some of the Zoo Gems images to see which should go in various montages in this paper, I considered the multilayer overlapping galaxy system including UGC 12281. It didn’t go into the paper, but the visual sense of deep space in this image is so profound that it became the 2nd most-retweeted thing I’ve sent out in more than 10 years.
In presenting these data, we wanted to make the case for the value of wide-ranging, even short, programs such as this. These gap-filler projects are continuing with Hubble, until STScI starts to have trouble filling the gaps and needs to call for more projects. Premature as it seems, I can’t help musing that someone may eventually work out a low-impact way for the James Webb Space Telescope to make brief stopovers as it slews between long-exposure targets – we have suggestions…
Data from the Zoo Gems project (like the other gap-filler programs, Julianne Dalcanton’s program on Arp peculiar galaxies and the one on SWIFT active galaxies led by Aaron Barth) are immediately public, accessible in the MAST archive under HST program number 15445 (the others are 15444 and 15446). Claude Cornen maintains image galleries for the Zoo Gems, Arp and SWIFT projects in Zoo Gems Talk. Our thanks go to everyone who helped draw attention to these galaxies, or voted in the Zoo Gems object selection.
Presenting results from the Galaxy Builder project
From April 2018 until early this year, Galaxy Builder has collected over 18,000 models of spiral galaxies, built by volunteers. These models were combined and computationally fine-tuned, and the results have been compiled into Lingard et al. 2020 recently accepted for publication in the Astrophysical Journal.
The project asked volunteers to sequentially add components to a galaxy, starting with the galaxy’s disc, then, if one is present, a bulge and a bar, followed by tracing any visible spiral arms. At each stage, light from the corresponding component would be removed until the whole galaxy was accounted for:

Four-panel figure showing the galaxy builder interface, a spiral galaxy is visible in blue, and in each panel another component is added to gradually remove all the visible light from the galaxy.
After collecting 30 volunteer models for each galaxy, we then used Machine Learning techniques to cluster components, and identify a “consensus model”.

Four panel plots showing the clusterd and consensus components for an example galaxy. There is a small amount of scatter in each component, but the clustering has reliably found a good result.
We then used a computer fitting algorithm to fine-tune this model, resulting in a detailed description of the galaxy’s light distribution, which we can use to understand the physical processes occurring inside it!

Five panel plot showing an image of the example galaxy, the fitted model (which matches the real galaxy very well), the difference between the galaxy and model (which is small), and how the consensus components from clustering have changed during fitting (they do not change very much)
We have shown that galaxy model created in this way are just as reliable as simpler models obtained purely through computer fitting (when those simple models are appropriate!), by comparing to other published work and by incorporating a small sample of synthetic galaxies, for which we know the true light profiles:
The nine synthetic galaxy images, each of which look very realistic (but without clumpy star-forming regions). Most have spiral arms, and some have bars.
For most parameters, the difference between the true (x-axis) and volunteer-provided (y-axis) values is tiny. There are some issues with bar “boxyness” and bulge concentration (Sérsic index), primarily due to the computer fitting algorithm not being able to distinguish between different combinations of values:

Scatter plots showing how well parameters are recovered. We see that the method generally does a very good job, but there is a lot of scatter in bulge sersic index and bar boxyness.
Thanks to the added complexity of Galaxy Builder models, we have a much richer source of information for scientists to delve into! We’re excited to share the scientific results we’ve obtained, expect another post in the not-too-distant future (hint, spiral arms are complicated)!
The research team want to send a very warm thank-you to everyone who has participated in this project over the years. Without your efforts we would not have had the chance to do the science we are so passionate about, and we are very excited for the future of the Zooniverse.
Galaxy Builder is currently finished collected classifications, but we still need your classifications in Galaxy Zoo, where we’re working on collecting classifications for images from the DECaLs survey.
This blog was posted on behalf of Tim Lingard for the Galaxy Builder Team. Tim also submitted his PhD thesis based on this work this summer, and is now working as a Data Analyst for the 1715 Labs.
New Paper: Morphological Conformity in Galaxy Zoo
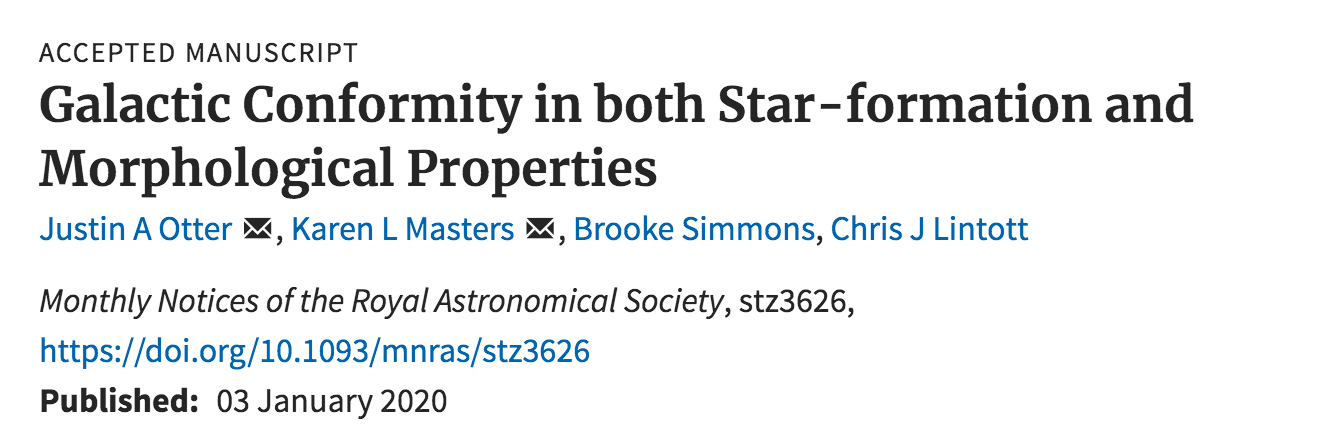
I’m delighted to report on the publication of the below paper, led by Justin Otter, a talented recent graduate of Haverford College who worked with me on this project since their Junior year (September 2017). Link to MNRAS abstract. Link to Arxiv version of accepted paper.
In this paper we used data from Galaxy Zoo 2 to investigate the idea of galactic “conformity” in galaxy morphologies.
What is Galactic Conformity?
Great question. It’s a fairly simple idea actually – the idea that satellite galaxies in groups are more likely to have similar properties to their central galaxy than a random galaxy in the Universe would. The satellites “conform” to the properties of the largest (central) galaxy in the group. So in a group with a star-forming central galaxy would be more likely to have star-forming satellite galaxies than a group with a passive (not star-forming) central galaxy.
What’s New in this Paper?
The new thing here is looking at the star-formation and morphological properties of galaxies separately. So this comes right back to our discovery with the help of all of you at Galaxy Zoo (almost 10 years ago now!) that not all spirals are star-forming (blue), and not all ellipticals are passive (red).
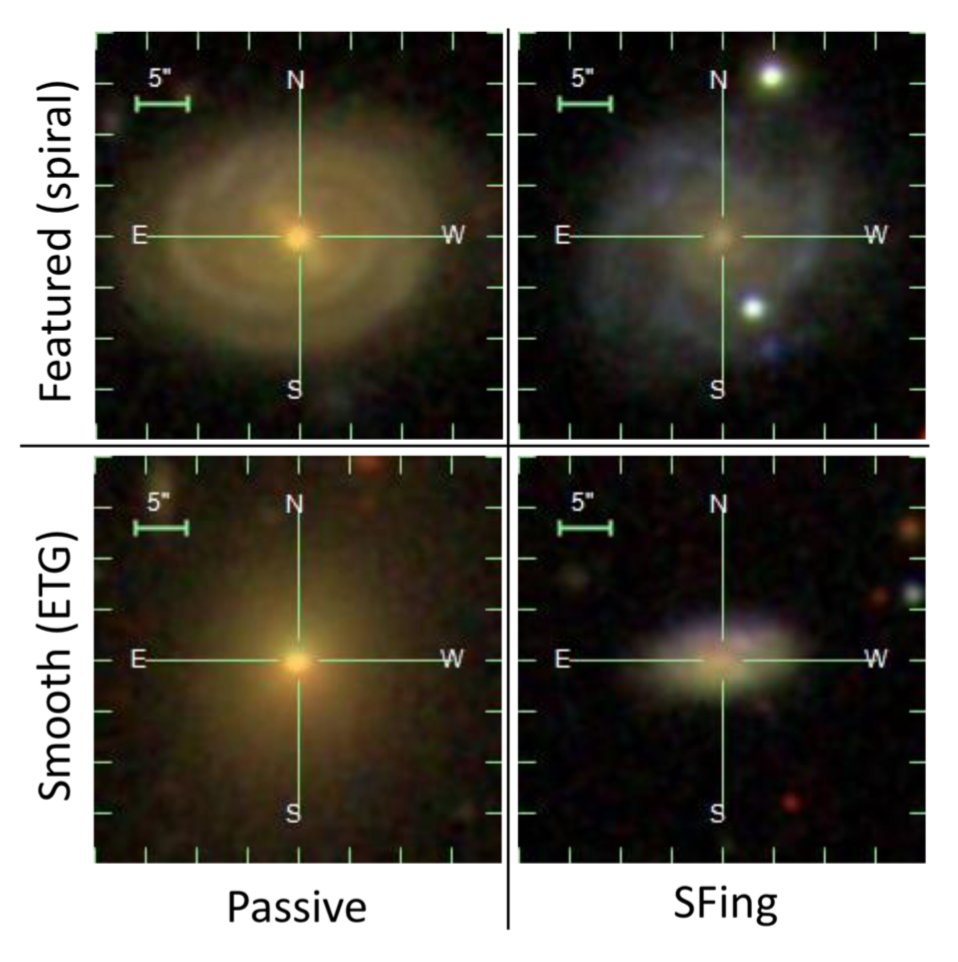
Credit: Otter et al. 2020 (courtesy KLM)
Most studies looking into galactic conformity prior to our work had used star-formation properties to find the signal, and then interpreted the result as if it was a morphological change in the galaxies. This is obviously an over-simplification, and we (well actually it was Brooke who said it first!) wondered if this was driven by star-formation conformity or morphological conformity – and could you find the signal separately for the two.
So what did you find?
Well we found conformity in both star formation and morphological type, but that the signal was stronger in star-formation properties. We also looked at satellites around red/passive and blue/star-forming spiral and elliptical central galaxies separately, and found the signal was largest around the red/passive elliptical central galaxies.
We made the following cartoon version of what we observed (note this is highly exaggerated – in all cases it was a small excess probability, not that all satellites around a central share its properties). All shapes of galaxies showed star-forming conformity, but there was only morphological conformity around ellipticals and blue spirals, suggesting that satellites of red spirals may have turned into ellipticals before the central galaxy

Credit: Justin Otter. A cartoon version of our observations
What does this mean for galaxy evolution?
This all fits quite nicely into the picture where star-formation properties of galaxies can change quite easily, but it’s much harder to change morphology, so as a group evolves and/or accretes more satellites they are likely to change star-forming properties more easilly/quickly than the morphological properties.
So thanks again for the classifications which give us the data to do this work!
In case you’re curious, Justin is currently working as a Fulbright Scholar at the Max Planck Institute for Astronomy in Heidelberg, Germany, and will return to the US for the next academic year to begin his PhD at John’s Hopkins University.
Galaxy Zoo + Galaxy Zoo: 3D
Hi! I’m Tom, and I’m a PhD student at the University of Nottingham, doing some research to try to understand how spiral galaxies have grown and changed over their lifetimes. I’m especially interested in looking at how the spiral arms have been affecting the galaxy as a whole. I’ve recently finished up a paper in MNRAS in which I’ve been demonstrating a couple of new methods using some Galaxy Zoo data.
Amelia has already written [ https://blog.galaxyzoo.org/2018/07/17/finding-bars-in-galaxy-zoo-3d/ ] about how she is using the MaNGA survey [ https://www.sdss.org/surveys/manga/ ] to try to understand what’s happening in bars, so I won’t go into too much detail about this fantastic survey. I’ll just say that it’s part of the Sloan Digital Sky Survey, and for each of its sample of 10,000 galaxies, we have measurements of the spectrum at every position across the face of the galaxy.
MaNGA is really useful for trying to understand how galaxies have grown to their current size, because it is possible to get some sort of estimation of what kinds of stars are present in different locations of the galaxy. It’s a difficult thing to measure, so we can’t say exactly how many of every different type of star is present, but we can at least get a broad picture of the kinds of stellar ages and chemical enrichment (“metallicity”) in the stars. Astronomers have used these kinds of tools to measure the average age or metallicity of stars in different parts of galaxies, and found that in most spirals, the further out you go in the galaxy, the younger the stars are on average. The usual interpretation of this is that bulges tend to have formed first, and the disks have grown in size over time afterwards.

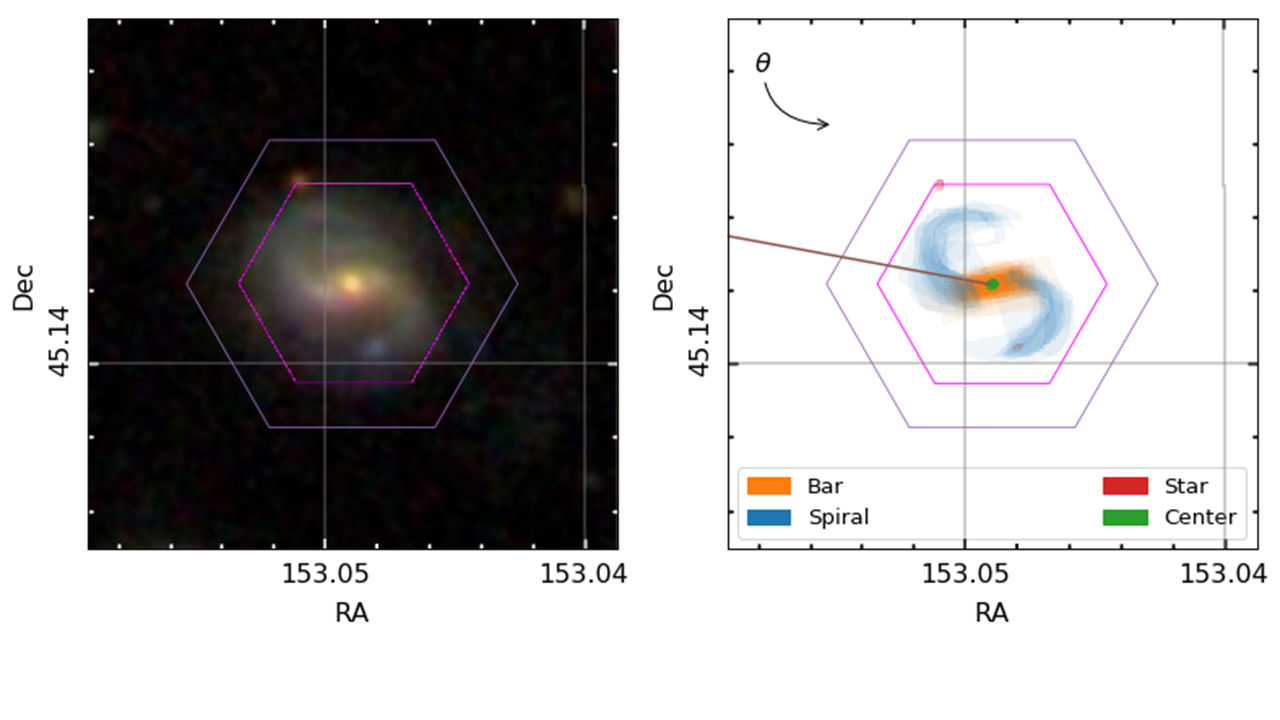
A MaNGA spiral galaxy. We can obtain information about the kinds of stars residing across the hexagonal area, which helps us understand how they’ve grown and evolved.
I’m really interested in trying to push this picture in two ways. Firstly, I’ve been trying to see what we can learn from looking at the general distribution of stars of different ages and metallicities – not just the average properties – at each location in the galaxy. Secondly, I think there is a lot of information that we risk ignoring by only looking at how things change with galactic radius. Spiral arms and the bar aren’t evenly distributed around the galaxy, so if we can see how the stellar properties change as we move around the galaxy, we should be able to measure what effect the spiral arms and bars have on the stars. The goal would be to try to confirm whether the most popular models of the nature of spiral arms and bars are correct or not.
To properly do this, we need to know exactly where the spiral arms and bars are in the MaNGA galaxies, so that we can see how the stars vary in these different regions. Enter Galaxy Zoo: 3D, where volunteers are asked to tell us where the different components are.
An example galaxy in MaNGA, where we’ve managed to split the galaxy into different stellar populations of different ages. Each frame shows where we find stars of a given age in this galaxy, starting from the oldest stars and finishing with the most recently formed stars. The colour denotes the mean metallicity of the stars, shown by the scale at the bottom.
All of this is what my most recent publication is about (read it in full at https://doi.org/10.1093/mnras/stz2204); we’ve shown that by combining the full spatial information available from MaNGA (augmented by Galaxy Zoo:3D) with the full distributions of the ages and metallicities of stars in each location, we can start to see some interesting things in the bar and spiral arms. It’s definitely best illustrated by an animation.
By splitting the age distributions up into different “time-slices”, we can create images of where stars of different ages are located in each of our MaNGA galaxies. Immediately from this one example, it’s obvious that there’s a lot of things going on here.
There are a few features in the animation that we’re not entirely convinced are real, but the main exciting things are that the spiral arms only show up in the youngest stars, and the bar grows and rotates as we move from older to younger stars. The growth of the bar is intriguing; this might be showing us how it formed. The bar changing with angle is even more exciting, and we think it shows us how quickly new-born stars become mixed and “locked” into the bar. The arms show what we should expect; spiral arms are areas of intense star formation, but over time the stars formed there will become mixed around the disk. We measured this effect by looking at what fraction of stars of each age are located in the volunteer-drawn spiral arms from Galaxy Zoo:3D.
This is really interesting, and highlights the power of combining large surveys like MaNGA with crowd-sourced information from the Zooniverse.
The next step is to do these kinds of things with more than just this one galaxy though. I’ve started looking at how these techniques can measure how fast the disks of spiral galaxies grew, using a large sample of spiral galaxies identified by Galaxy Zoo 2 volunteers. I’m also trying to measure how quickly stars get mixed away from spiral arms in different types of spiral galaxies. I have started to find some hints of some exciting results on both of these topics, which I would love to share in a future blog post if you’re interested.
We need volunteers to tell us where the spiral arms and bars are in galaxies, so that we can start to see what makes these regions special.
However, I’m currently limited in the number of galaxies with spiral arm regions identified by Galaxy Zoo:3D volunteers, so it would be really helpful if we could get some more! Understanding what makes spiral structure appear in disky galaxies is one of the unsolved problems in galaxy evolution and formation, and the clues to finding out might well lie in measuring how spiral arms affect the galaxy’s stars. Galaxy Zoo:3D will definitely be able to play a role in this! Help us out at https://www.zooniverse.org/projects/klmasters/galaxy-zoo-3d.
Machine Learning Messaging Experiment
Alongside the new workflow that Galaxy Zoo has just launched (read more in this blog post: https://wp.me/p2mbJY-2tJ), we’re taking the opportunity to work once again with researchers from Ben Gurion University and Microsoft Research to run an experiment which looks at how we can communicate with volunteers. As part of this experiment volunteers classifying galaxies on the new workflow may see short messages about the new machine learning elements. Anyone seeing these messages will be given the option to withdraw from the experiment’; just select the ‘opt out’ button to avoid seeing any further messages.
After the experiment is finished we will publish a debrief blog here describing more of the details and presenting our results.
This messaging experiment has ethics approval from Ben Gurion University (reference: SISE-2019-01) and the University of Oxford (reference: R63818/RE001).
Winding Problems
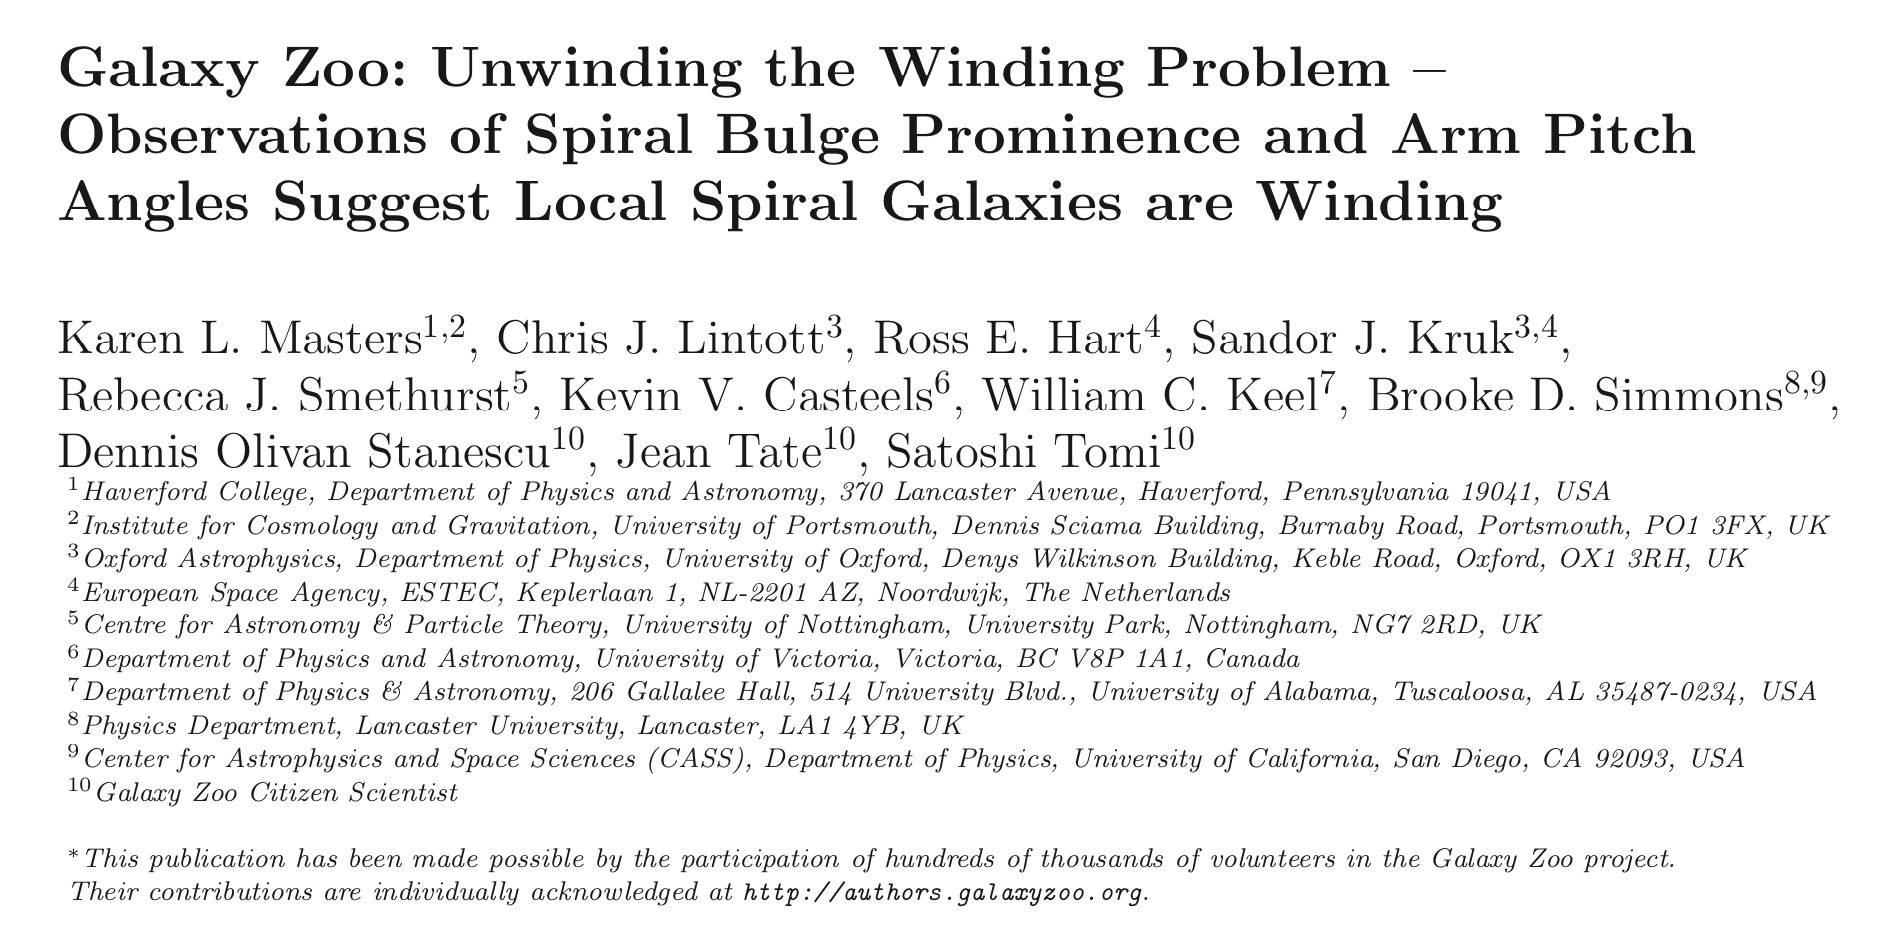
I’m delighted to announce the acceptance of another paper based on your classifications at Galaxy Zoo, “Galaxy Zoo: Unwinding the Winding Problem – Observations of Spiral Bulge Prominence and Arm Pitch Angles Suggest Local Spiral Galaxies are Winding”, which has just been released on the arxiv pre-print server, and appear in the Monthly Notices of the Royal Astronomical Society (MNRAS) soon.
Here’s the title and author page.
This paper has been a long time coming, and is based significantly on the excellent thesis work of Ross Hart (PhD from Nottingham University). Ross wrote about some of his work for the blog previously “How Do Spiral Arms Affect Star Formation“. One of the things Ross’s PhD work showed was just how good your identification of spiral arm winding is, and that allowed us to be confident to use it in this paper.
You might notice the appearance of some of your fellow citizen scientists in this author list. Dennis, Jean and Satoshi provided help via the “Galaxy Zoo Literature Search” call which ended up contributing significantly to the paper.
Our main result is that we do not find any significant correlation between how large the bulges are and how tightly wound the spirals are in Galaxy Zoo spiral galaxies…. this non-detection was a big surprise, because this correlation is discussed in basically all astronomy text books – it forms the basis of the spiral sequence described by Hubble.
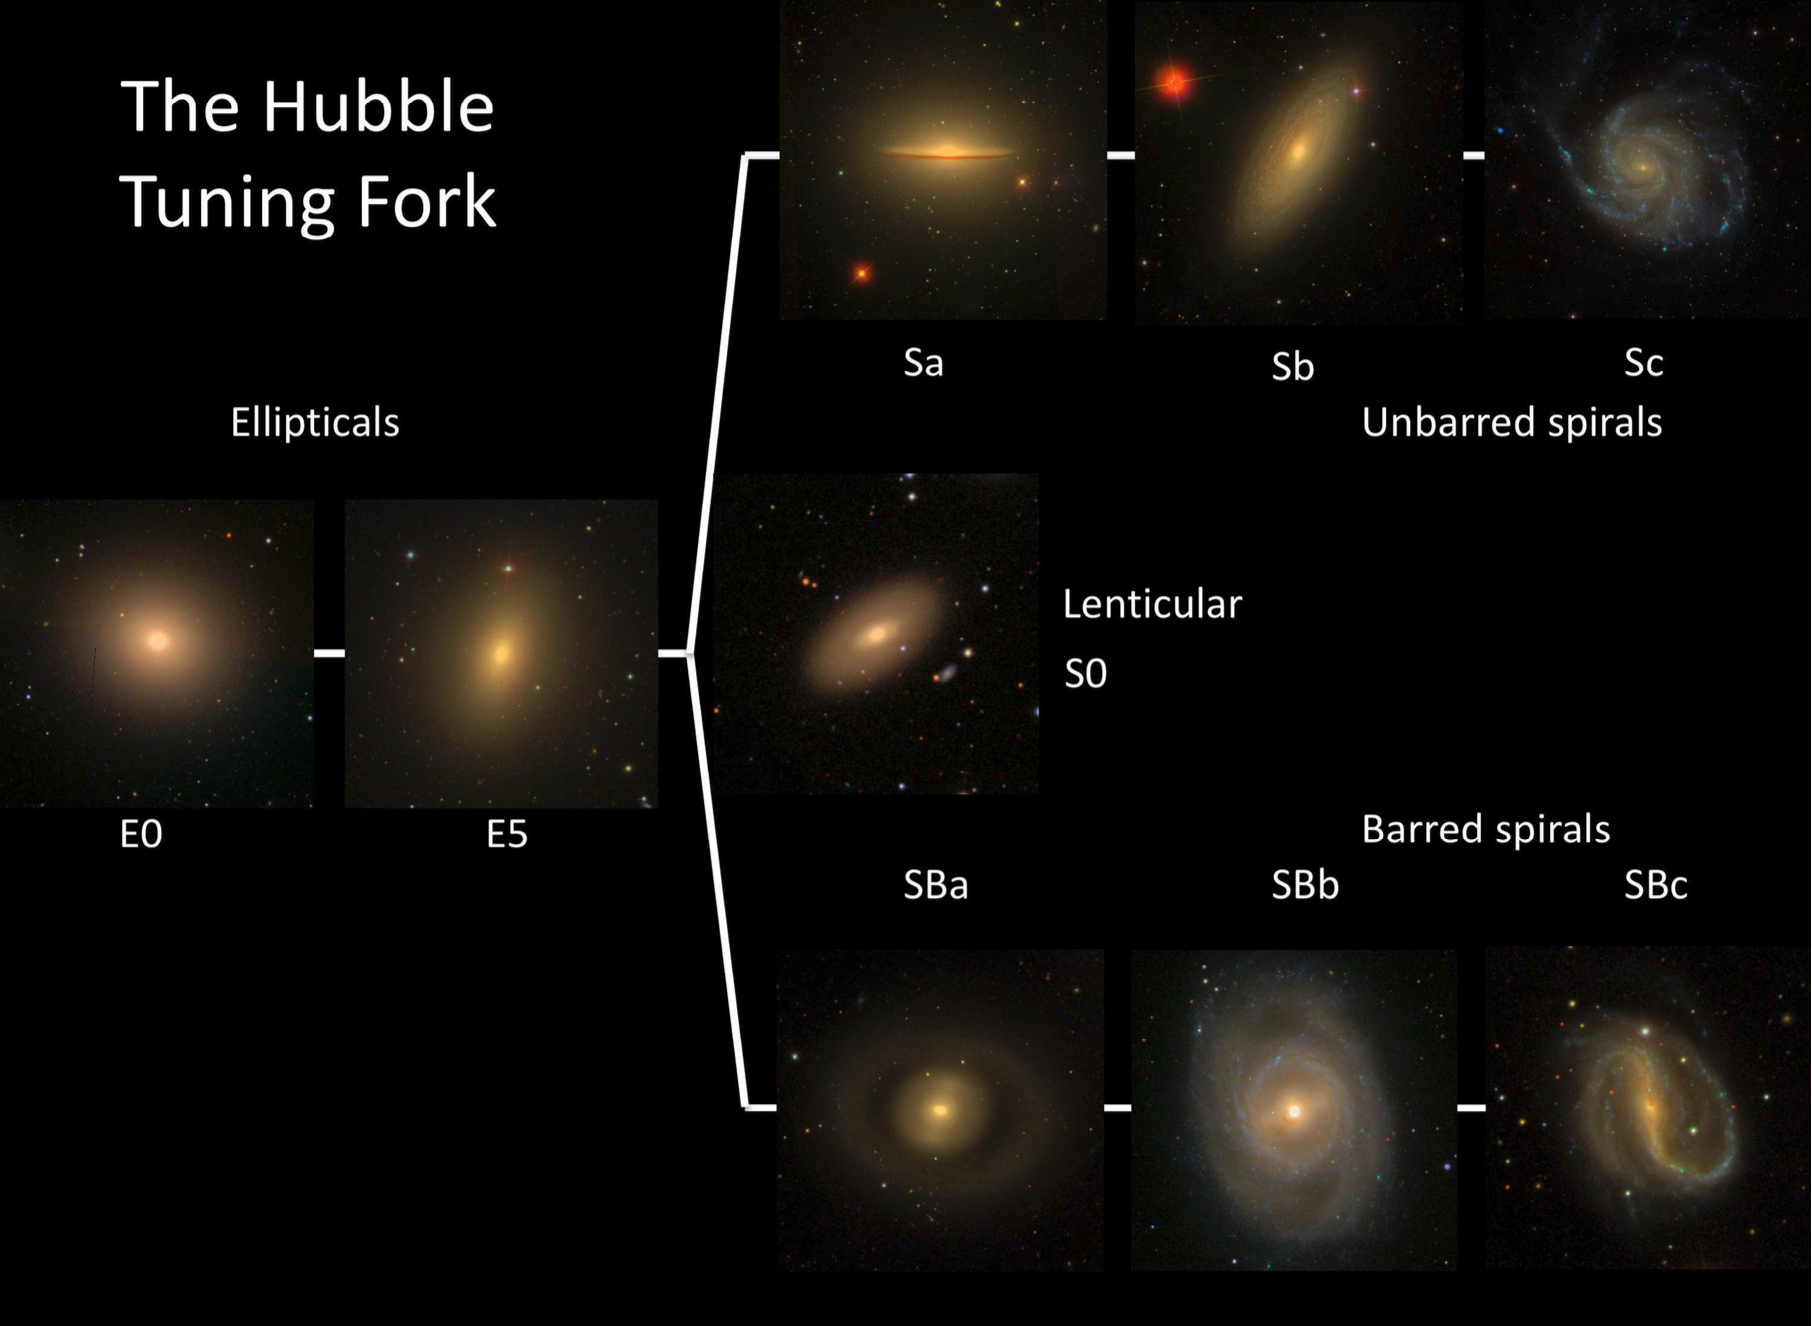
The Hubble Tuning Fork illustrated with SDSS images of nearby galaxies.
Way back in 1927 Hubble wrote (about the spiral nebula he had observed) that: “three [properties] determine positions in the sequence: (1) the relative size of the unresolved nuclear region, (2) the extent to which the arms are unwound (the openness or angle of the spiral), (3) the degree of condensation in the arms.” He goes on to explain that “These three criteria are quite independent, but as an empirical fact of observation they develop in the same direction, and can be treated as various aspects of the same process.” (i.e. Hubble observed them to be correlated).
It’s been known for a long time that there are examples where bulge (or “unresolved nuclear region”) size and arm winding did not agree, but these are usually treated as exceptions. What we’ve shown in this paper, is that for a sample selection which goes beyond just the brightest nearby galaxies Hubble could see, the correlation is not strong at all. Below is an annotated version of our main result figure – each point is a spiral with Galaxy Zoo classifications, and the contours show where there are lots of points. We find spirals all over this plot (except not many with big bulges and loosely wound arms), and the red and blue lines show the lack of any strong trend in either direction.
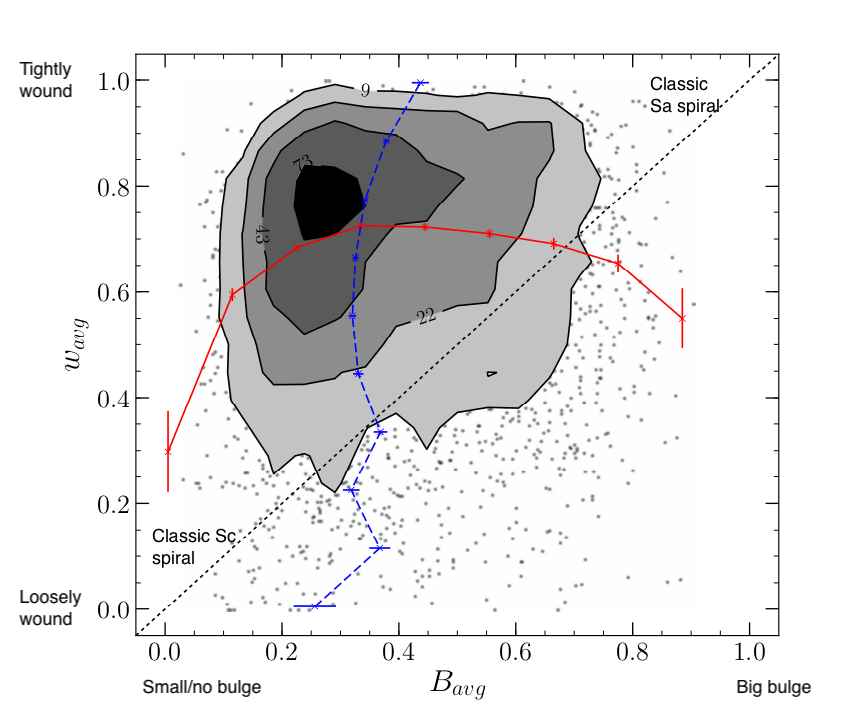
Figure 5 from Masters et al. (2019) paper.
This has significantly implications for how we interpret spiral winding angles, and could be explained by many/most spiral arms winding up over time (at rates which depend on the bulge size) rather than being density waves. We need to do more work to really understand what this observation tells us (which is a great place to be in science!).
We have also known for a while, that bulge size correlates best with modern expert galaxy classification on the Hubble sequence (e.g. when we compared you classifications to the largest samples done in that way). So another point we make in this paper is how different these modern classifications are to the traditional classifications done by Hubble and others. That’s OK – classifications should (and do) shift in science (part of the scientific method is to change on the basis of evidence), but it does mean care needs to be taken to be precise about what is meant by “morphology of galaxies”.
I ended the abstract of the paper with: “It is remarkable that after over 170 years of observations of spiral arms in galaxies our understanding of them remains incomplete.” and I really think that’s a good place to end. Galaxy morphology provides a rich source of data for understanding the physics of galaxies, and thanks to you we have access to the largest and most reliable set of galaxy morphologies ever.
If you’re inspired to keep classifying, head over to the main Galaxy Zoo project, or why not draw a few spiral arms over at Galaxy Zoo: 3D where we’re trying to understand spiral arms in more detail.
Radio Galaxy Zoo studies cluster environment impact on radio galaxy morphologies
The following blogpost is from Avery Garon who led the publication of Radio Galaxy Zoo’s latest science result. Congratulations to Avery and team!
***************
Radio Galaxy Zoo is starting the new year strong, with another paper just accepted for publication. “Radio Galaxy Zoo: The Distortion of Radio Galaxies by Galaxy Clusters” will appear soon in The Astronomical Journal and is available now as a pre-print on the arXiv: https://arxiv.org/abs/1901.05480. This paper was led by University of Minnesota graduate student Avery Garon and investigates several ways in which the shape of a galaxy’s radio emission is affected by and informs us about the environment in which we find the galaxy.
Like the previous RGZ paper, we are looking for how the radio tails extend into the hot plasma that fills galaxy clusters (the intracluster medium, or ICM). This time, we measure how much the two tails deviate from a straight line, marked in the example below by the value θ. The standard model is that the ICM exerts ram pressure on the galaxy as it travels though the cluster and causes its tails to bend away from the direction of motion. However, while individual clusters have been studied in great detail, no one has had a large enough sample of radio galaxies to statistically validate this model. Thanks to RGZ, we were able to observe the effect of ram pressure as a trend for the bending angle θ to increase for galaxies closer to the center of clusters (where the ICM density is higher) and in higher mass clusters (where the galaxies orbit with higher speeds).

Example source RGZ J080641.4+494629. The magenta arrows extend from the host galaxy identified by RGZ users and terminate at the peaks of the radio emission, defining the bending angle θ. The cyan arrow is used to define an orientation for the galaxy with respect to the cluster.
Because ram pressure causes the tails to bend away from the direction in which the galaxy is travelling, we can use this knowledge to map out the kinds of orbits that these galaxies are on. Unlike planetary orbits, which are nearly circular and all in the same plane, the orbits of galaxies in clusters tend to be randomly distributed in orientation and eccentricity. Our sample of bent radio galaxies shows an even more striking result: they are preferentially found in highly radial orbits that plunge through the center of their clusters, which suggests that they are being bent as their orbits take them through the dense central regions.
Finally, we looked at radio galaxies that were far from clusters. Even though the median bending angle is 0° away from clusters, there is still a small fraction of highly bent galaxies out there. By counting the number of optical galaxies that are near the radio galaxies, we observed a sharp increase in the number of companions within a few hundred kiloparsecs of our bent radio galaxies. This suggests that even outside of true cluster environments, we are still observing bending induced by local overdensities in the intergalactic medium.
