
Explaining clustering statistics we use to study the distribution of Galaxy Zoo galaxies
I’ve used some statistical tools to analyze the spatial distribution of Galaxy Zoo galaxies and to see whether we find galaxies with particular classifications in more dense environments or less dense ones. By “environment” I’m referring to the kinds of regions that these galaxies tend to be found: for example, galaxies in dense environments are usually strongly clustered in groups and clusters of many galaxies. In particular, I’ve used what we call “marked correlation functions,” which I’ve found are very sensitive statistics for identifying and quantifying trends between objects and their environments. This is also important from the perspective of models, since we think that massive clumps of dark matter are in the same regions as massive galaxy groups.
We’ve mainly used them in two papers, where we analyzed the environmental dependence of morphology and color and where we analyzed the environmental dependence of barred galaxies. These papers have been described a bit in this post andthis post. We’ve also had other Galaxy Zoo papers about similar subjects, especially this paper by Steven Bamford and this one by Kevin Casteels.
What I loved about these projects is that we obtained impressive results that nobody else had seen before, and it’s all thanks to the many many classifications that the citizen scientists have contributed. These statistics are useful only when one has large catalogs, and that’s exactly what we had in Galaxy Zoo 1 and 2. We have catalogs with visual classifications and type likelihoods that are ten times as large as ones other astronomers have used.
What are these “marked correlation functions”, you ask? Traditional correlation functions tell us about how objects are clustered relative to random clustering, and we usually write this as 1+ ξ. But we have lots of information about these galaxies, more than just their spatial positions. So we can weight the galaxies by a particular property, such as the elliptical galaxy likelihood, and then measure the clustering signal. We usually write this as 1+W. Then the ratio of (1+W)/(1+ξ), which is the marked correlation function M(r), tells us whether galaxies with high values of the weight are more dense or less dense environments on average. And if 1+W=1+ξ, or in other words M=1, then the weight is not correlated with the environment at all.

First, I’ll show you one of our main results from that paper using Galaxy Zoo 1 data. The upper panel shows the clustering of galaxies in the sample we selected, and it’s a function of projected galaxy separation (rp). This is something other people have measured before, and we already knew that galaxies are clustered more than random clustering. But then we weighted the galaxies by the GZ elliptical likelihood (based on the fraction of classifiers identifying the galaxies as ellipticals) and then took the (1+W)/(1+ξ) ratio, which is M(rp), and that’s shown by the red squares in the lower panel. When we use the spiral likelihoods, the blue squares are the result. This means that elliptical galaxies tend to be found in dense environments, since they have a M(rp) ratio that’s greater than 1, and spiral galaxies are in less dense environments than average. When I first ran these measurements, I expected kind of noisy results, but the measurements are very precise and they far exceeded my expectations. Without many visual classifications of every galaxy, this wouldn’t be possible.

Second, using Galaxy Zoo 2 data, we measured the clustering of disc galaxies, and that’s shown in the upper panel of the plot above. Then we weighted the galaxies by their bar likelihoods (based on the fractions of people who classified them as having a stellar bar) and measured the same statistic as before. The result is shown in the lower panel, and it shows that barred disc galaxies tend to be found in denser environments than average disc galaxies! This is a completely new result and had never been seen before. Astronomers had not detected this signal before mainly because their samples were too small, but we were able to do better with the classifications provided by Zooites. We argued that barred galaxies often reside in galaxy groups and that a minor merger or interaction with a neighboring galaxy can trigger disc instabilities that produce bars.
What kinds of science shall we use these great datasets and statistics for next? My next priority with Galaxy Zoo is to develop dark matter halo models of the environmental dependence of galaxy morphology. Our measurements are definitely good enough to tell us how spiral and elliptical morphologies are related to the masses of the dark matter haloes that host the galaxies, and these relations would be an excellent and new way to test models and simulations of galaxy formation. And I’m sure there are many other exciting things we can do too.
…One more thing: if you’re interested, you’re welcome to check out my own blog, where I occasionally write posts about citizen science.
The Green Valley is a Red Herring
Great news everybody! The latest Galaxy Zoo 1 paper has been accepted by MNRAS and has appeared on astro-ph: http://arxiv.org/abs/1402.4814
In this paper, we take a look at the most crucial event in the life of a galaxy: the end of star formation. We often call this process “quenching” and many astrophysicists have slightly different definitions of quenching. Galaxies are the place where cosmic gas condenses and, if it gets cold and dense enough, turns into stars. The resulting stars are what we really see as traditional optical astronomers.
Not all stars shine the same way though: stars much more massive than our sun are very bright and shine in a blue light as they are very hot. They’re also very short-lived. Lower mass stars take a more leisurely pace and don’t shine as bright (they’re not as hot). This is why star-forming galaxies are blue, and quiescent galaxies (or “quenched” galaxies) are red: once star formation stops, the bluest stars die first and aren’t replaced with new ones, so they leave behind only the longer-lived red stars for us to observe as the galaxy passively evolves.

Example images of galaxies classified by you. There are blue, green and red spirals, and blue, green and red ellipticals.

As @penguin galaxy (aka Alice) put it….
Blue Ellipticals & Red Spirals
The received wisdom in galaxy evolution had been that spirals are blue, and ellipticals are red, meaning that spirals form new stars (or rather: convert gas into stars) and ellipticals do not form new stars (they have no gas to convert to stars). Since you’re taking part in Galaxy Zoo, you know that this isn’t entirely true: there are blue (star-forming) ellipticals and red (passive) spirals. It’s those unusual objects that we started Galaxy Zoo for, and in this paper they help us piece together how, why and when galaxies shut down their star formation. You can already conclude from the fact that blue ellipticals and red spirals exist that there is no one-to-one correlation between a galaxy’s morphology and whether or not it’s forming stars.

The colour-mass diagram of galaxies, split by shape. On the right: all galaxies. On the left: just the ellipticals (or early-types) on top and just the spirals (or late-types) on the bottom. On the x-axis is the galaxy mass. On the y-axis is galaxy colour. Bottom is blue (young stars) and top is red (no young stars).
Blue, Red and…. Green?
A few years back, astronomers noticed that not all galaxies are either blue and star forming or red and dead. There was a smaller population of galaxies in between those two, which they termed the “green valley” (the origin of the term is rather interesting and we talk about it in this Google+ hangout). So how do these “green” galaxies fit in? The natural conclusion was that these “in between” galaxies are the ones who are in the process of shutting down their star formation. They’re the galaxies which are in the process of quenching. Their star formation rate is dropping, which is why they have fewer and fewer young blue stars. With time, star formation should cease entirely and galaxies would become red and dead.
The Green Valley is a Red Herring
Ok, why is this green valley a red herring you ask? Simple: the green valley galaxies aren’t a single population of similar galaxies, but rather two completely different populations doing completely different things! And what’s the biggest evidence that this is the case? Some of them are “green spirals” and others are “green ellipticals”! (Ok, you probably saw that coming from a mile away).
So, we have both green spirals and green ellipticals. First: how do we know they must be doing very different things? If you look at the colour-mass diagram of only spirals and only ellipticals, we start to get some hints. Most ellipticals are red. A small number are blue, and a small number are green. If the blue ellipticals turn green and then red, they must do so quickly, or there would be far more green ellipticals. There would be a traffic jam in the green valley. So we suspect that quenching – the end of star formation – in ellipticals happens quickly.
In the case of spirals, we see lots of blue ones, quite a few green one and then red ones (Karen Masters has written several important Galaxy Zoo papers about these red spirals). If spirals slowly turn red, you’d expect them to start bunching up in the middle: the green “valley” which is revealed to be no such thing amongst spirals.

We can time how fast a galaxy quenches. On the x-axis is the optical colour, dominated by young-ish stars, while on the y-axis is a UV colour, dominated by the youngest, most short-lived stars.
Galaxy Quenching time scales
We can confirm this difference in quenching time scales by looking at the ultraviolet and optical colours of spirals and ellipticals in the green valley. What we see is that spirals start becoming redder in optical colours as their star formation rate goes down, but they are still blue in the ultraviolet. Why? Because they are still forming at least some baby stars and they are extremely bright and so blue that they emit a LOT of ultraviolet light. So even as the overall population of young stars declines, the galaxy is still blue in the UV.
Ellipticals, on the other hand, are much redder in the UV. This is because their star formation rate isn’t dropping slowly over time like the spirals, but rather goes to zero in a very short time. So, as the stellar populations age and become redder, NO new baby stars are added and the UV colour goes red.
It’s all about gas
Galaxies form stars because they have gas. This gas comes in from their cosmological surroundings, cools down into a disk and then turns into stars. Galaxies thus have a cosmological supply and a reservoir of gas (the disk). We also know observationally that gas turns into stars according to a specific recipe, the Schmidt-Kennicutt law. Basically that law says that in any dynamical time (the characteristic time scale of the gas disk), a small fraction (around 2%) of that gas turns into stars. Star formation is a rather inefficient process. With this in mind, we can explain the behaviour of ellipticals and spirals in terms of what happens to their gas.

A cartoon version of our picture of how spiral galaxies shut down their star formation.
Spirals are like Zombies
Spirals quench their star formation slowly over maybe a billion years or more. This can be explained by simply shutting off the cosmological supply of gas. The spiral is still left with its gas reservoir in the disk to form stars with. As time goes on, more and more of the gas is used up, and the star formation rate drops. Eventually, almost no gas is left and the originally blue spiral bursting with blue young stars has fewer and fewer young stars and so turns green and eventually red. That means spirals are a bit like zombies. Something shuts off their supply of gas. They’re already dead. But they have their gas reservoir, so they keep moving, moving not knowing that they’re already doomed.

A cartoon version of how we think ellipticals shut down their star formation.
Ellipticals life fast, die young
The ellipticals on the other hand quench their star formation really fast. That means it’s not enough to just shut off the gas supply, you also have to remove the gas reservoir in the galaxy. How do you do that? We’re not really sure, but it’s suspicious that most blue ellipticals look like they recently experienced a major galaxy merger. There are also hints that their black holes are feeding, so it’s possible an energetic outburst from their central black holes heated and ejected their gas reservoir in a short episode. But we don’t know for sure…
So that’s the general summary for the paper. Got questions? Ping me on twitter at @kevinschawinski
Green Valley: The Town Too Good To Die

I swear we are consistently trying to keep our live hangouts to about 15 minutes. We have so far failed at keeping to time, but hopefully also succeeded in the sense that we only run over because there’s so much to discuss.
We had a number of good questions from Twitter, Facebook and the blog about various types of galaxies — from red spirals to green peas and blue ellipticals — and I rather arbitrarily decided this was an indication that our hangout should have a color theme. That is, what exactly does “color” mean in the context of astronomy? What is going on physically when a galaxy is one color versus another, or has multiple colors? Is color information always telling us the same thing? We tried to address all those questions, as well as show some examples of different galaxies in the above queried categories. As a bonus, we learned how galaxy colors are related to the town my grandparents retired to. (This post’s title is a quote from the Green Valley Chamber of Commerce’s official website.) That was as much a surprise to me as it was to the viewers!
We also talked about what’s currently going on in Galaxy Zoo behind the scenes. Earlier today, Kyle sent around a really nice draft of the Galaxy Zoo 2 data paper for the team to read and comment on (you’ll have to watch the video to get a sneak peek at some of the figures).
And it’s that time again: Hubble Space Telescope proposals are due in about a week. We talked about the proposal process from concept to submission to review, discussing both specifics of certain telescopes and the general practices that (we hope) help lead to a successful proposal. Here’s a hint: it may not be what you think!
We covered all this and some other questions, too. No wonder we ran a little over…
And here’s the podcast version:

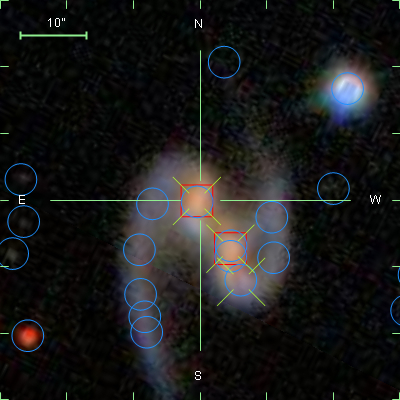
Is it a triple merger? A double overlap? A hybrid?

A blue(ish) and red spiral.

A red and blue elliptical.

A tiny green pea galaxy, and zoomed-in at right.
Live Chat: Galactic Rings, Secular Evolution and The Good Old Days

It’s amazing what happens when you actually publicize your live chat in advance. We got so many questions, we decided to spend the entire chat just discussing them, and we still didn’t finish!
Partly that’s because we had a surprise guest appearance from the esteemed Ron Buta, who came in just after we had talked about some of the details covered in his Galaxy Morphology article (his Figure 3 is shown in the image). Ron worked with Gérard de Vaucouleurs — aka GdV — and told us some amusing stories about trying to take photometric* observations of dwarf galaxies, and about how GdV’s wife used to disagree with his morphologies, at one point looking over his shoulder and proclaiming, “no, there’s no ring”. I rather liked that story as it’s a reminder that anyone can spot patterns in galaxy images.
We’ll try to answer those questions on the previous blog post that we didn’t get to there — but in the meantime, here’s the video:
Left to right: Ron Buta & Bill Keel, Karen Masters, Kevin Schawinski, Brooke Simmons (me). Toward the end (not shown on the thumbnail), Kyle Willett arrived just in time to answer a question about the status of the latest Galaxy Zoo classification set.
We made ample use of the jargon gong on ourselves, but we may not have managed to define all the terms Ron used. We’ll try to do so in this post — if we’ve missed any please say so in the comments!
*photometry = precise quantitative measurements of the brightness of objects in the sky. You need very good observing conditions to take photometric measurements, which many (but not all) astronomical projects require.
Update: Now in podcast form:
New Dataset from Galaxy Zoo!
We’ve posted a new data set here: http://data.galaxyzoo.org/#agn
This sample is presented in the Galaxy Zoo 1 paper on AGN host galaxies (Schawinski et al., 2010, ApJ, 711, 284). It is a volume-limited sample of galaxies (0.02 < z < 0.05, M_z < -19.5 AB) with emission line classifications, stellar masses, velocity dispersions and GZ1 morphological classifications. When using this sample, please cite Schawinski et al. 2010 and Lintott et al. 2008, 2011.
Download here: http://galaxy-zoo-1.s3.amazonaws.com/schawinski_GZ_2010_catalogue.fits.gz
Column definitions are as follows:
- OBJID – SDSS object ID
- RA, DEC – RA and Dec in J2000
- REDSHIFT – SDSS spectroscopic redshift
- GZ1_MORPHOLOGY – Galaxy Zoo 1 morphology according to the Land et al. (2008) “clean” criterion. GZ_morphology is an integer where 1-early type, 4-late type, 0-indeterminate, 3-merger
- BPT_CLASS – 0-no emission lines, 1-SF, 2-Composite, 3-Seyfert and 4-LINER (see Schawinski et al. 2010 for details)
- U,G,R,I,Z -SDSS modelMag extinction corrected but not k-corrected
- SIGMA, SIGMA_ERR – Stellar velocity dispersion measured using GANDALF
- LOG_MSTELLAR – log of stellar mass
- L_O3 – Extinction-corrected [OIII] luminosity
Seeing mergers in a different light
Hello,
My name is Alfredo and I’m a Ph.D. student at Imperial College London. I’ve been asked to write a blog about how we take an idea and turn it into a paper, showing exactly what the man behind the scene does.
I’m working with galaxy mergers so the field from which we are going to pluck our idea has to be that one. Merger properties have been described extremely well by the Galaxy Zoo team, which used the Sloan Digital Sky Survey optical data so we thought it might be interesting looking at the GZ merger catalogue in different wavelengths, specifically in the infrared.
You can study pretty much every object in the infrared because what we call heat is simply the emission of infrared light. If you can measure it’s temperature then it radiates in the infrared. In astronomy infrared radiation allow us to see objects that are not too bright in the visible spectrum (cold stars, gas clouds), to probe regions that are obscure in the optical and to explore the early Universe. Our project will use the infrared fluxes to extrapolate interesting characteristics, mostly to do with the star formation process of the galaxies.

In the past, a huge number of papers have shown that galaxies which were very bright in the infrared ( called LIRGs – Luminous infrared galaxies, U(ltra)LIRGs and H(yper)LIRGs) were mostly mergers or post-mergers. We are going in the opposite direction: since we have a strong visually selected merger catalogue, thanks to your hard work, we can now see what’s the real connection between mergers and warm galaxies.
GZ1 used for the fractions of early-types in clusters
We’re happy to report that we have once again used your (now public) GZ1 classifications to find an interesting result.
We use the classifications in a study we just submitted to MNRAS (or see the arXiv entry for a copy) looking at the observed fractions of early-type galaxies (and spiral galaxies), in groups and clusters of galaxies.
Recent work (De Lucia et al. (2011), which posted to the arxiv in September), used sophisticated semi
analytic models to determine the properties of galaxies found in massive
clusters in the Millennium Simulation. They identified elliptical galaxies
(or more accurately early-type galaxies) in the simulation, and found that the fraction these
galaxies, remained constant with cluster halo mass, over the range 10^14 to
10^14.8 solar masses. They compared their results with previous
observational studies which each contained less than 100 clusters.
With GZ1 we realised we could put together a much larger sample. We
used galaxies with GZ1 classifications, cross matched with cluster and
group catalogues, to compare the above results with almost 10 thousand
clusters. We found that the fraction of early-type galaxies is indeed
constant with cluster mass (see the included figure), and over a much larger range of 10^13 to 10^15
solar masses (with covers small groups of galaxies to rich clusters), than previously studied. We also found the well known result (to astronomers) that outside of groups and clusters, the fraction of early-type galaxies is
lower than inside of groups and clusters.

Plot showing the fraction of early-type galaxies (red lines) as a function of halo mass. We used two different halo mass catalogues, and the agreement between them is excellent. We also examine the fraction of spiral galaxies with halo mass (blue lines)
This work suggests that galaxies change from spiral to early-type when individual
galaxies join together to form small groups of galaxies, but that going from groups to rich clusters does not significantly change the morphologies of galaxies.
Without the GZ1 results at our finger-tips, this work, which was devised,
implemented, and written up in less than 2 months, would have taken much
longer to complete.
Thanks again for making the Zoo such a wealth of information,
Ben Hoyle (on behalf of Karen Masters, Bob Nichol, Steven Bamford, and Raul Jimenez)
AAS 218: Black Hole Growth and Host Galaxy Morphology
Following Karen’s AAS 218 roundup, here is my talk from the Galaxy Zoo special session:

You can get the whole talk as a PDF or as a Quicktime movie.
The Science Behind Classifying Simulated AGN
Hello Zooites,
This is a dual-purpose post: first, to introduce myself. My name is Brooke Simmons. I’m a graduate student in the final year of my PhD at Yale, and my scientific focus is on examining the co-evolution of supermassive black holes (SMBHs) and their host galaxies. My specialization is in the morphology of galaxies hosting active SMBHs, so naturally I’ve been very intrigued by the Galaxy Zoo project ever since it started. And I’m very impressed by the work that you all do. So when Chris and Carie asked me about simulating some AGN as part of the Galaxy Zoo project, I jumped at the chance. I have pretty extensive experience simulating AGN and host galaxies — more on that in a moment — and I was very excited to have the opportunity to extend that kind of science into the realm of Galaxy Zoo.
I heard later that there were some issues regarding the simulations, and that’s the other purpose of this post. I’d like to try and explain the reasons I think the simulations are important to the science being done in the Zooniverse, and clarify some of the details, if possible. I’m quite new here and I realize that there are many levels of experience reflected in the Zooite population, from newcomers to the field to those who are experienced at following up on objects of interest and searching the scientific literature. So I hope, in giving this science background, that those of you who have heard it before will bear with me, and those of you who haven’t (or, well, anyone really) will feel free to ask any questions that might come up.
In the field of galaxy evolution, it’s now clear there is some sort of mechanism that affects both the evolution of galaxies and the growth of their central black holes together, but we don’t really understand what it is (or what they are) — yet. In terms of scale, it’s rather incredible that they are connected at all. We may call them supermassive black holes, but they’re generally a small percentage of the total galaxy mass, and they’re absolutely tiny when compared to the size of the galaxy. I like to describe it in terms of a football match: the packed, somewhat chaotic crowd in the stands shouldn’t know or care what the ant right in the middle of the playing field is doing. Nor should the ant particularly be aware of how the cheering crowd is shifting and reacting. Yet it is well established that the crowd (the stars in the galaxy) and the ant (the central black hole) somehow know about each other.
How does this work? What forces (or combination of phenomena) act to influence both the single, massive point at the center of a galaxy and the billions of stars around it? Is it a one-sided influence, or is it a feedback mechanism that ends up causing them both to evolve in sync? The co-evolution of galaxies and black holes is one of the fundamental topics of galaxy evolution, and many questions remain unanswered. In order to try to answer these questions, we observe both central black holes and the galaxies that host them, at a variety of redshifts/lookback times, so that we can see how these two things evolve.
However, for all but very local galaxies, it’s very difficult to see a signal from a galaxy’s central SMBH amid all the stellar light from the galaxy. So, we turn to that subset of SMBHs that are actively accreting matter, which in turn heats up and discharges enormous amounts of energy as it falls into the gravitational potential of the black hole. Those, which we call active galactic nuclei (AGN), we can see much more easily, and out to very high redshift. They radiate across the whole of the electromagnetic spectrum, from radio to gamma rays. At optical wavelengths they are sometimes buried in dust and gas, which obscures their light and means they look identical to so-called “inactive” galaxies. But in other cases, the AGN are unobscured or only partially obscured, and then they are extremely bright — so much so that they can far outshine the rest of the galaxy.
So, looking at the central SMBHs of inactive galaxies is impossible for very distant galaxies, because the host galaxy swamps the dim signatures of the black hole. But looking at the hosts of active black holes (AGN) can be difficult too, because the AGN signal can swamp the host galaxy. It’s not impossible to disentangle the two in order to examine the host galaxy separately from the AGN, but it adds a level of complexity to the process. Morphological fitting programs executed by a computer do a reasonable job, but actually — as you all know — the human brain is excellent at this kind of pattern recognition. You all can clearly tell the difference between a host galaxy and its central AGN, to the point where many of you have been following up your classified objects and identifying spectral features of AGN. That is so impressive!
In fact, what you collectively do is new and different and in many ways a significant improvement over “parametric” methods that use automated computer codes to fit galaxy morphology models to images. Those have their uses, too, of course, but you all pick up nuances that parametric methods simply miss. And part of what that means is that the data we have on how the presence of an AGN (bright or faint) affects morphological classification may or may not apply to your work. Within the automatic fitting programs, there are subtle effects that can occur. For example, a small galaxy bulge may look the same to a parametric fitting routine as a central AGN, with the consequence that it may think it has found one when in fact it’s the other. Or, when both a small bulge and a central AGN are present, a computer code to fit the morphology might be more uncertain about how much luminosity goes with each component. I know all this because it has now been studied for automated/parametric morphology fitting codes:
- Sànchez et al. (2004) is mainly a data analysis paper on AGN host galaxies, but contains a subsection on simulations;
- Simmons & Urry (2008) is a paper describing two sets of AGN host simulations that combine for over 50,000 simulated galaxies (yes, that Simmons is me);
- Gabor et al. (2009) is another data analysis paper that contains AGN host simulations; and
- Pierce et al. (2010) is a dedicated simulations paper with a smaller sample than Simmons & Urry, but which also extends the analysis to host galaxy colors.
All of this analysis was undertaken with Hubble data, much like the images of simulated AGN that have been incorporated into Galaxy Zoo. These are small effects that only impact a fraction of classifications, but the simulations are crucial because they both let us know the limits of our classification methods and, just as importantly, enable us to quantify precisely how confident we are that the classifications are accurate. The parametric methods are very accurate, but it is absolutely essential that we find out just how the presence of an AGN affects classification in this setting, which is of course quite different.
It’s always exciting for a scientist to say “I don’t know the answer, but I know how we can find out.” And in this case, that means extending the simulations that we have done to the case of visual classification. There are a few ways to simulate AGN, but the key process is to create a situation where the analysis takes place on a known quantity so that you can compare what you know to what the analysis finds. In this case (which is similar in method to the first set of simulations in Simmons & Urry), that means:
- Start with a set of galaxies for which we know the initial “answer,” i.e., the morphology;
- Add a simulated signal from a central SMBH, using a wide range of luminosity ratios between galaxy and SMBH, and a range of AGN colors;
- Repeat the classification process in exactly the same way as for the initial set of galaxies, to see if the answers change.
Now, it may be that the answers change in some subtle way, as they do when the morphological analysis is done by a computer. If that’s the case, then the analysis quantifies that effect so that we can understand it and account for it. Or, it may be that you see right through it — and if so, that’s great! If you look at a galaxy with an AGN and say, “of course I can tell that that galaxy has an AGN in it, and I can still classify the galaxy in the same way,” fantastic. It potentially means you all are doing better science than a traditional parametric analysis in yet another way. Either way, the answer is very useful.
I know this post is already quite long, but I think it’s important to make one other point about the simulations. When you’re simulating something like this to understand the effects of a new feature on analysis you think you understand very well, it’s very important to try to push the limits of that analysis. In this case, that means simulating AGN that are both so faint that there’s pretty much no way you could possibly see them in their host galaxies, and so bright that they will be blindingly obvious to anyone paying attention.
And you all are most definitely paying attention. In reading comments on other blog posts, I saw that some Zooites were displeased with the way the very brightest simulated AGN looked strange, and even artificial. And I know there were some communication issues regarding the release of the simulations; for that I apologize. Actually, though, knowing which objects you found odd is a part of the science, too. Simulations like this can be used not only to understand the science of determining galaxy morphology, but also to understand the science of separating the AGN itself for later analysis — as I said earlier, both are needed to understand the co-evolution of black holes and galaxies. So questions like, “when does the AGN get lost in the galaxy?” and “when does the AGN totally overtake the galaxy?” are vital. It is also definitely the case that we were pushing the limits of not just the classification, but also of the software that is used to make the simulated AGN. That’s why the very brightest of them look a bit… weird. I do think the science is still possible even if it’s clear that it’s a simulation on first glance, and I really appreciate your patience with both me and the software on that issue.
By the way, I have a feeling you all are going to turn out to be considerably better at classifying galaxies with AGN in them than the computer is, but of course that’s just my hypothesis — it’s important to actually go through the process of classifying simulated galaxies. That way, when someone comes up to us and says, but how do you know all these citizen scientists are really that accurate? AGN can have a subtle effect on the fitted morphologies of galaxies, after all, we can say, “but we do know they’re that accurate — and here’s how we know.”
Thanks all for reading — if you got this far, that probably deserves an award in itself — and please feel free to ask any questions you might have. If you have a concern that you feel I didn’t address, please let me know that as well. I would very much appreciate your input!
The Hubble Tuning Fork
The gold standard for galaxy classification among professional astronomers is of course the Hubble classification. With a few minor modifications, this classification has stood in place for almost 90 years. A description of the scheme which Hubble calls “a detailed formulation of a preliminary classification presented in an earlier paper” (an observatory circular published in 1922) can be found in his 1926 paper “Extragalactic Nebulae” which is pretty fun to have a look at.
Hubble’s classification is often depicted in a diagram – something which is probably familiar to everyone who has taken an introductory astronomy course. Astronomers call this diagram the “Hubble Tuning Fork”. I have been meaning for a while to make a new version of the Hubble tuning fork based on the type of images which were used in Galaxy Zoo 1 and 2 (OK the prettiest ones I could find – these are not typical at all). Anyway here it is. The Hubble Tuning Fork as seen in colour by the Sloan Digital Sky Survey:

I should say that my choice of galaxies for the sequence owes a lot of credit to an excellent Figure illustrating galaxy morphologies in colour SDSS images which can be found in this article on Galaxy Morphology (arXiV link) written by Ron Buta from Alabama (Figure 48). I strongly recommend that article if you’re looking for a thorough history of galaxy morphology.
Inspired by the “Create a Hubble Tuning Fork Diagram” activity provided by the Las Cumbres Observatory, I also provide below a blank version which you can fill in with your favourite Galaxy Zoo galaxies should you want to. I have to say though, the Las Cumbres version of the activity looks even more fun as they also talk you through how to make your own colour images of the galaxies to put on the diagram.

Anyway I hope you like my new version of the diagram as much as I do. Thanks for reading, Karen.
