
Investigating How Type of Galactic Bar Impacts Bar Quenching
We are happy to announce the acceptance of the latest science team paper making use of Galaxy Zoo classifications (the image below is a link to the paper). Also see this list of all Galaxy Zoo Science Team Publications (which is mostly complete, usually!).
This work was led by (at the time) undergraduate student Petra Mengistu (since Fall 2024 in the PhD Program at UCSC). Petra started this work as an undergraduate, spending the summer of 2023 working at Oxford with the Galaxy Zoo science team there, and then returning to Haverford to continue the work for her undergraduate senior thesis. I’m writing this as a very proud (former) undergraduate supervisor today.
As the”Part II” in the title suggests, this work is a follow-on from previous work. Tobias Geron already wrote in detail about the first paper on the blog Slow Strong Bars Affect Their Hosts the Most which has a lot of the background needed to understand this follow-on result.
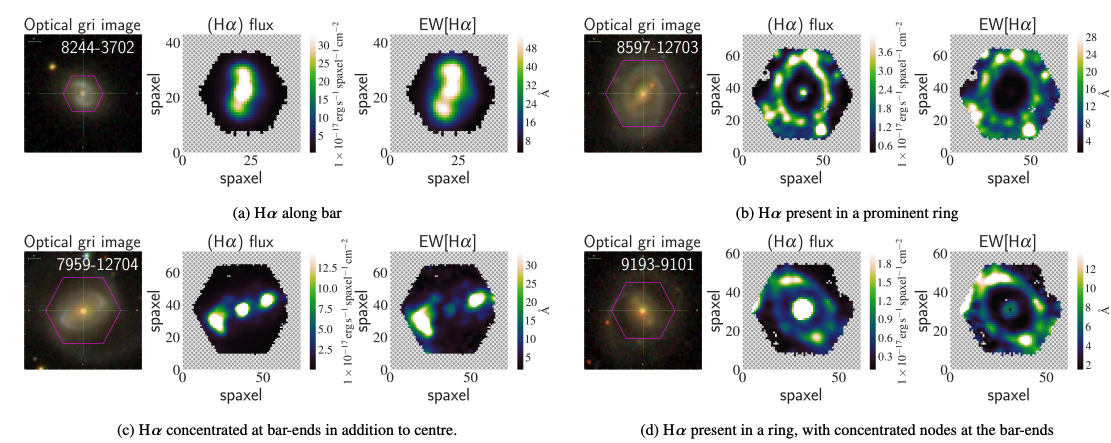
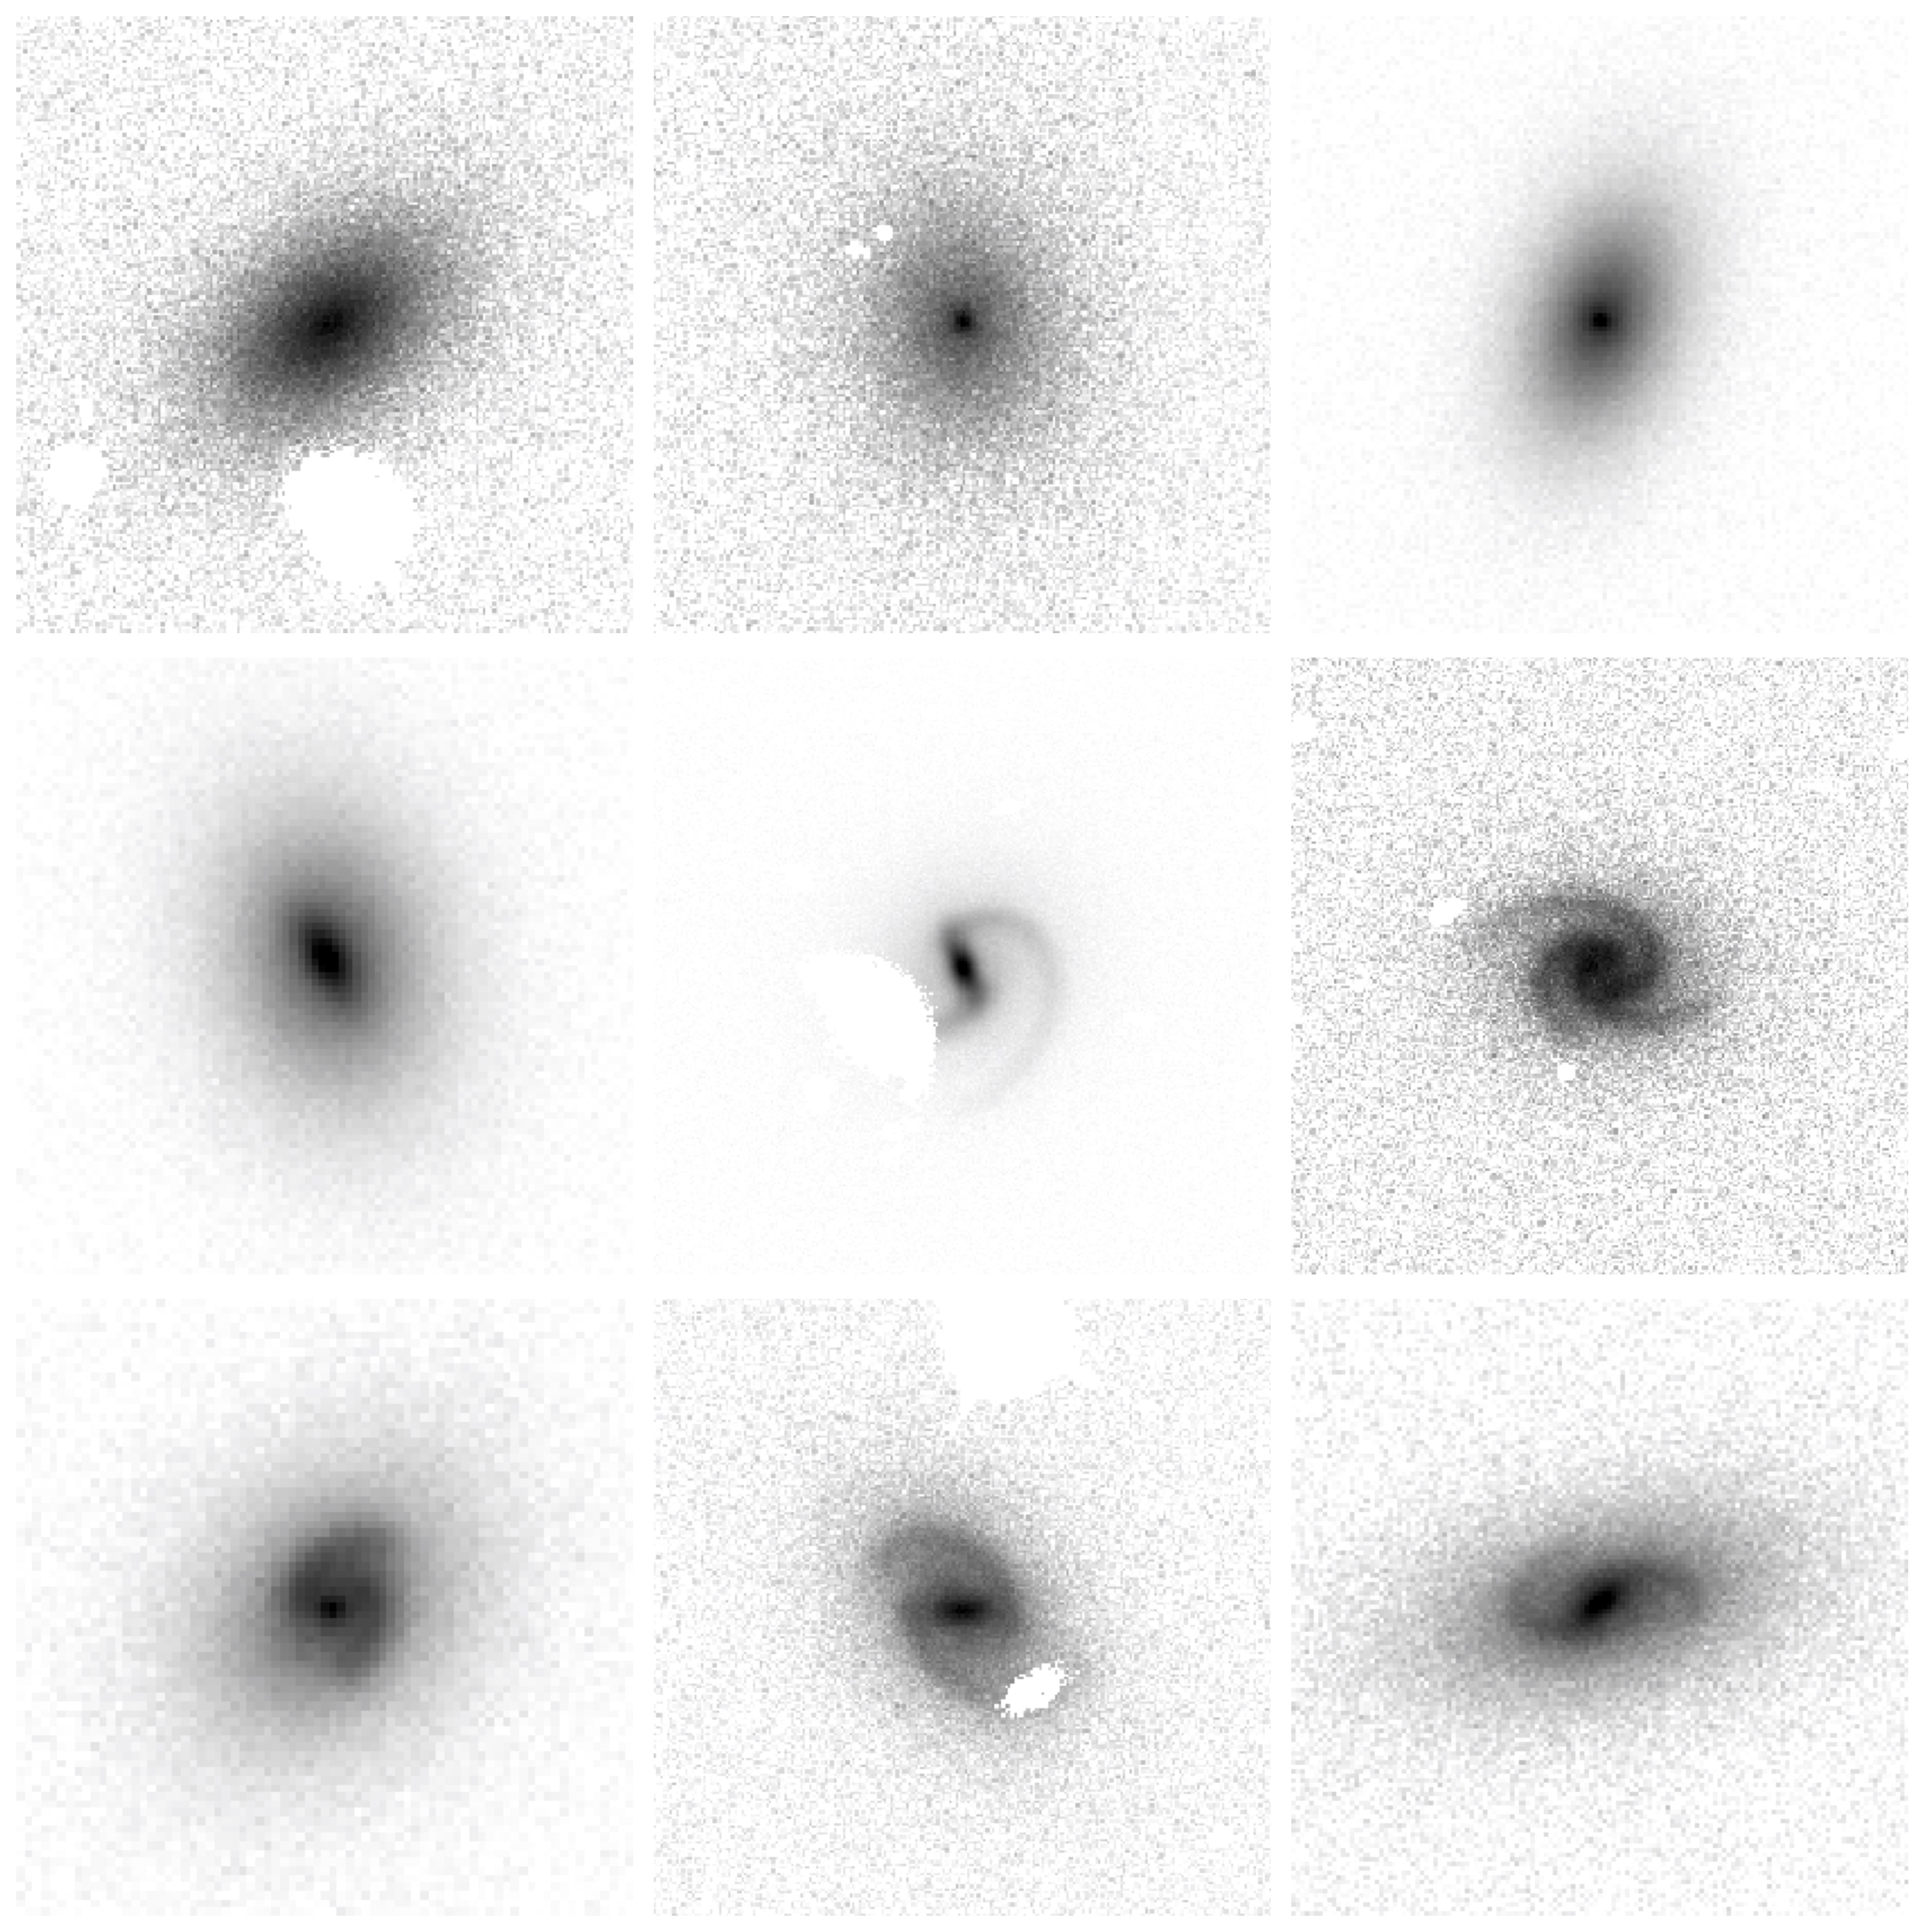
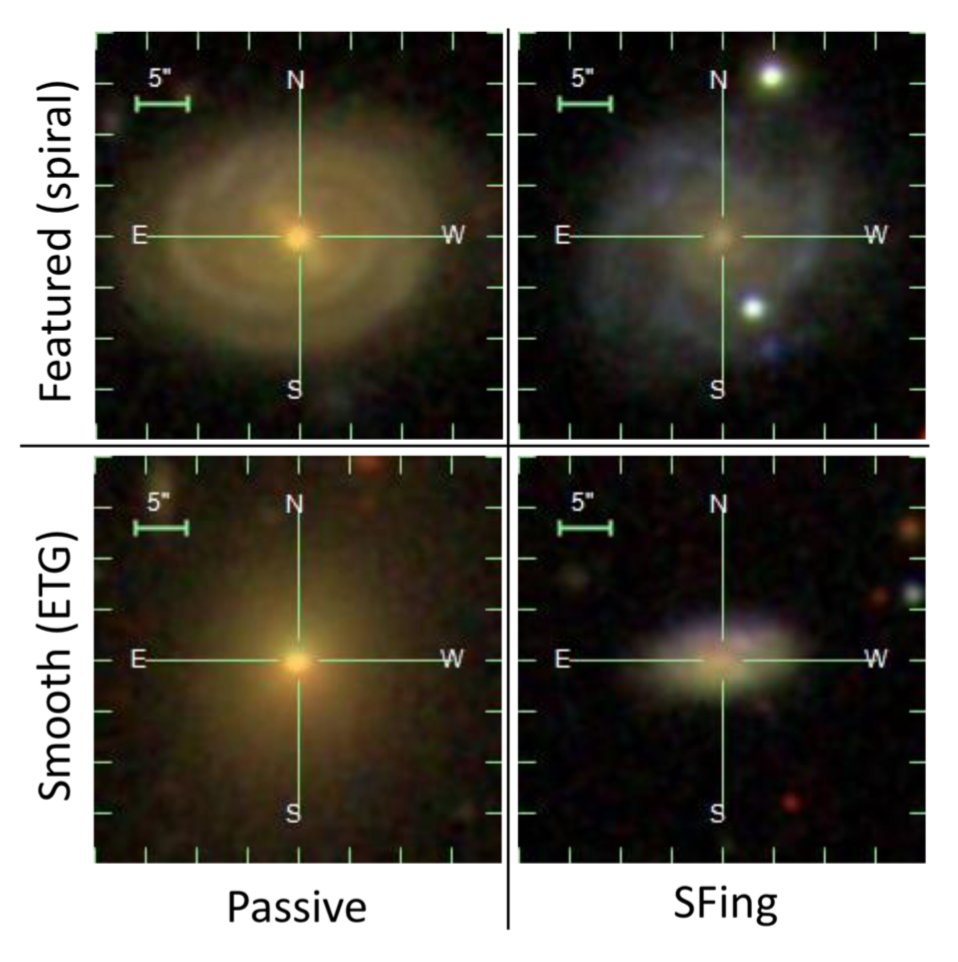
One fun thing we added was a look at the morphology of the ionized hydrogen around the bars in these galaxies (using data from the “MaNGA Survey”). This “Halpha” brightness can be traced by flux or “equivalent width” or EW (which is a measure of relative brightness compared to the stars you see in the normal images you are used to). It turns out this gas, which shows off where stars are currently forming in a galaxy – has a lot of different interesting shapes in barred galaxies, e.g. being found all along the bar, in rings or nodes.
The below image is a part of the sixth Figure in Petra’s paper.
There’s many more result in the paper, but I need to keep this blog post short for now.
Continuing to publish papers about bars in galaxies is also fun for me, as I’ve been working on trying to understand bars in galaxies using Galaxy Zoo classifications for well over a decade at this point. It’s great to see this work continuing with new samples and data and new understanding of the important role these structures play in stopping star formation in spiral galaxies. I wrote about bars for the blog “What’s all the Fuss about Bars in Galaxies” in 2015, or you can read this blog post from way back in 2010 (!) about our first Galaxy Zoo paper wondering “Do Bars Kill Galaxies”.
So thanks again for all the classifications. I’m excited for the future of this scientific area looking more at bars in the more distant universe (so looking back in time), which we already started with “Looking for Bars in Faraway Galaxies“, but I’m sure there will be much more to come.
Public data release for Galaxy Zoo: Cosmic Dawn!
The below post is by James Pearson (Open University; lead for Galaxy Zoo: Cosmic Dawn data analysis).
We are happy to announce that the classifications for Galaxy Zoo: Cosmic Dawn are now publicly available!
This iteration featured over 41,000 galaxies, using ultra-deep imaging from the Hawaii Twenty Square Degree (H20) survey (a part of the wider Cosmic Dawn survey) to study the Euclid Deep Field North (EDFN), one of the darkest areas of the sky.
More than 10,000 of you contributed almost four million classifications, helping us to find – amongst other things – galaxies with faint (low surface brightness) features and clumps of star formation, as well as more rare objects hidden in this ultra-deep imaging. Your classifications can also help improve the accuracy of machine learning models for faster processing of ever-increasing subject sets, and provide a means of selecting the most interesting objects for further examination with other telescopes. With your help we have already discovered 51 new gravitational lenses – rare phenomena where the light of a distant galaxy is warped into arcs and rings around an intervening galaxy on its path to us, which allow us to study both galaxies in greater detail (in addition to looking pretty!).

This public data release is accompanied by a paper describing the project and some initial analyses of the classifications made by volunteers and by Galaxy Zoo’s machine learning model, Zoobot. You can read the paper (which is under review) on the arXiv at https://arxiv.org/abs/2509.22311.

Thanks again to everyone who contributed their time to making classifications for this project – we really appreciate your participation.
James Pearson, on behalf of the Galaxy Zoo Team
Galaxy Zoo in Japanese
この度、Galaxy Zooは日本語でも参加できるようになりました(すでに中国語、フランス語、スペイン語、ハンガリー語、そして英語で利用できます)。ボランティアの翻訳者である @InoSenpai (イノ先輩)に感謝します。これで、本プロジェクトを日本語話者にも広めていけるようになりました。
We’re delighted to share that Galaxy Zoo is now available in Japanese (in addition to Chinese, French, Spanish, Hungarian and English). Thanks to the efforts of volunteer translator @InoSenpai we can now bring Galaxy Zoo to a wider audience of Japanese speakers.
Galaxy Zoo UKIDSS Classifications Now Public
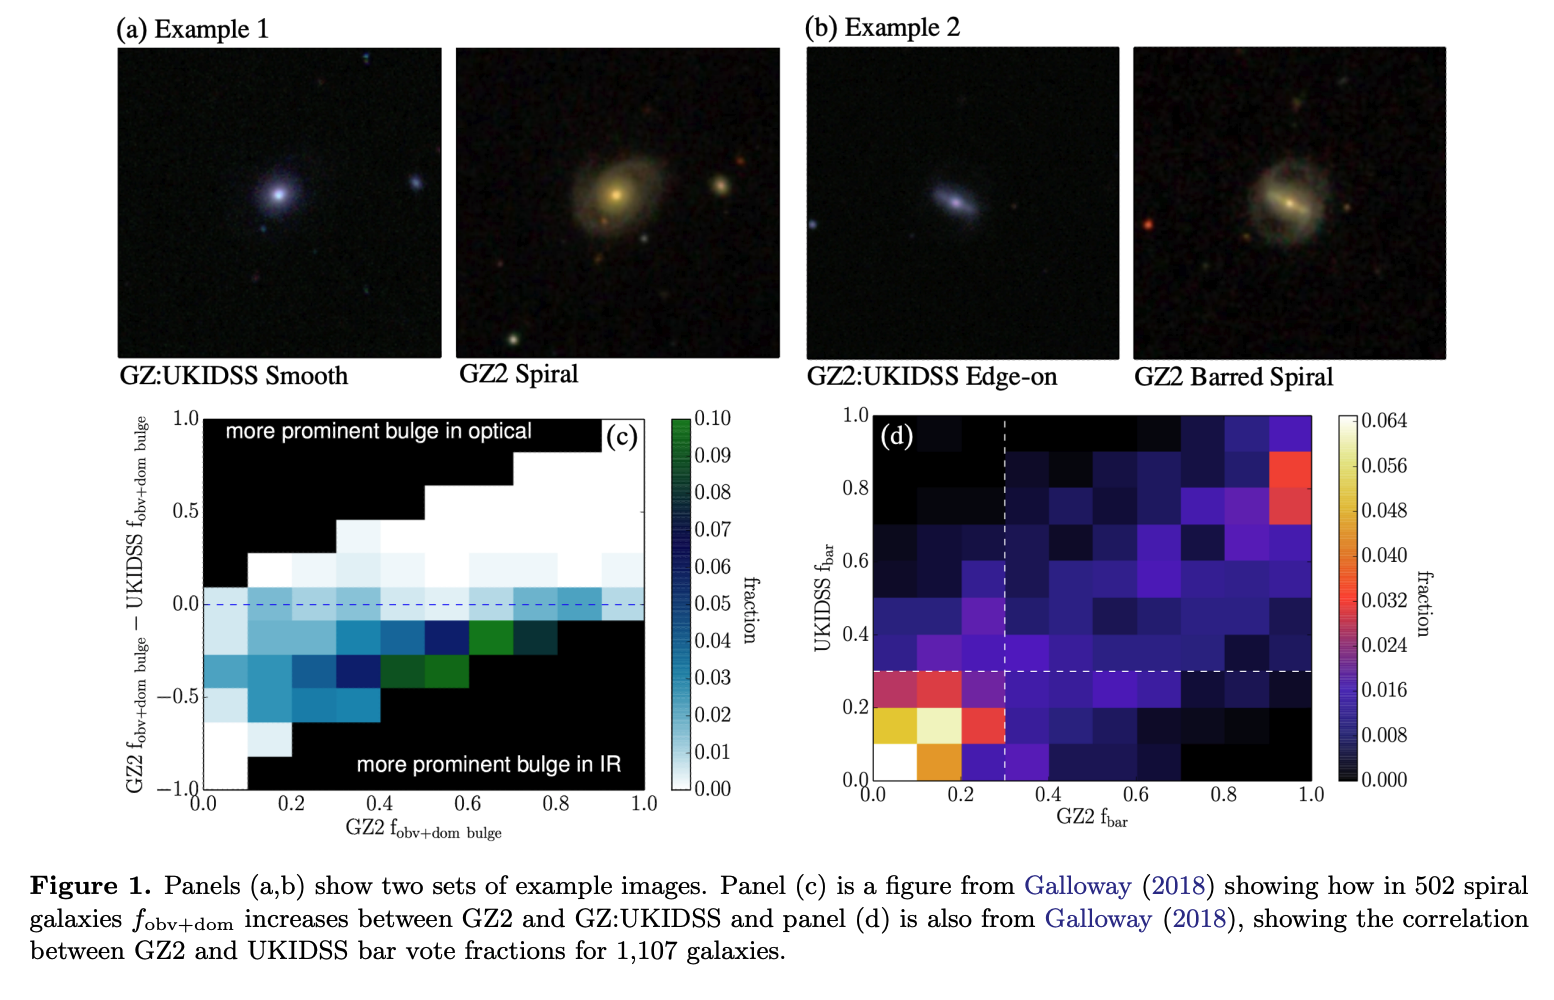
We’re happy to announce that we recently made all the classifications from the Galaxy Zoo: UKIDSS phase of the project public with a short paper (arxiv link) describing what’s available.
At Galaxy Zoo, we are really committed to making your classifications open access and publicly available. We want to do this to maximise the science output from all of your work. However, as we’re a pretty small science team, sometimes it takes us a bit longer than other times. In this case it’s 10 years since we showed the UKIDSS images on the site, but we hope it’s better late than never for releasing this sample, which, as far as we can tell is the largest set of morphological classifications of galaxies images in the near infrared range of the spectrum.

We decided to publish Galaxy Zoo: Morphologies Based on UKIDSS NIR Imaging for 71,052 Galaxies as a “Research Note of the American Astronomical Society” (RNAAS, or “Research Note” for short); a relatively new (and completely open access) publication venue from the American Astronomical Society journals. The length of these “Notes” is very limited, and you are only allowed one figure, but it gets published very quickly once it’s ready, so it seemed ideal for this short notice of the classifications being made public.
To read more about what UKIDSS is, and why we wanted to have the near-infrared galaxy images from it classified by you, you might enjoy this blog post explainer from 2013. We also talked about the UKIDSS images in this post from 2015 “Eight Years and Eight Different Types of Galaxy Images”.
As always, thanks again for your classifications, and in this case, also for your patience in waiting for us to get them processed and out to the astronomical community for use.
‘Astronomers Library’ Book Giveaway
Galaxy Zoo has meant a lot to me over the more than a decade I’ve been involved with the science team. I’ve been proud to work with many wonderful colleagues and students in the Galaxy Zoo science team and work on many investigations into the properties of galaxies enabled by your classifications.

So to celebrate the publication* of my latest popular science book “The Astronomers Library”, a beautiful pictorial walk through the history of books about astronomy, I am happy to be able to offer a giveaway to Galaxy Zoo volunteers. If you would like to have a chance to win a free signed copy of the book please sign up via this form. One volunteer will be randomly selected at the end of May 2024, and I’ll be in touch to arrange delivery.
As astronomers, our job involves many tasks, from data collection, analysis and interpretation, to presenting our work at conferences through talks and scientific posters. But there’s also a lot of writing. It’s often said that professional scientists are also professional writers. Lucky for me I happen to have come to really enjoy writing. I teach a class on writing in the sciences at Haverford College, and in recent years I’ve been delighted to find the opportunity to get involved in writing books intended for a popular audience. This book was particularly fun to work on for how it combines two of my favourite things – astronomy and books, and I’m delighted with the end result.
Karen (PI of Galaxy Zoo).
*For full transparency, while I was paid to write this book, I do not receive a commission per sale.
Planning for the Future of Galaxy Zoo – Science Team Meeting at ISSI
A large fraction of the Galaxy Zoo Science Team will be gathering at the International Space Science Institute (or ISSI) later this month to discuss the future of Galaxy Zoo, and in particular to work on the next phase of Galaxy Zoo now that there are large numbers of distant galaxies with publicly available JWST images.

This is part of a series of two funded meeting at ISSI that the Galaxy Zoo team was awarded with the goal of working on the next phases of Galaxy Zoo: JWST.
As the saying goes, if it isn’t broken don’t fix it. But also Galaxy Zoo has a tradition at being at the forefront of galaxy morphology techniques. So we want to use this meeting as an opportunity to spend some time reassessing the entire method that Galaxy Zoo pioneered back in 2007, when it was still a new idea to invite volunteers to participate in online image analysis. Our understanding of how to analyze your votes has evolved a lot over the last 17 years and across the more than 70 peer-reviewed publications the team has worked on. The status of machine learning methods for galaxy image analysis has also changed significantly, so it makes sense to reassess the most effective approach for humans and machines to collaborate on understanding the shapes and structures of galaxies.
The Galaxy Zoo science team has always been really international and distributed, with astronomers based all over the world. We are all really excited that ISSI has provided funding for us to have this rare gathering in person. We hope that by spending a week working together in person we can have some really productive discussions around the future of the project. We also have specific plans to work on getting the JWST images ready for your classifications as well as analyzing the results from the JWST:CEERS images you have already classified using our standard method.
As always we welcome volunteer input, not just via your classifications, but if you have opinions on what you would like to see in future versions of Galaxy Zoo, we invite you to share them on the Talk Forum.
Take a Peek at Some JWST Images
Many different teams of scientists are using NASA’s latest space telescope, JWST, to image galaxies so far away that they are back at the earliest time galaxies appear in the Universe. Because these galaxies are quite a bit more distant than any we’ve classified before in Galaxy Zoo, we want to make sure we know how to ask the right questions about the shapes and types of galaxies present, and also make sure we get the image processing as good as possible before asking for your help classifying lots of them.
To get Galaxy Zoo started on classifying (we hope eventually) all of the distant galaxies in JWST imaging, we are running a pilot with just 8000 galaxy images from the Cosmic Evolution Early Research Science (CEERS) survey.
CEERS is using JWST to take extremely deep images of 100 sq. arcmin of the sky (which is about 1/8th the size of the Full Moon!). It is making use of JWST instruments called NIRCam, MIRI, and NIRSpec to obtain both images and spectra in this patch of sky. CEERS’ main goal is to demonstrate, test, and validate efficient extragalactic surveys with coordinated, overlapping parallel observations in a patch of sky which already has a lot of other multi-wavelength data (e.g. from the Hubble Space Telescope).
Even though the pilot sample is being put into Galaxy Zoo mainly as a test survey for future projects, we still expect that your classifications of these images will help us find out a lot about the type and number of galaxies at very high redshifts (z~9-13), look for early star formation, black hole growth and the assembly of bulges and discs in galaxies at z>3, and look for dust observed star formation and black hole growth at z~1-3. We also plan to see how well machine classifiers like Zoobot do at classifying these galaxies, so we can get them to help with the classification of future, larger collections of JWST galaxies.
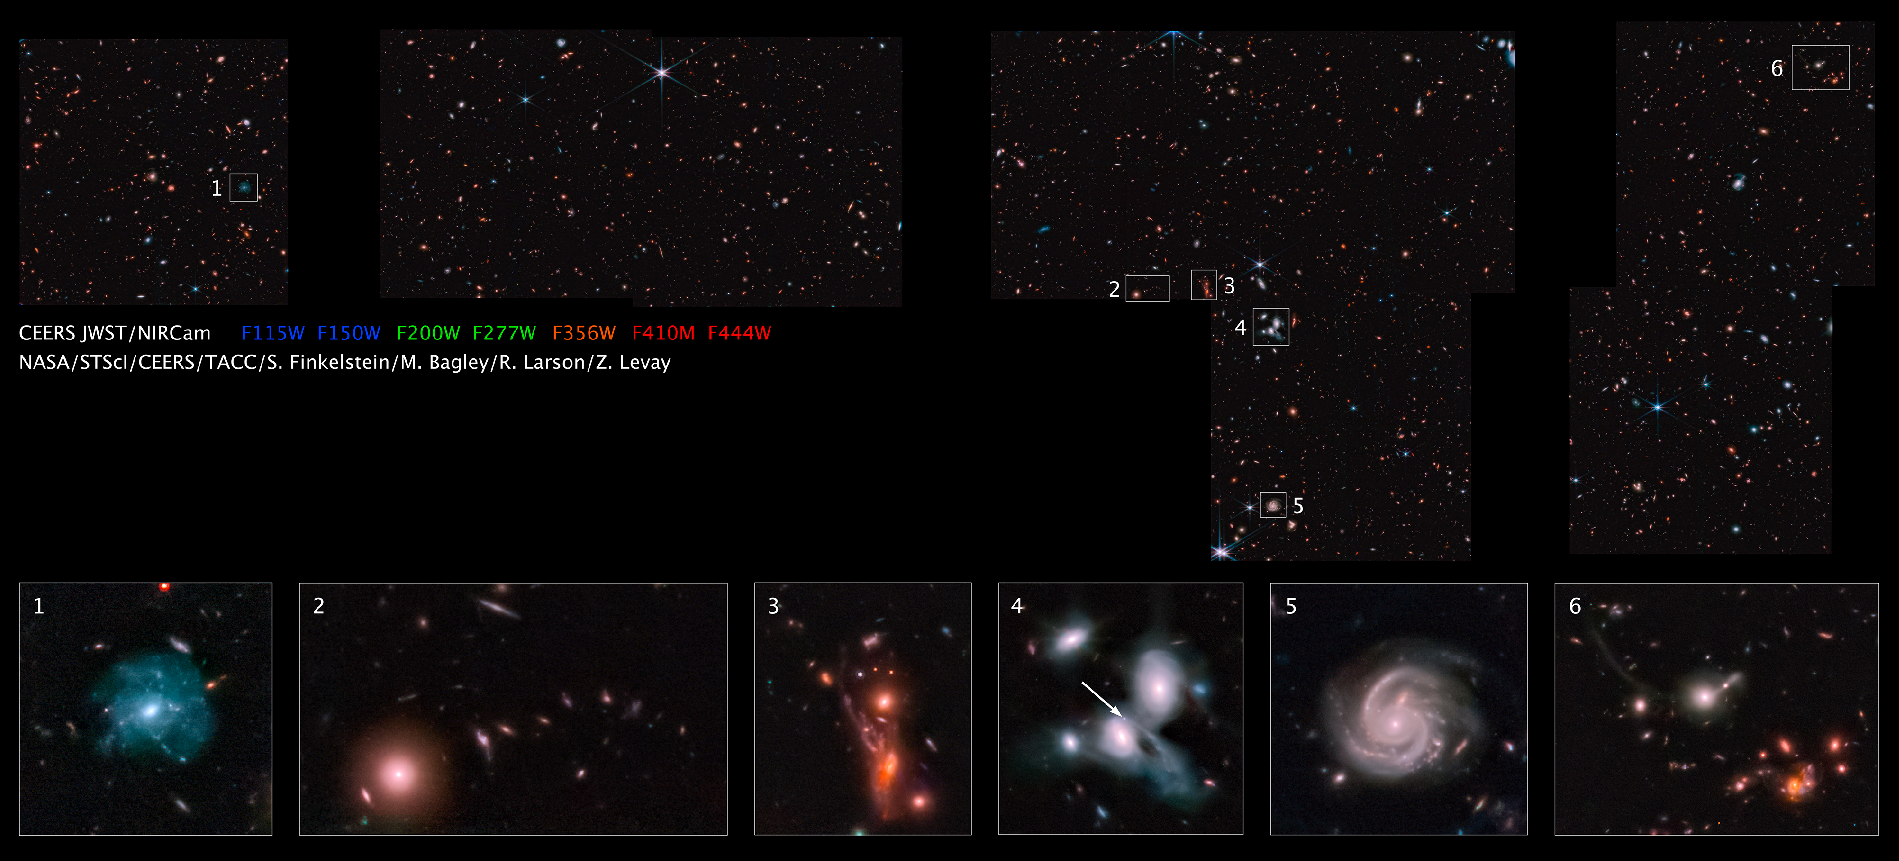
These images are from the first CEERS public data release. We have coordinated with the CEERS team to make sure the images you see are optimized to bring out as much detail as possible, and that the questions we are asking will enable the best possible science. We hope you’ll enjoy seeing some of the most distant galaxies ever observed in the project. And, as always, thanks for all your hard work classifying. We appreciate every click you provide.
Press Release on Results from Galaxy Zoo: 3D
Many of you helped out with the Galaxy Zoo spinoff project, Galaxy Zoo: 3D. I am happy to let you know that I am presenting results from this project, today at the 237th Meeting of the American Astronomical Society. You can view the iPoster I made about it at this link.

This spin-off project was aimed at supporting the MaNGA (Mapping Nearby Galaxies at Apache Point Observatory) survey, which is part of the Sloan Digital Sky Surveys (SDSS). Thanks to your input we have been able to crowdsource maps which show where the spiral arms, bars and any foreground stars are present in every galaxy observed by MaNGA. This, combined with the MaNGA data is helping to reveal how these internal structures impact galaxies.
The results will be part of a Press Conference about this and other SDSS results, live streamed at 4.30pm ET (9.30pm GMT) on the AAS Press Office Youtube Channel. The press release about them will go live on the SDSS Press Page at the same time. Direct link to press release (will only work after 4.30pm ET).
Thanks again for your contributions to understanding how galaxies work.
Presenting results from the Galaxy Builder project
From April 2018 until early this year, Galaxy Builder has collected over 18,000 models of spiral galaxies, built by volunteers. These models were combined and computationally fine-tuned, and the results have been compiled into Lingard et al. 2020 recently accepted for publication in the Astrophysical Journal.
The project asked volunteers to sequentially add components to a galaxy, starting with the galaxy’s disc, then, if one is present, a bulge and a bar, followed by tracing any visible spiral arms. At each stage, light from the corresponding component would be removed until the whole galaxy was accounted for:

Four-panel figure showing the galaxy builder interface, a spiral galaxy is visible in blue, and in each panel another component is added to gradually remove all the visible light from the galaxy.
After collecting 30 volunteer models for each galaxy, we then used Machine Learning techniques to cluster components, and identify a “consensus model”.

Four panel plots showing the clusterd and consensus components for an example galaxy. There is a small amount of scatter in each component, but the clustering has reliably found a good result.
We then used a computer fitting algorithm to fine-tune this model, resulting in a detailed description of the galaxy’s light distribution, which we can use to understand the physical processes occurring inside it!

Five panel plot showing an image of the example galaxy, the fitted model (which matches the real galaxy very well), the difference between the galaxy and model (which is small), and how the consensus components from clustering have changed during fitting (they do not change very much)
We have shown that galaxy model created in this way are just as reliable as simpler models obtained purely through computer fitting (when those simple models are appropriate!), by comparing to other published work and by incorporating a small sample of synthetic galaxies, for which we know the true light profiles:
The nine synthetic galaxy images, each of which look very realistic (but without clumpy star-forming regions). Most have spiral arms, and some have bars.
For most parameters, the difference between the true (x-axis) and volunteer-provided (y-axis) values is tiny. There are some issues with bar “boxyness” and bulge concentration (Sérsic index), primarily due to the computer fitting algorithm not being able to distinguish between different combinations of values:

Scatter plots showing how well parameters are recovered. We see that the method generally does a very good job, but there is a lot of scatter in bulge sersic index and bar boxyness.
Thanks to the added complexity of Galaxy Builder models, we have a much richer source of information for scientists to delve into! We’re excited to share the scientific results we’ve obtained, expect another post in the not-too-distant future (hint, spiral arms are complicated)!
The research team want to send a very warm thank-you to everyone who has participated in this project over the years. Without your efforts we would not have had the chance to do the science we are so passionate about, and we are very excited for the future of the Zooniverse.
Galaxy Builder is currently finished collected classifications, but we still need your classifications in Galaxy Zoo, where we’re working on collecting classifications for images from the DECaLs survey.
This blog was posted on behalf of Tim Lingard for the Galaxy Builder Team. Tim also submitted his PhD thesis based on this work this summer, and is now working as a Data Analyst for the 1715 Labs.
New Paper: Morphological Conformity in Galaxy Zoo
I’m delighted to report on the publication of the below paper, led by Justin Otter, a talented recent graduate of Haverford College who worked with me on this project since their Junior year (September 2017). Link to MNRAS abstract. Link to Arxiv version of accepted paper.
In this paper we used data from Galaxy Zoo 2 to investigate the idea of galactic “conformity” in galaxy morphologies.
What is Galactic Conformity?
Great question. It’s a fairly simple idea actually – the idea that satellite galaxies in groups are more likely to have similar properties to their central galaxy than a random galaxy in the Universe would. The satellites “conform” to the properties of the largest (central) galaxy in the group. So in a group with a star-forming central galaxy would be more likely to have star-forming satellite galaxies than a group with a passive (not star-forming) central galaxy.
What’s New in this Paper?
The new thing here is looking at the star-formation and morphological properties of galaxies separately. So this comes right back to our discovery with the help of all of you at Galaxy Zoo (almost 10 years ago now!) that not all spirals are star-forming (blue), and not all ellipticals are passive (red).
Credit: Otter et al. 2020 (courtesy KLM)
Most studies looking into galactic conformity prior to our work had used star-formation properties to find the signal, and then interpreted the result as if it was a morphological change in the galaxies. This is obviously an over-simplification, and we (well actually it was Brooke who said it first!) wondered if this was driven by star-formation conformity or morphological conformity – and could you find the signal separately for the two.
So what did you find?
Well we found conformity in both star formation and morphological type, but that the signal was stronger in star-formation properties. We also looked at satellites around red/passive and blue/star-forming spiral and elliptical central galaxies separately, and found the signal was largest around the red/passive elliptical central galaxies.
We made the following cartoon version of what we observed (note this is highly exaggerated – in all cases it was a small excess probability, not that all satellites around a central share its properties). All shapes of galaxies showed star-forming conformity, but there was only morphological conformity around ellipticals and blue spirals, suggesting that satellites of red spirals may have turned into ellipticals before the central galaxy

Credit: Justin Otter. A cartoon version of our observations
What does this mean for galaxy evolution?
This all fits quite nicely into the picture where star-formation properties of galaxies can change quite easily, but it’s much harder to change morphology, so as a group evolves and/or accretes more satellites they are likely to change star-forming properties more easilly/quickly than the morphological properties.
So thanks again for the classifications which give us the data to do this work!
In case you’re curious, Justin is currently working as a Fulbright Scholar at the Max Planck Institute for Astronomy in Heidelberg, Germany, and will return to the US for the next academic year to begin his PhD at John’s Hopkins University.
