
Winding Problems
I’m delighted to announce the acceptance of another paper based on your classifications at Galaxy Zoo, “Galaxy Zoo: Unwinding the Winding Problem – Observations of Spiral Bulge Prominence and Arm Pitch Angles Suggest Local Spiral Galaxies are Winding”, which has just been released on the arxiv pre-print server, and appear in the Monthly Notices of the Royal Astronomical Society (MNRAS) soon.
Here’s the title and author page.

This paper has been a long time coming, and is based significantly on the excellent thesis work of Ross Hart (PhD from Nottingham University). Ross wrote about some of his work for the blog previously “How Do Spiral Arms Affect Star Formation“. One of the things Ross’s PhD work showed was just how good your identification of spiral arm winding is, and that allowed us to be confident to use it in this paper.
You might notice the appearance of some of your fellow citizen scientists in this author list. Dennis, Jean and Satoshi provided help via the “Galaxy Zoo Literature Search” call which ended up contributing significantly to the paper.
Our main result is that we do not find any significant correlation between how large the bulges are and how tightly wound the spirals are in Galaxy Zoo spiral galaxies…. this non-detection was a big surprise, because this correlation is discussed in basically all astronomy text books – it forms the basis of the spiral sequence described by Hubble.

The Hubble Tuning Fork illustrated with SDSS images of nearby galaxies.
Way back in 1927 Hubble wrote (about the spiral nebula he had observed) that: “three [properties] determine positions in the sequence: (1) the relative size of the unresolved nuclear region, (2) the extent to which the arms are unwound (the openness or angle of the spiral), (3) the degree of condensation in the arms.” He goes on to explain that “These three criteria are quite independent, but as an empirical fact of observation they develop in the same direction, and can be treated as various aspects of the same process.” (i.e. Hubble observed them to be correlated).
It’s been known for a long time that there are examples where bulge (or “unresolved nuclear region”) size and arm winding did not agree, but these are usually treated as exceptions. What we’ve shown in this paper, is that for a sample selection which goes beyond just the brightest nearby galaxies Hubble could see, the correlation is not strong at all. Below is an annotated version of our main result figure – each point is a spiral with Galaxy Zoo classifications, and the contours show where there are lots of points. We find spirals all over this plot (except not many with big bulges and loosely wound arms), and the red and blue lines show the lack of any strong trend in either direction.
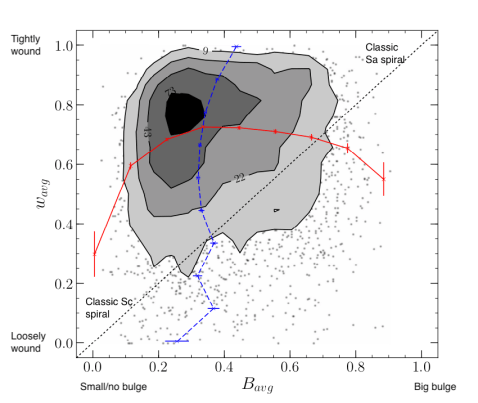
Figure 5 from Masters et al. (2019) paper.
This has significantly implications for how we interpret spiral winding angles, and could be explained by many/most spiral arms winding up over time (at rates which depend on the bulge size) rather than being density waves. We need to do more work to really understand what this observation tells us (which is a great place to be in science!).
We have also known for a while, that bulge size correlates best with modern expert galaxy classification on the Hubble sequence (e.g. when we compared you classifications to the largest samples done in that way). So another point we make in this paper is how different these modern classifications are to the traditional classifications done by Hubble and others. That’s OK – classifications should (and do) shift in science (part of the scientific method is to change on the basis of evidence), but it does mean care needs to be taken to be precise about what is meant by “morphology of galaxies”.
I ended the abstract of the paper with: “It is remarkable that after over 170 years of observations of spiral arms in galaxies our understanding of them remains incomplete.” and I really think that’s a good place to end. Galaxy morphology provides a rich source of data for understanding the physics of galaxies, and thanks to you we have access to the largest and most reliable set of galaxy morphologies ever.
If you’re inspired to keep classifying, head over to the main Galaxy Zoo project, or why not draw a few spiral arms over at Galaxy Zoo: 3D where we’re trying to understand spiral arms in more detail.
Galaxy Zoo 3D: Bar Drawing All done, but we still have spirals…
Just a quick post to say thank you for your contributions to Galaxy Zoo: 3D in the last couple of weeks. I’m delighted to say that the bar drawing task is now completed. We still have a lot of spirals to draw though, so if you are ready for a challenge come join us in drawing these beautiful structures. Remember we collect 15 answers per galaxy, and use clever algorithms to combine them into a really reliable answer – so do your best, but don’t get too worried if your hand slips slightly! 🙂

Finding Bars in Galaxy Zoo: 3D
I’m posting this on behalf of Amelia Frasier-McKelvie, a postdoc at the University of Nottingham, UK.
Hi – I’m Amelia, and I’m a postdoctoral researcher at the University of Nottingham. I work on galaxy evolution using the Mapping Nearby Galaxies at Apache Point Observatory (MaNGA) survey (and yes, I know it’s a contrived acronym!) MaNGA aims to observe 10,000 galaxies using integral field spectroscopy, which means instead of just obtaining one spectrum of a galaxy, we take several hundred at all different points across a galaxy. From this, we can infer interesting spatial information on galaxy properties. For example, we can see the regions in which star formation is occurring, or compare the ages of the stars in the bulge regions of a galaxy to the outer disk. By breaking down a galaxy into its components (such as bulge, disk, spiral arms, and bar) we can discover more about how the galaxy formed, and how it has led its life so far.

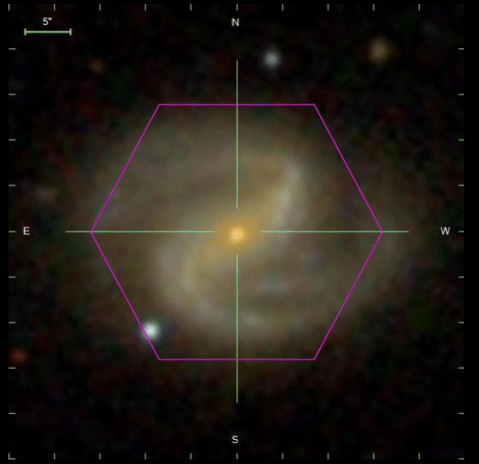
A MaNGA galaxy (image from SDSS imaging) with the area where spectra will be collected marked by the purple hexagon. Note the bar which is almost horizontal in this image.
I’m really interested in how bars affect their host galaxies. In particular, I’m looking for observational evidence that bars are involved in the quenching of star formation within a galaxy. This phenomenon is known as secular evolution/quenching. The one thing a galaxy needs to form stars is a reservoir of cool hydrogen gas. It’s been postulated that a bar can transfer matter (such as gas) radially inwards through a galaxy’s disk and into its central regions. If this is the case, then maybe it takes this gas required for star formation and funnels it towards the galactic centre, starving the disk, and ceasing star formation. Simultaneously, this gas that is funnelled into the central regions could either induce a final starburst, using up all gas, or feed an active galactic nucleus (AGN), which can heat the gas to a point where it cannot collapse to form stars.
If we wanted to catch a bar in the act of quenching a galaxy, we could look for tell-tale signs of this funnelling action, namely a difference in the age and chemical composition of the stellar populations in the bar region of a galaxy when compared to the disk.
Another MaNGA galaxy with a strong bar.
This is where Galaxy Zoo 3D comes in — I need to know where the bars actually lie in their host galaxies! Galaxy Zoo 3D citizen scientists mark out the bar (and spiral arm) regions of the MaNGA galaxy sample, which I can apply to our data cubes and extract spectra belonging to the galactic bar and disk regions. I can then analyse the bar and disk spectra separately and compare their properties. I’m interested in the global properties of a large sample of galaxies, so I need as many bar and disk region classifications as possible!
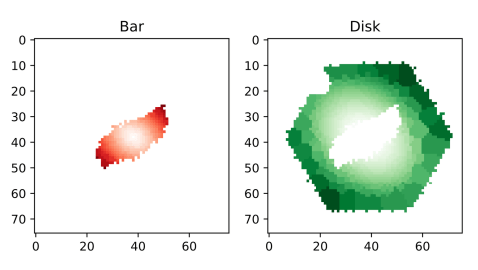
Masks made by GZ:3D showing the bar and disk (or not bar) regions of the above galaxy.
If I can find observational evidence that bars are helping to quench galaxies this will confirm the idea that internal secular evolutionary processes are important in galaxy evolution.
This will prove that along with external factors, internal structures such as bars are extremely important in determining a galaxy’s fate!
We hope you enjoyed hearing about how the masks made in Galaxy Zoo: 3D are being used. There’s still plenty of bars and lots and lots of spirals to mark in the project, so please join in if you’d like to help us complete our sample and help Amelia and others (including me!) with their research.
A Conference on Galactic Rings

Paul Eskridge and Karen Masters help Ron Buta unwrap the De Vaucouleurs classification diagram. Photo credit: Bill Keel.
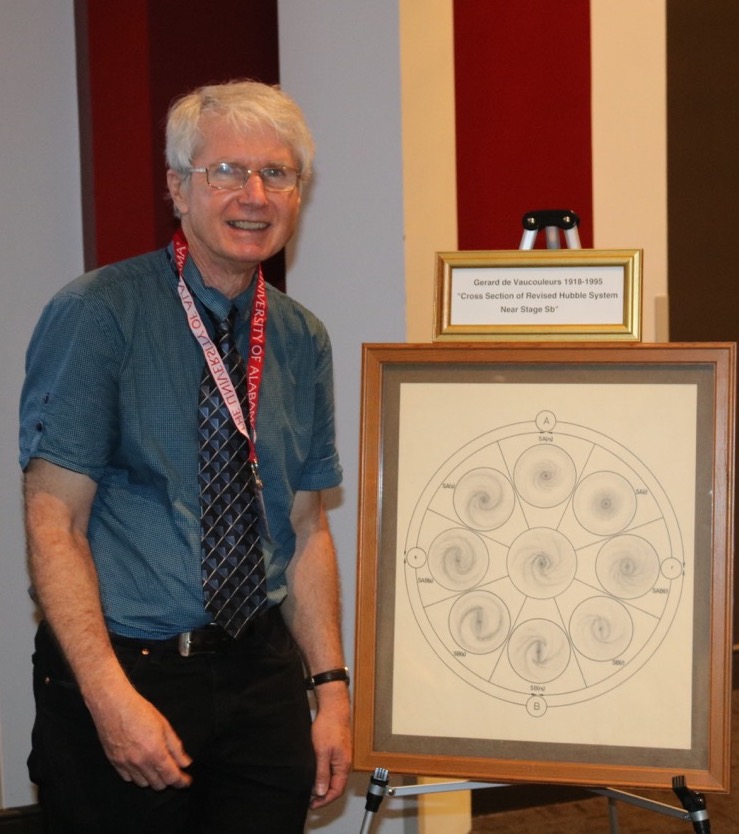
Ron Buta by the original diagram of the De Vaucouleur Classification Scheme for Sb galaxies. Gerard de Vaucouleur hand drew each galaxy in the diagram in pencil while clouded out on observing runs. Many of the structures discussed in this conference are clearly shown in this diagram. Photo credit: Bill Keel
There are various kind of rings we see in galaxies – nuclear, inner, outer, pseudo rings, collisional, accretion, maybe even disk instability at high redshift. We discussed how all of these are thought to form, and enjoyed a parade of beautiful images of ring galaxies.

A selection of ring galaxies. From left to ring: Hoag’s Object (an accretion ring), The Cartwheel Galaxy (a collisional ring) and NGC 3081 showing an inner and nuclear resonance ring (it also has an outer ring, not shown in this image). Image credits: Hubble Space Telescope for all three (composition by Karen Masters).
Spiral arms and how they form were a big discussion at the conference. Bill Keel (who you may now better for his work on overlapping galaxies found in the forum), presented work by the most recent Galaxy Zoo PhD – Dr. Ross Hart (who unfortunately could not make the meeting) on Galaxy Zoo constraints on spirals. This included results from a small side project Spiral Spotter. What is clear from this result (and many others presented at the meeting) on spirals – we really don’t understand which spiral arm formation mechanisms are the most important in galaxies, or how to tell in an individual galaxy which mechanism makes its spirals. There’s a dizzying array of possibilities – so lots of results to test with morphology. Overlapping systems did still get a mention – presented by Benne Holwerda.
Bill Keel presenting Galaxy Zoo results on spiral arms. Credit: Karen Masters
NGC 4371 and it’s clear bar (Credit: SDSS)

Karen Masters starting a talk with a review of 11 years of the Galaxy Zoo project. Credit: Bill Keel

A group of experts classify a photo of astronomers from 1995 (in the same location). Credit: Bill Keel.
Galaxy Zoo: Literature Search – Initial Results
Thanks to everyone who has helped with the Galaxy Zoo Literature Search so far. It’s not too late to join in (for full details see the first blog post), but I thought I would write a followup summarising some of the findings so far. Hopefully it’ll help clarify what we’re looking for, and you won’t have to worry about repeating any of the papers we already have.
Academic life is full of lots of different tasks which occupy our time more or less at different parts of the year. It’s one of those things which I enjoy about it so much, but is is also basically my excuse for why work on the paper has ground to a halt in the last month. I have been occupied with teaching undergraduate Computational Physics, SDSS Spokesperson duties, and keeping on top of lots of remote observing with the Green Bank Radio Telescope. All good fun, but not paper writing! However this paper is making it back up to the top of my to do list now (hence this blog post!), so I hope to have more news for you on it soon.
Anyway here’s my summary of the new papers you have found for us in the different categories. We had no submissions yet of new papers defining early-types as E/S0/Sa, or late-types as being only types Sb/Sc/Sd yet, so keep looking for those.
Also as a reminder that when we’re talking about galaxies red = shorthand for not forming stars (or quenched), so sometimes astronomers use red and quenched (or passive) interchangeably. And spectra can also be used to find galaxies which are not forming stars, so spectral type and colour are highly related.
We also have a ton of different ways to talk about galaxy bulge size, from B/T (bulge-total ratio), to various model fits to light profiles (e.g. the Sersic profile, where Sersic n>2.5 is generally take to mean there’s a bulge, and n=1 means a pure disc). Concentration is also talked about – a more concentrated galaxy is more likely to have a bulge, than a less concentrated galaxy. And in SDSS there is a “fracDeV” parameter, which is the fraction of the model light curve made up from a “De Vaucouleur profile”, which is the same as a Sersic profile with n=4. We don’t like to make life too easy for newcomers in astronomy! 😉
The list of papers that:
- Claim that colour and morphology are equivalent
Strateva et al. 2001: https://ui.adsabs.harvard.edu/#abs/2001AJ….122.1861S/abstract
A classic here, and possibly the root of this idea: “We use visual morphology and spectral classification of subsamples of 287 and 500 galaxies, respectively, to show that the two peaks correspond roughly to early- (E, S0, and Sa) and late-type (Sb, Sc, and Irr) galaxies, as expected from their different stellar populations.”
Note that they are defining early- and late-types in the way I would like to find more examples of.
Fang et al. 2013: https://ui.adsabs.harvard.edu/#abs/2013ApJ…776…63F/abstract
This one is a bit complicated. They state in the Introduction that “galaxies above a Sersic value of n ≈ 2.5 tend to be quiescent. “ and go on to claim that having a large bulge is necessary but not sufficient to be quenched (ie. red). Which means they acknowledge the existence of blue ellipticals (or blue galaxies with large bulges), but not red spirals with small bulges.
In their conclusions they state: “our results imply that galaxy quenching requires the presence of a bulge, but that a bulge alone is not enough to ensure the complete cessation of SF. “
This was not exactly what we were looking for, but definitely related, and interesting.
Huerta-Company et al. 2011 http://adsabs.harvard.edu/abs/2011A%26A…525A.157H
Good try, but I’m not sure this quite counts in this category – they use colour as part of their classification scheme (which we would definitely not recommend), but it’s not the only part, so they’re not really saying it’s the same as morphology. “Three types of parameters used to estimate morphology probabilities; “we decided to include three types of parameters: (1) color (g − r, r − i) k-corrected with Blanton et al. (2005) code; (2) shape (isoB/isoA in the i-band and deVAB_i); and (3) light concentration (R90/R50 in the i-band). For color measurements we use modelmagnitudes corrected for galactic extinction. isoB and isoA are the isophotal minor and major axes respectively, and deVAB_i is the DeVaucouleurs fit b/a. R90 and R50 are the radii containing 90% and 50% of the petrosian flux, respectively”
Cooper et al. 2010: https://ui.adsabs.harvard.edu/#abs/2010MNRAS.402.1942C/abstract
In the introduction they say: “Various observational studies have investigated the formation of early-type or red-sequence galaxies “
They then go on to use colour to define their sample: sec. 2 p. 1943:”To isolate the red- sequence population, we use the following magnitude-dependent cut: g − r = −0.02667 · M r + 0.113”
Good find. This definitely just assumes that colour=morphology.
Tal & van Dokkum 2011: http://adsabs.harvard.edu/abs/2011ApJ…731…89T
In the words of our volunteer (Jean Tate):
“Throughout this paper, the authors conflate “massive red” with “elliptical”. This formally begins with the selection criteria (“We selected galaxy images for this study from the Sloan Digital Sky Survey (SDSS, Abazajian et al. 2009) including all objects classified as Luminous Red Galaxies (LRG) that have a spectroscopic redshift measurement. LRGs are intrinsically red and luminous objects that were identified as such from their central surface brightness and location on a rotated color-color diagram (for full details see Eisenstein et al. 2001). This selection is aimed at finding the most luminous red galaxies in the nearby Universe (L 3L⋆) out to a redshift of z = 0.5.”)”) which does not distinguish between red ellipticals and red spirals (nor red S0s). However, the first sentence in the Discussion section strongly implies that massive red S0s and massive red spirals are irrelevant (“The first and foremost result that arises from this study is that faint, gravitationally bound stellar light can be traced in massive elliptical galaxies out to a radius of 100 kpc.”), to take just one example.”
Another good find, and very common that LRG=elliptical is assumed.
2. Define “early-type” galaxy as any galaxy without visible spiral arms (e.g. our “smooth” category, which can include elliptical galaxies, and smooth disks), rather than as a galaxy that isn’t a disk.
So here I basically meant they were defining early-type as E and S0 only, and we got one submission like that:
Stanford et al. 1998: http://adsabs.harvard.edu/abs/1998ApJ…492..461S. “We present results from an optical-infrared photometric study of early-type (E+S0) galaxies in 19 galaxy clusters out to z = 0.9.”
“In this paper, we use the term ““early-type” galaxy to refer to those galaxies classified morphologically as having Hubble classes E, E/S0, or S0. “
3. Define “early-type” galaxy as including Sa spirals as well as lenticular and ellipticals.
No submissions yet – although note that Strateva et al. 2001 (above) do this.
4. Define “late-type” galaxy as only late-type spirals (e.g. excluding Sa spirals)
No submissions yet – although note that Strateva et al. 2001 (above) do this.
5. Use colour or spectral type to split galaxies into “early-“ or “late-“ types (or “elliptical” and “spiral”)
van den Bergh 2007: http://cdsads.u-strasbg.fr/cgi-bin/nph-bib_query?2007AJ….134.1508V&db_key=AST&nosetcookie=1 actually has a contrary view, claiming that “there appears to be no obvious dichotomy between the morphologies of galaxies that are situated on the broad blue and on the narrow red sequences in the galaxian color-magnitude diagram.”
Bell et al. 2004: http://adsabs.harvard.edu/abs/2004ApJ…608..752B
Exactly what we were looking for. They use colour to split their sample into “late” and “early” types, saying:
“”We find that the rest-frame color distribution of these galaxies is bimodal at all redshifts out to z ~ 1. This bimodality permits a model-independent definition of red early-type galaxies and blue late-type galaxies at any given redshift. ”
Cooper et al. 2010: https://ui.adsabs.harvard.edu/#abs/2010MNRAS.402.1942C/abstract
Another good example of using colour to define an early-type sample:
sec. 2 p. 1943:”To isolate the red- sequence population, we use the following magnitude-dependent cut:
g − r = −0.02667 · M r + 0.113”
In doing this they are assuming that red = early-type. In the introduction they say: “Various observational studies have investigated the formation of early-type or red-sequence galaxies “
Almedia et al. 2011: http://adsabs.harvard.edu/abs/2011ApJ…735..125S
Actually seem to be looking into how well the correlation between spectral type and morphology works, saying: “Given a spectral class, the morphological type wavers with a standard deviation between 2 and 3 T types, and the same large dispersion characterizes the variability of spectral classes given a morphological type.”
So this is actually evidence that morphology and spectral type are not completely equivalent.
Ascasibar & Almeida 2011: http://adsabs.harvard.edu/abs/2011MNRAS.415.2417A
But now in this one, the claim is that the correlation is good enough to use spectral classifications to place galaxies into a morphological sequence: “Considering galaxy spectra as multidimensional vectors, the majority of the spectral classes are distributed along a well-defined curve going from the earliest to the latest types, suggesting that the optical spectra of normal galaxies can be described in terms of a single affine parameter.”
6. Use the bulge-to-total ratio (or some proxy for it like concentration, or the SDSS “fracDeV” parameter) to place spiral galaxies in a sequence.
Goto et al. 2003: http://adsabs.harvard.edu/abs/2003MNRAS.346..601G
p. 604 : “Based on the Tauto parameter, we divide galaxies into four subsamples…”
Looking into this, “Tauto” is an attempt to parameters both the bulge size, and the amount of structure not captured in a smooth light profile (some form of clumpiness), so it does indeed neglect the degree of windiness of the spiral arm in placing them in a sequence by bulge size and clumsiness only. Nice find.
Drory & Fisher 2007: http://adsabs.harvard.edu/abs/2007ApJ…664..640D
This paper actually provides evidence that B/T is not enough to classify galaxies into a sequence, pointing out that there are different types of bulge (pseudobulges, which are thought to be build up slowly from discs, and classical bulges, general thought to form in mergers) which correlate with galaxy colour even at the same B/T.
“(1) the red-blue dichotomy is a function of bulge type: at the same B/T, pseudobulges are in globally blue galaxies and classical bulges are in globally red galaxies; “
In summary, I hope this was interesting, and there’s definitely some examples you hve found which will make it into the reference list for the paper. Thanks again for your help, and if you are now inspired to join in go read the instructions here. We’d love to have you along.
Galaxy Zoo Literature Search
Dear volunteers,
Here at Galaxy Zoo we know that some of you are looking for ways to be more involved in the entire process of making science from your clicks.
So we had an idea…..
The team are currently in the process of writing a paper which in its introduction discusses some of the current assumptions/errors/approximations common among our fellow astronomers when thinking about galaxy morphology and classification. As such we’d like to collect as many papers as possible which do the following things:
- Claim that colour and morphology are equivalent
- Define “early-type” galaxy as any galaxy without visible spiral arms (e.g. our “smooth” category, which can include elliptical galaxies, and smooth disks), rather than as a galaxy that isn’t a disk.
- Define “early-type” galaxy as including Sa spirals as well as lenticular and ellipticals.
- Define “late-type” galaxy as only late-type spirals (e.g. excluding Sa spirals)
- Use colour or spectral type to split galaxies into “early-“ or “late-“ types (or “elliptical” and “spiral”)
- Use the bulge-to-total ratio (or some proxy for it like concentration, or the SDSS “fracDeV” parameter) to place spiral galaxies in a sequence.
The current draft text in the paper which talks about these assumptions is:
“The morphology of a galaxy encodes information about its formation history and evolution through what it reveals about the orbits of the stars in the galaxy, and is known to correlate remarkably well with other physical properties (e.g. Roberts & Haynes 1994). These correlations, along with the ease of automated measurement of colour or spectral type, have resulted in a recent trend for classification on the basis of these properties rather than morphology per se (e.g. Weinmann et al. 2006, van den Bosch et al. 2008, Zehavi et al. 2011). Indeed the strength of the correlation has led some to authors to claim that the correspondance between colour and morphology is so good that that classification by colour alone can be used to replace morphology (e.g. Park & Choi 2005, Faber et al. 2007). Meanwhile the size of modern data sets (e.g. the Main Galaxy Sample of the Sloan Digital Sky Survey, SDSS, Strauss et al. 2002) made the traditional techniques of morphological classification by small numbers of experts implausible. This problem was solved making use of the technique of crowdsourcing by the Galaxy Zoo project (Lintott et al. 2008, 2011). One of the first results from the Galaxy Zoo morphological classifications was to demonstrate on a firm statistical basis that colour and morphology are not equivalent for all galaxies (Bamford et al. 2009, Schawinski et al. 2009, Masters et al. 2010) and that morphology provides complementary information on galaxy populations useful to understand the processes of galaxy evolution. “
and later when talking about the spiral sequence:
“Modern automatic galaxy classification has tended to conflate bulge size alone with spiral type (e.g. Laurikainen et al. 2007, Masters et al. 2010a), and automatic classification of galaxies into “early-” and “late-” types, referring to their location on the Hubble Sequence and based on bulge-total luminosity ratio (B/T ) or some proxy for this through a measure of central concentration, or light profile shape (e.g. Sersic index, as reviewed by Graham & Driver 2005) has become common (e.g. van der Wel et al. 2011). Indeed, Sandage (2005) says this is not new, claiming ”the Hubble system for disk galaxies had its roots in an arrange- ment of spirals in a continuous sequence of decreasing bulge size and increasing presence of condensations over the face of the image that had been devised by Reynolds in 1920.””
We’d like to ask for your help in searching for more examples of these behaviours. We have made a simple Google form, and we ask that you submit any examples you find in the next few weeks.
Some of the papers you find might end up cited in the Galaxy Zoo team paper (please be aware there are rules/guidelines about the appropriate number – we don’t want to have too few; it doesn’t make the point about how widespread this is, and we don’t want to single out specific astronomers, but the journal won’t accept too many either). If there are more papers found than we can use, they will be kept in a list on the Galaxy Zoo website (and we can continue to add to them if needed).
I want to reassure you that helping with this does not mean you have to read the entire extragalactic astronomy literature, or even the entirety of a paper! The best place to look for this information in a paper will be the “Sample Selection”, or “Data” sections. Modern online PDF papers also have excellent search facilities – so searching the text for key words (e.g. “spiral”, “early-type”, “colour/color-selected”) may work extremely well.
We’re happy for you to do this however you like (e.g. Google Scholar is fine), but we’d like you to return the NASA ADS (Astrophysics Data System) URL for the paper you find. You can search ADS here: http://adsabs.harvard.edu/abstract_service.html, and I give examples below of the URL I mean. This makes it easy for us to get the full bibliographic data to add the reference to the paper.
One tip – there are some papers in extragalactic astronomy which are cited by most/many results. A good place to start looking through recent papers would be the citation and reference lists of such papers, which can be found in ADS.
For example:
Strateva et al. 2001 “Color Separation of Galaxy Types in the Sloan Digital Sky Survey Imaging Data”
http://adsabs.harvard.edu/abs/2001AJ….122.1861S is cited by 926 papers, and references 25 – this would be an excellent starting place, and the more papers you read the more mentions you may find other other papers doing similar things.
Other good starting places:
Strauss et al. 2002: “Spectroscopic Target Selection in the Sloan Digital Sky Survey: The Main Galaxy Sample” http://adsabs.harvard.edu/abs/2002AJ….124.1810S
Ironically the papers which cite some of our Galaxy Zoo papers where we demonstrate there are galaxies which are not in the normal correlation between colour and morphology may also be good starting points (some citations to these are along the lines of saying things like: “most galaxies fall into blue=spiral; red=elliptical, a few don’t (cite Galaxy Zoo here), but we’re going to use this definition anyway”.
The initial papers on colour not being the same as morphology are:
Bamford et al. 2009 (281 citations): http://adsabs.harvard.edu/abs/2009MNRAS.393.1324B
Schawinski et al. 2009 (81 citations): http://adsabs.harvard.edu/abs/2009MNRAS.396..818S
Masters et al. 2010 (125 citations): http://adsabs.harvard.edu/abs/2010MNRAS.405..783M
We hope that if several of you take up the challenge, you’ll find different paths through the literature and find lots of different examples for us. Again here’s the link to our Galaxy Zoo Literature Survey.
Thanks for your help!
Karen Masters (Galaxy Zoo Project Scientist)
Introducing Galaxy Zoo “3D”, aka “Why are SDSS galaxies back?”
I’m delighted to announce the launch of “Galaxy Zoo: 3D” today – this is a small project from a subset of the Galaxy Zoo team where we ask you to help us identify in detail the locations of internal structures seen in a sample of about 30,000 galaxies.

What’s special about these galaxies is that they have been selected to potentially be observed (or in some cases have already been observed) by the “MaNGA” project.
MaNGA (which stands for “Mapping Nearby Galaxies at Apache Point Observatory” – sorry about that!), is a spectroscopic mapping survey that I have been working with for the last several years. This one of the current surveys which form part of the 4th generation of Sloan Digital Sky Surveys.
SDSS retired its camera in 2012 (its in the basement of the Smithsonian Museum in Washington, D.C!), and is now focusing on measuring spectra of things in space. Instead of taking images of galaxies in just a couple of filters, MaNGA takes spectral images – each of up to hundreds of points in the galaxy has a full spectrum measured, which means we can decode the types of stars and gas found in that part of the galaxy. We can also recover the motions of the stars and gas in the galaxy making use of the Doppler shift (the redshift or blue shift we see in light which comes from moving sources).

An illustration of the type of data MaNGA is taking. You get an image of the galaxy at each wavelength slice (e.g. the green one shown), or a spectrum at any point. You can also combine all the light into a single image. The resolution (sharpness) is poorer than using a camera, but you get a lot more information. Illustration credit: CubeVisualisation
MaNGA will ultimately do this for about 10,000 of the total list (this is how many we can manage in 6 years of operations), and since 2015 has already measured these data for a bit more than 3000 galaxies. To help us interpret this vast quantity of data we’re asking you to draw on the galaxies to mark the locations of spiral arms and bars. We also want to double check the galaxy centres are recorded correctly, and that we have found all the foreground stars which might be getting in the way of the galaxy.
Now one thing you know all about as Galaxy Zoo volunteers is the benefit of human eyes on large samples of galaxies. When we first launched Galaxy Zoo we made use of the “Main Galaxy Sample” from the Sloan Digital Sky Survey as the input list of galaxies. This is a sample of 1 million galaxies automatically identified from the SDSS images, and which had their distances (redshifts) measured in SDSS-I/II. However (perhaps ironically) the algorithm which selected this sample wasn’t very good at finding the biggest most nearby galaxies. Specifically it tended to “shred” them into what it thought were multiple galaxies. My favourite demonstration of this is the Pinwheel galaxy (M101), which the first SDSS galaxy detection algorithm interpreted as a cluster of galaxies.

M101 as seen by the original SDSS galaxy finding algorithm – each red box was thought to be a separate galaxy. Image from Brichman et al. 2013.
(Don’t worry – ever resourceful, astronomers have made plenty of use of these galaxies which have multiple spectra measured – it turns out to be really useful).
By the time MaNGA came along this problem was well known, and instead of making use of the standard SDSS galaxy catalogues, MaNGA targeted nearby galaxies by making use of the “NASA Sloan Atlas“- a NASA funded project to make a more careful list of nearby bright galaxies in the SDSS images.
So what we discovered when putting together the sample for Galaxy Zoo: 3D is that not all MaNGA galaxies have Galaxy Zoo classifications. In fact about 10% are missing, and we also found some more galaxies we missed first time round. It turns out that by relying on automatic galaxy finding there were a quite a few galaxies which had been missed before.
So these are back in the main site right now.
In Galaxy Zoo: 3D we will only ask you to draw spiral arms on galaxies you have previously said have spiral arms, so we’ll be making use of the new classifications to sort out the last 10% of MaNGA galaxies. We’ll also create a complete Galaxy Zoo classification list for the MaNGA sample, which will be really useful for people working with that sample.
To tempt you to give it a go, here are some interesting and beautiful MaNGA galaxies being discussed in Talk by our beta testers (the purple hexagon indicates the part of the galaxy where MaNGA can measure spectra). More than half of all the galaxies in MaNGA them are nearby galaxies with lots of structure. I think you’re really going to enjoy exploring them, and at the same time really help us learn a lot about galaxies.


Galaxy Zoo Highlights from 2015
Following on from the excellent summary of the hi-lights in 2015 for the Radio Galaxy Zoo project, here’s a similar post about results from Galaxy Zoo.
This year we collected 4,755,448 classifications on 209,291 different images of galaxies. You continue to amaze us with your collective efforts. Thank you so much for each and everyone of of these classifications.
The year started with Galaxy Zoo scientists at Mauna Kea observing galaxies, and reported in this wonderful series of blog posts by (former) Zooniverse developer Ed Paget.

Ed, Chris, Sandor, and Becky on Mauna Kea.
We celebrated 8 years of Galaxy Zoo back in July, with this blog series of all things 8-like about Galaxy Zoo.

An 8 for our 8th birthday!
Back in May we finished collecting classifications on the last of our Hubble Space Telescope images. At the AAS in Florida this week, Kyle Willett and Brooke Simmons presented posters on the planned data releases for the classifications.
We both launched and finished classifying the first set of images of simulated galaxies from the Illustris Simulation (read more here: New Images for Galaxy Zoo: Illustris and here: Finished with First Set of Illustris Images). We also launched our first set of images from the DECaLS survey, which is using the Dark Energy Camera (New Images for Galaxy Zoo: DECaLS)
We also launched a new Galaxy Zoo side project – Galaxy Zoo Bars (one of the first projects built on the new Zooniverse Project Builder software), measuring bar lengths of galaxies in the distant Universe. The entire set were measured in less than a year, so thank you to any of you who contributed to that, and if you missed it don’t worry, we have plans for more special projects this year.
We launched a new web interface to explore the Galaxy Zoo classifications.
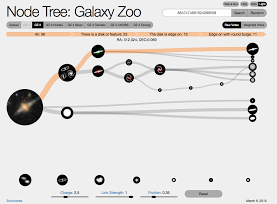
Screenshot of the Visualisation Tool
Our contributions to the peer reviewed astronomical literature continue. Papers number 45-48 from the team were officially published in 2015. They were:
– Galaxy Zoo: the effect of bar-driven fueling on the presence of an active galactic nucleus in disc galaxies, Galloway+ 2015.
– Galaxy Zoo: Evidence for Diverse Star Formation Histories through the Green Valley, Smethurst+ 2015.
– Galaxy Zoo: the dependence of the star formation-stellar mass relation on spiral disc morphology, Willett+ 2015.
You can access all 48 team papers using your classifications at the Zooniverse Publication Page. Remember that all Zooniverse papers published in the Monthly Notices of the Royal Astronomical Society – which includes most of the Galaxy Zoo papers – are available open access to any reader, and if we happen to publish elsewhere we always make the post-acceptance version available on the arxiv.org.
All of our papers include a version of this acknowledgement to our classifiers: “The data in this paper are the result of the efforts of the Galaxy Zoo volunteers, without whom none of this work would be possible. Their efforts are individually acknowledged at authors.galaxyzoo.org.” We all hope you all know how grateful we are for each and every one of your classifications.
This year saw publication of the first paper on Hubble observations of Voorwerpje systems accompanied by an HST press release.
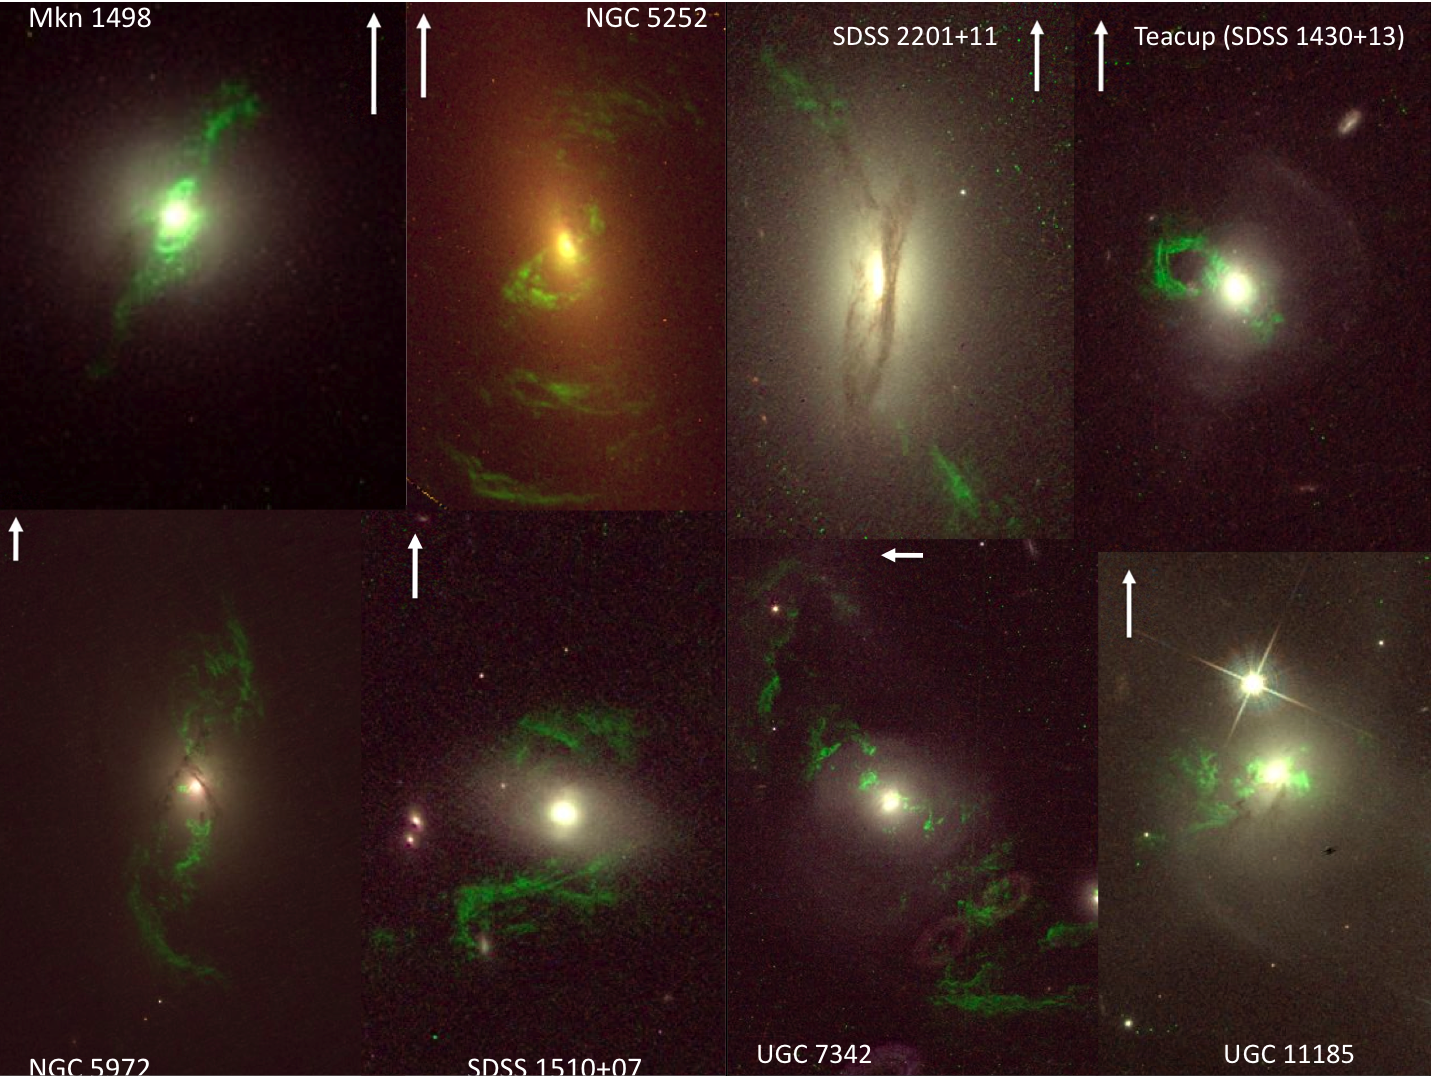
Montage of Hubble images of Voorwerpjes
One of those papers from (mostly) outside the GZ team discussed a rare examples of double radio sources from spiral hosts, something Radio Galaxy Zoo will find many more of: “J1649+2635: a grand-design spiral with a large double-lobed radio source”, Mao et al. 2015.
Another exciting thing about this year has been the number of papers from non team members using the classifications which are now public (see data.galaxyzoo.org). To date almost 300 astronomical papers have been written which cite the original description of Galaxy Zoo (Lintott et al. 2008) and the two data release papers so far (Lintott et al. 2011 for GZ1 and Willett et al. 2013 for GZ2) have 164 and 34 citations respectively. The number of papers in the Astrophysics Data System which contain the words “Galaxy Zoo” (which you can search in ADS Labs) is an astonishing 700 (409 for refereed publications).
These are just some of the high-lights I’ve pulled together. If I’ve missed your favourite feel free to add it in the comments below. All in all it’s been a great year. Here’s to an equally good 2016!
Summer Research With Galaxy Zoo
The below blog post was written by Alex Todd, an Ogden Summer Intern who spent the summer working on Galaxy Zoo related research projects at the University of Portsmouth. Alex is now off to his next adventure – starting his undergraduate degree in Natural Sciences at the University of Bath.

Alex hard at work on his Galaxy Zoo project.
I have been working with the Galaxy Zoo team at the Institute of Cosmology and Gravitation, in Portsmouth, for 8 weeks this summer. I have been analysing the results of Galaxy Zoo 2, and more specifically the region of the sky known as Stripe 82. In this area, the Sloan Digital Sky Survey (SDSS) took many images of the same patch of sky, instead of only one. These images were combined to produce a single, higher quality image, which showed fainter details and objects. Both these deeper images and the standard depth images of stripe 82 were put into galaxy zoo, and I have been comparing the resulting classifications. I learned to code in python, a programming language, and used it to produce graphs from the data I downloaded from the Galaxy Zoo website. I started by comparing the results directly, comparing the number of people who said that the galaxy had features in each of the image depths.

On the graph, each blue dot is a galaxy (there are around 4,000) and the red dashed line shows the overall trend. As you can see from the graph, when the proportion of people who see features is low, there is a good match between the two image depths. However, when the proportion is high, there is a much bigger difference between the two image depths, with the proportion being higher in the deep image. This is because fainter features are visible in the deeper image.
I then plotted graphs of the difference between the proportions (P(Features)) against the brightness of the galaxy. To measure the brightness, I used the apparent magnitude, a measure of how bright the galaxy appears to us (as opposed to how bright it actually is).
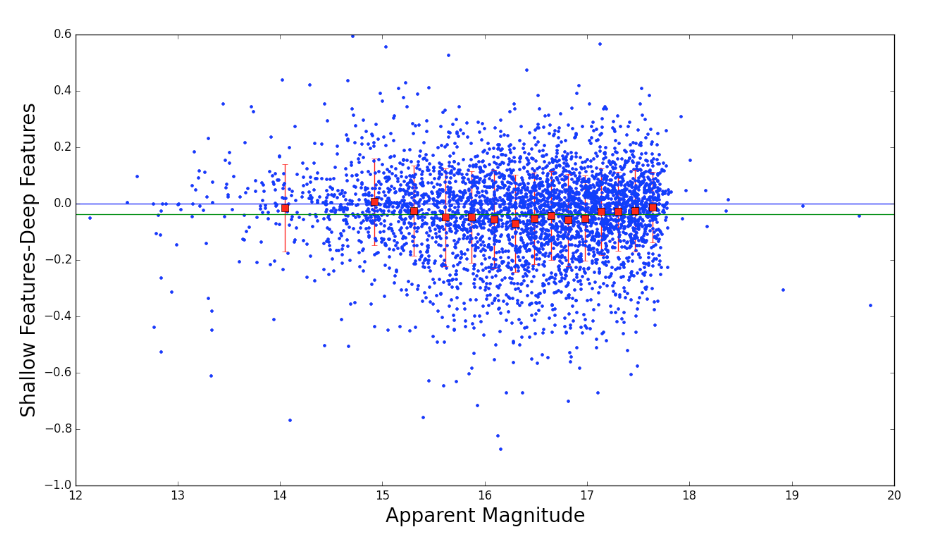
The graph below shows the difference in P(Features) plotted against the apparent magnitude. The blue line is at y=0, and the green line represents the average value of the difference between P(Features). As you can see, there is not much difference between the values of P(Features) when the galaxy is particularly bright (Small apparent magnitude) or when it is particularly dim (large apparent magnitude). However, when the galaxy has an average brightness, the difference is quite substantial. We think this is because in bright galaxies, features can be seen in both images, whilst in dim galaxies they can be seen in neither. In medium brightness galaxies, however, they can only be seen in the deeper image. The fact that there are differences between the classifications means that it would be a good idea to classify deeper images of the rest of the sky, to hopefully improve the accuracy of the classifications.
I have greatly enjoyed my time working on at the ICG on galaxy zoo, and would certainly seize the opportunity to pursue it further.
It’s been a pleasure working with Alex this summer. He really impressed me with the speed at which he picked up programming languages. This information about the differences in perception of morphological features between deeper and shallower images is very useful to us as a science team as we plan for future generations of the Galaxy Zoo project with new, more sensitive images from current and ongoing astronomical surveys.
Eight years and 8 billion years of cosmic history
Next up in our series of eight blog posts celebrating eight years of Galaxy Zoo is this post from Tom Melvin, who was the lead author of the the first publication from Galaxy Zoo: Hubble, which looked at how the fraction of barred disk galaxies has evolved over the last eight billion years. Tom is also the first person to write a PhD thesis substantially based on Galaxy Zoo classifications, which he is in the process of completing final corrections for.

Barred disc galaxies at high redshift identified by Galaxy Zoo Hubble. The redshift (‘z’) and the fraction of volunteers identifying a bar (‘Pbar’) are noted in each image.
This was the first time the Galaxy Zoo volunteers had been asked to classify galaxies taken by the Hubble Space Telescope, which provided beautiful images of galaxies whose light has taken up to eight billion light years to reach us!
With your classifications, we were able to select a sample of disk and barred disk galaxies, as shown above in Figure 1, and explore how the fraction of disk galaxies that are barred has evolved over the last eight billion years. We found that this bar fraction has been increasing as the Universe has grown older, doubling from 11% eight billion years ago to 22% four billion years ago, which is shown below in Figure 2. We also know from Galaxy Zoo 2 that this continues to increase, with around one third of disks having a bar in our local Universe. We were able to expand on this by showing that it was the most massive disk galaxies that were the driver of this evolution.
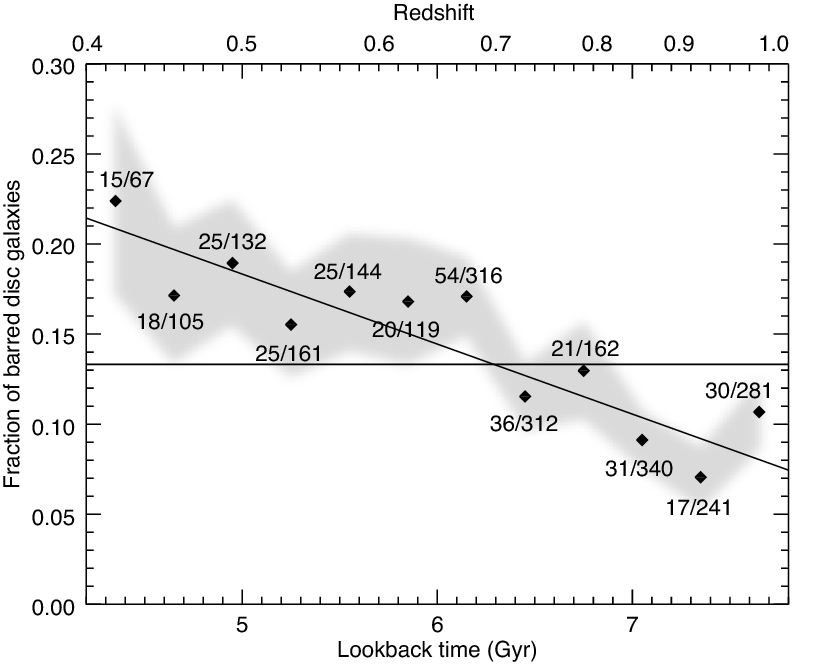
Redshift evolution of the fraction of barred disc galaxies. Each point represents the observed bar fraction in a 0.3 Gyr bin, with the number of barred disc galaxies and total number of disc galaxies indicated. The grey shaded region indicates the error on the measurement. We show the mean bar fraction for the whole sample (fbar = 13.3 ± 0.7%) as the horizontal dot-dashed line, as well as a linear relationship between the bar fraction and the lookback time which is shown by the solid line.
As bars tend to only form in disk galaxies that are settled and relaxed, or ‘mature’, our results showing an increasing bar fraction over the last eight billion years tells us that the disk galaxy population has matured as the Universe has aged. As this evolution is being driven by the most massive disk galaxies, we were able to conclude that the most massive disk galaxies become mature sooner than their lower mass counterparts.
In addition to these results, we were able to identify a population of ‘red spiral’ galaxies thanks to your classifications. These red spirals’ would typically be omitted from other disk samples, as they would be classified as elliptical galaxies – but as you can see below, these are clearly beautiful red spiral galaxies! What is interesting about this population of disks is that their bar fraction of 45% is much higher than the bar fraction of the whole disk sample, which is roughly 14%.

Images showing 3 unbarred (images a − c) and 3 barred (images d − f) “red spiral” galaxies from Galaxy Zoo Hubble.
So, thanks to your help classifying the amazing images from the Hubble Space Telescope, we were able to track the evolving bar fraction of disk galaxies over the last eight billion years. There is plenty more to be done with this sample of galaxies, so keep an eye out for future results looking at how galaxies have evolved over the past eight billion years!
