
Eight Years and the 8 Most Talked-About Galaxies in Galaxy Zoo

Continuing the countdown to Galaxy Zoo’s 8th birthday, below are 8 of the most-commented-on galaxies in the active Galaxy Zoo. They range near (in astronomical terms) and far, from gorgeous disks to space-warping groups, and some of them aren’t even galaxies at all!
8. Galaxies Interacting (Arp 112)

#merger #arc #g-pair #bulge #tidaltails #ugc #wow #agn #ngc #ngc7806 #arp #markarian #dustlane #available_in_dr7 #spiral #gpair #awesome #tidal #lens #no_lens
A lovely example of the diversity of structures in the Universe. The central galaxy may have been a perfectly symmetric spiral before it was seriously disturbed by the elliptical galaxy on the left side of the shot, and what’s that wispy thing off to the right? Is it a former part of the central galaxy? And what is this all going to look like in a few billion years? Whatever happens, the volunteers made it clear this is a special one to classify and to look at.
#lens #lensing #knownlens #arc #lense #interesting
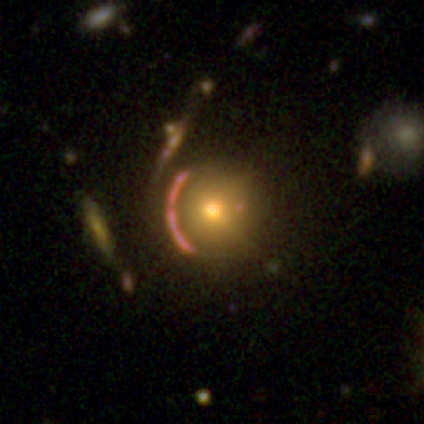
This gorgeous gravitational lens was spotted almost immediately upon the launch of the new Galaxy Zoo within the high-redshift CANDELS data. It generated multiple lively discussions and scientists and volunteers alike weighed in with further information. It turned out in this case that this was one of very few lenses that were already known, but there are likely still unknown lenses buried in the data, waiting to be discovered!

#quasar #edge #lbg #star
Initially identified as a high-redshift star-forming galaxy by one of our seasoned volunteers, a number of people subsequently looked further into the existing scientific literature. There was a lot of debate about this particular point of light, but in the end the volunteers uncovered a later paper confirming that this green gem (which would actually be either very red or nearly invisible to the human eye, as it’s “green” because it only shows up in the infrared filters used for this image) is actually just a star in our galaxy. Bummer, maybe, but this process is also an important part of science.

#dustlane #polar #polarring #beautiful #polar-ring #elliptical #ring #edgeon #mothership #dust #polaring #question
This spectacular example of a polar ring galaxy couldn’t have been found in the original Galaxy Zoo or Galaxy Zoo 2, because it only made it into the Sloan Digital Sky Survey when the sky coverage was extended.

#merger #arp148 #arp #available_in_dr7 #lookalike #alphabet #ring
It takes a special kind of galaxy crash to make a collisional ring, and you can see this one in progress. It reminded our volunteers and scientists of the Cartwheel galaxy, another spectacular example of these snapshots of a brief moment in time.

#merger #odd #dark #needle #holycow #wow #doublenucleus #tidaldebris #disturbed #rocket #cluster #irregularshape #spaceship #rocketship
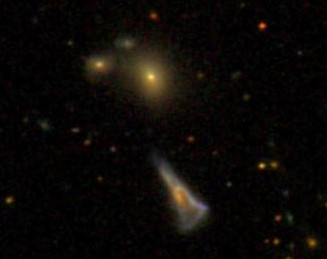
Well, this is odd. This galaxy looks like it’s on its own, but it has a rather unusual shape that would usually imply some sort of interaction or collision. Our volunteers discussed what could be causing it – until they viewed a zoomed-out image and it became clear that this galaxy has recently flown by a trio of galaxies, which would be more than enough to disrupt it into this lovely shape.
2. Hubble Resolves the Distant Universe

#spiral #overlap #dustlane #starburst #edge-on #edgeon
When a new batch of data taken by the Hubble Space Telescope appeared on the latest Galaxy Zoo, this was one of the first stunners remarked on by several people. Some of the parts of the sky covered by Hubble coincide with the Sloan Digital Sky Survey, and we linked the surveys up via Talk. Our tireless volunteers launched a thread collecting side-by-side images from SDSS and Hubble, showcasing the power of the world’s greatest space telescope. Hubble’s primary mirror is about the same size as that used by the SDSS, so the differences between the images of the same galaxy are due to the blurring effect of the atmosphere.

SDSS (on Earth) at left, HST (in space) at right.
And, the most talked about image in the latest Galaxy Zoo is…

It’s always the galaxies you least expect.
Okay, okay… If you saw this and said it looks like there isn’t a lot to talk about here, I wouldn’t blame you. And, indeed, there’s only one “short” comment from one of our volunteers, who used our Examine tools and discovered that this little blotch appears to be a very high-redshift galaxy.
However, that same volunteer also started a discussion with the question: just for fun, what’s the highest redshift you’ve found? Others responded, and thus began a quest to find the galaxy in Galaxy Zoo that is the farthest distance from us. This discussion is Galaxy Zoo at its finest, with new and experienced volunteers using the project as inspiration for their own investigations, scouring the scientific literature, and learning about the very early Universe.
It seems like the most likely known candidate so far is a quasar at a redshift of about 5.5 (at which point the Universe was about 1 billion years old), or, if you don’t think a quasar counts, an extended galaxy at z = 4 or so (1.5 billion years old). But there’s just so much science wonderfulness here, all of it from our fantastic volunteers, and it all started with a patchy blob and a sense of curiosity.
Galaxy Zoo started with a million blobs (ish) and a sense of adventure. I think that’s fitting.
Quench Boost: A How-To-Guide, Part 4
Now that we’ve been initiated into the cool waters of Tools (Part 1), we’ve compared our *own* galaxies to the rest of the post-quenched sample (Part 2), and we’ve put your classifications to use, looking for what makes post-quench galaxies special compared to the rest of the riff-raff (Part 3), we’re ready for Part 4 of the Quench ‘How-To-Guide’.
This segment is inspired by a post on Quench Talk in response to Part 3 of this guide. One of our esteemed zoo-ite mods noted:
There are more Quench Sample mergers (505) than Control mergers (245)… It seems to suggest mergers have a role to play in quenching star formation as well.
Whoa! That’s a statistically significant difference and will be a really cool result if it holds up under further investigation!
I’ve been thinking about this potential result in the context of the Kaviraj article, summarized by Michael Zevin at http://postquench.blogspot.com/. The articles finds evidence that massive post-quenched galaxies appear to require different quenching mechanisms than lower-mass post-quenched galaxies. I wondered — can our data speak to their result?
Let’s find out!
Step 1: Copy this Dashboard to your Quench Tools environment, as you did in Part 3 of this guide.
- This starter Dashboard provides a series of tables that have filtered the Control sample data into sources showing merger signatures and those that do not, as well as sources in low, mid, and high mass bins.
- Mass, in this case, refers to the total stellar mass of each galaxy. You can see what limits I set for each mass bin by looking at the filter statements under the ‘Prompt’ in each Table.
Step 2: Compare the mass histogram for the Control galaxies with merger signatures with the mass histogram for the total sample of Control galaxies.
- Click ‘Tools’ and choose ‘Histogram’ in the pop-up options.
- Choose ‘Control’ as the ‘Data Source’.
- Choose ‘log_mass’ as the x-axis, and limit the range from 6 to 12.
- Repeat the above, but choose ‘Control – Merging’ as the ‘Data Source’.
The result will look similar to the figure below. Can you tell by eye if there’s a trend with mass in terms of the fraction of Control galaxies with merger signatures?
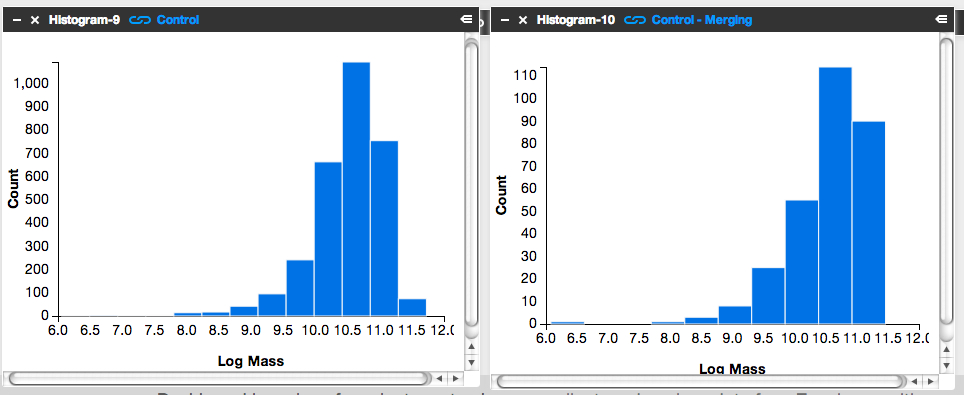
It’s subtle to see it in this visualization. Instead, let’s look at the fractions themselves.
Step 3: Letting the numbers guide us… Is there a higher fraction of Control galaxies with merger signatures at the low-mass end? At the high-mass end? Neither?
To answer this question, we need to know, for each mass bin, the fraction of Control galaxies that show merger signatures. I.e.,
![]()
Luckily, Tools can give us this information.
- Click on the ‘Control – Low Mass’ Table and scroll to its lower right.
- You’ll see the words ‘1527 Total Items’.
- There are 1527 Control galaxies in the low mass bin.
- Similarly, if you look in the lower right of the ‘Control – Merging – Low Mass’ Table, you’ll see that there are 131 galaxies in this category.
- This means that the merger fraction for the low mass bin is 131/1527 or 8.6%.
- Find the fraction for the middle and high mass bins.
Does the fraction increase or decrease with mass?
Step 4: Repeat the above steps but for the post-quenched galaxy sample.
You may want to open a new Dashboard to keep your window from getting too cluttered.
Step 5: How do the results compare for our post-quenched galaxies versus our Control galaxies? How can we best visualize these results?
- In thinking about the answer to this question, you might want to make a plot of mass (on the x-axis) versus merger fraction (on the y-axis) for the Control galaxies.
- On that same graph, you’d also show the results for the post-quenched galaxies.
- To determine what mass value to use, consider taking the median mass value for each mass bin.
- Determine this by clicking on ‘Tools’, choosing ‘Statistics’ in the pop-up options, selecting ‘Control – Low Mass’ as your ‘Data Source’, and selecting ‘Log Mass’ as the ‘Field’.
- This ‘Statistics’ Tool gives you the mean, median, mode, and other values.
- You could plot the results with pen on paper, use Google spreadsheets, or whatever plotting software you prefer. Unfortunately Tools, at this point, doesn’t provide this functionality.
It’d be awesome if you posted an image of your results here or at Quench Talk. We can then compare results, identify the best way to visualize this for the article, and build on what we’ve found.
You might also consider repeating the above but testing for the effect of choosing different, wider, or narrower mass bins. Does that change the results? It’d be really useful to know if it does.
Galaxy Merger Gallery

I’m Joel Miller, I’m just about to start year 13 at The Marlborough School, Woodstock, and I am here at Oxford University working on mergers from the Galaxy Zoo Hubble data as part of my Nuffield Science Bursary. I have/will be looking at the data and plotting graphs to see how the fraction of galaxies which are mergers changes with other factors therefore determining if there is a correlation between these factors and galaxy mergers. Having looked though many images of merging galaxies I found some really amazing ones.


With some of the images from the SDSS I was able to find high-res HST images of the same galaxy and also find out some more information about them.

Spiral Galaxies NGC 5278 and NGC 5279 (Arp 239) in the Constellation of Ursa Major form an M-51-like interacting pair. This group is sometimes called the “telephone receiver”. The galaxies are not only connected via one spiral arm like M-51, but they also have a dimmer bridge between their disks. Spiral galaxies UGC 8671 and MCG +9-22-94 do not have measured red shifts and therefore there is no data on their distances. They may well be a part of a small cluster of galaxies that includes the “telephone receiver”, but this is not determined at this time.
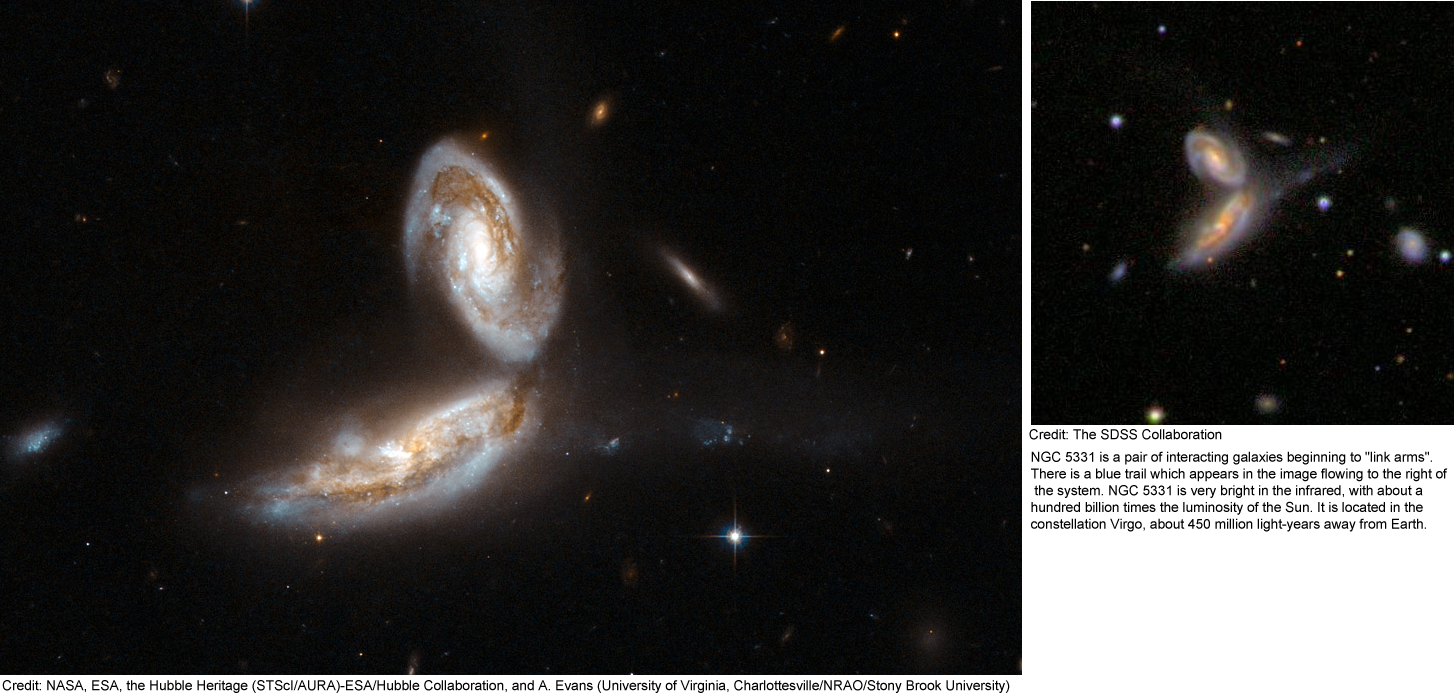
NGC 5331 is a pair of interacting galaxies beginning to “link arms”. There is a blue trail which appears in the image flowing to the right of the system. NGC 5331 is very bright in the infrared, with about a hundred billion times the luminosity of the Sun. It is located in the constellation Virgo, about 450 million light-years away from Earth.

This pair of Spiral Galaxies in Virgo is known as “The Siamese Twins” or “The Butterfly Galaxies”. Both are classic spiral galaxies with small bright nuclei, several knotty arms, and arm segments. Both also have a hint of an inner ring. The pair is thought to be a member of the Virgo Galaxy Cluster. NGC 4568 is currently the host galaxy of Supernova 2004cc (Type Ic) and was also the host of Supernova 1990B a Type Ic that reached a maximum magnitude of 14.4.

Arp 272 is a collision between two spiral galaxies, NGC 6050 and IC 1179, and is part of the Hercules Galaxy Cluster, located in the constellation of Hercules. The galaxy cluster is part of the Great Wall of clusters and superclusters, the largest known structure in the Universe. The two spiral galaxies are linked by their swirling arms and is located about 450 million light-years away from Earth.

This galaxy pair (Arp 240) is composed of two spiral galaxies of similar mass and size, NGC 5257 and NGC 5258. The galaxies are visibly interacting with each other via a bridge of dim stars connecting the two galaxies. Both galaxies have supermassive black holes in their centres and are actively forming new stars in their discs. Arp 240 is located in the constellation Virgo, approximately 300 million light-years away, and is the 240th galaxy in Arp’s Atlas of Peculiar Galaxies.
With the exception of a few foreground stars from our own Milky Way all the objects in this image are galaxies.
Chandra X-ray Observations of Mergers found in the Zoo Published
I hope you all had clear skies during the Transit of Venus. If not, it’ll be over a hundred years before you get another chance…. and in Zoo-related news, the Transit of Venus is an example of one way we find planets around other stars. We look for a dip in the brightness of the star as a planet moves across it from our point of view. Want to know more? Head over to the Planethunters blog, or put in some clicks looking for transits yourself!
So, in actual Galaxy Zoo news, I am very happy to report that the latest Galaxy Zoo study has been accepted for publication in the Astrophysical Journal. As we blogged a while back, we got Chandra X-ray time to observe a small sample of major mergers found by the Galaxy Zoo to look for double black holes. The idea is to look for the two black holes presumably brought into the merger by the two galaxies and see if we find both of them feeding by looking for them with an X-ray telescope (i.e. Chandra).
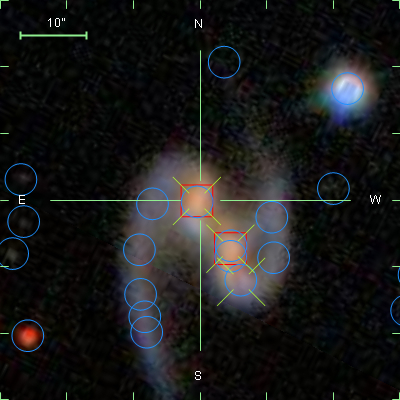
The lead author of the paper is Stacy Teng, a NASA postdoctoral fellow at NASA’s Goddard Space Flight Center and an expert on X-ray data analysis. In a sample of 12 merging galaxies, we find just one double active nucleus.

Image of the one merger with two feeding black holes. The white contours are the optical (SDSS) image while the pixels are X-rays. The red pixels are soft (low energy) X-ray photons, while the blue are hard (high energy) photons. You can see that both nuclei of the merger are visible in X-rays emitted by feeding supermassive black holes.
We submitted the resulting paper to the Astrophysical Journal where it underwent peer review. The reviewer suggested some changes and clarifications and so the paper was accepted for publication.
You can find the full paper in a variety of formats, including PDF, on the arxiv.
So what’s next? We submitted a proposal, led by Stacy, for the current Chandra cycle. To do a bigger, more comprehensive search for double black holes in mergers to put some real constraints on their abundance and properties. We hope to hear about whether the proposal is approved some time later this summer, so stay tuned and follow us on Twitter for breaking news!
The Finale of Merger Zoo
 Working toward Fitness –

Over the last year, we have been pretty quiet at the Merger Wars site. However, we have been extremely busy analyzing the data that you have created. So far, the Merger’s Applet has been used to view over 3 million simulations of interacting galaxies. We have estimated it actually simulated more than 100 million other systems that weren’t viewed by our users.
Of the 3 million simulations viewed, around 60 thousand were selected by the volunteers as interesting. Initially we thought the Evaluate activity within the applet would be sufficient to help us identify the top simulations for each pair of galaxies. However, with millions of simulations to sort through, across tens of thousands of sessions, we discovered that our initial plan was not sufficient. That’s when we decided to add the Merger Wars activity.
In Merger Wars volunteers judge a series of head-to-head competitions to determine which simulation is a better match to the target image of a galaxy merger. Over time, as the simulation competes multiple times, it earns a win/loss record. The percentage of times the simulation has won its competitions can be treated as a fitness value. A value of 1 is a perfect score, all wins, and a value of 0 is a terrible record of all losses. With over 800 thousand Merger Wars competitions judged, our volunteers were able to help us assign a fitness value to each of the 60 thousand selected simulations. These fitness values allowed us to further refine our models for each merger. In total, we identified 290 top simulations for the combined set of 54 pairs of galaxies. However, we need some final help finding the very best model for each system and finding out which collisions have the very best models.
One Orbit to Rule Them All-
Ideally, there would be a single set of orbit parameters to describe the paths the two galaxies take when flying past each other, and eventually towards their ultimate merging into one galaxy. It is difficult for researchers to know for sure if they have found the single best set of parameters. Is there a better set of orbit parameters? Are their multiple sets of equally good parameters? Are there no good sets? We can call this problem the issue of determining uniqueness. The volunteers for Merger Zoo have achieved an unprecedented level of study for each of these 54 systems. Typically researchers will look at a few dozen to a few hundred simulations of interacting galaxies and pick the best orbit from that sample. Together, we’ve reviewed on average over 50 thousand simulations for each pair and selected over 1000 simulations for further study. We’ve taken the multiple sets of orbit parameters identified for each system and examined them to see how well they’ve identified a single, best-fit orbit. When we look at the entire sample, we don’t see a single orbit. However, if we begin to exclude some of the sample by filtering out the low fitness simulations, we see the range of orbit parameters becomes smaller. If we increase the fitness value used in that filter, we continue to see smaller and smaller ranges of values. In this manner, we can say that we see convergence towards a small range of values for each of the orbit parameters. Arp 82, the image from the top of the post, is a good example of this convergence. For each population we show a box plot describing the distribution of the parameter. The box represents the range of data from 0.25 to 0.75 of the population. The horizontal line is the median, and the thin whiskers show the outliers. The populations shown are all states viewed by the users, all states selected by the users, and then several populations filtered by fitness to include the to top 50%, 25%, 10%, 5%, 2%, and finally the top 1% of simulations by fitness. The distribution of values describing the time of closest approach demonstrates some convergence. We see that the applet sampled a range of orbits that had times of closest approach ranging between 60 to 600 million years ago. By the time we filter to just the top 1%, we see the range is now only 100 to 250 million years ago with the likely range of 120 to 162 million years ago. Hancock et al find a time since closest approach of around 200 – 250 million years. The ratio of masses between the two galaxies converges in the same way.


Your Help is Needed-
The big thing we need help with is figuring out THE very best model of each system and comparing models of different systems. The Merger Wars site has a couple of new interfaces that are now posted. They include:
- Pick the Best: find the best model for each system
- Simulation Showdown: comparing the simulations from two different galaxies to find out which systems have the best models
- Merger Wars – HST : the last batch of Merger Wars results from non-Sloan images
- My Mergers: This is a new update that shows your contributions to the project. [Note: you need to be logged in for this link to work.]
After we get this final set of data, we will be archiving the site and writing a set of papers based on this work. However, your help is really needed with this final part of our analysis.
A Zoo of Mergers-
The image below is a combined image of 54 thumbnails showing all of the SDSS galaxy pairs studied in detailed by our Merger Zoo volunteers. Clicking on the image below will take you to our updated Gallery. From that page you can click on each individual thumbnail to see the top simulation results. You have done an amazing job with this project. Thanks so much for your help.

Galaxies Modeled in Merger Zoo
John and Anthony, The Merger Zoo guys
Star-formation, AGN and Ultra-luminous infrared galaxies
An update on mergers from Alfredo:
Star-formation, AGN and Ultra-luminous infrared galaxies (ULIRGs)
Looking at our galaxies in the infrared allows us to discover the overall star-formation rate of the system. Yet if we are interested in the fine details of what really fuel the energetic output of our mergers we need to have a closer look to the light we get from them.
Using a emission lines comparison technique called BPT (after Baldwin & Phillips & Terlevich 1981) we can tell what is really going on at the core of our galaxies.
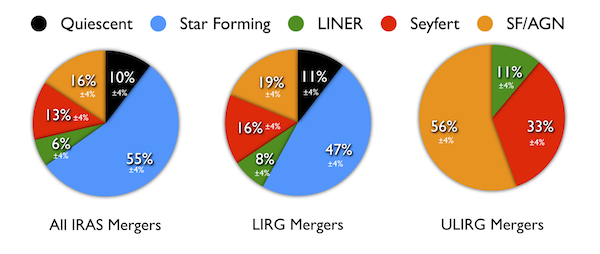
TV News says we don’t see any significant difference between the general IRAS-detected and the Luminous infrared galaxies. However, when we look at the most luminous infrared galaxies, the ULIRGs the fraction of AGN rises dramatically. This result is important because it conforms to many other studies on the role of AGN in ULIRGs.
We also explore the timescale for a LIRG to become a ULIRG. This is obviously an imperfect analysis for various reasons: firstly not all LIRGs turn into ULIRGs, secondly we use Newtonian mechanics in our calculations and lastly our constraints are quite approximate.
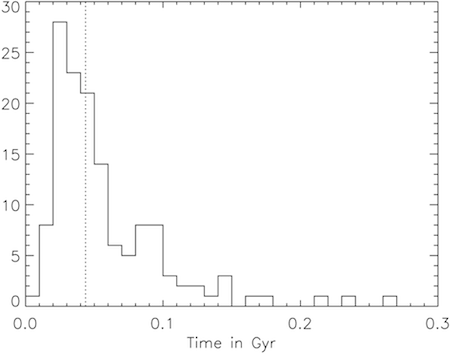
Gyr = gigayear = a billion years
We assume that the Infrared luminosity peaks when the two galaxies coalesce, so we discard all the post-merger LIRGs. Another requirement is that the total mass of the progenitor system is less than the mass of the ULIRGs. We calculate the distance between the two cores and we used a typical group velocity of 400km/s. Under those conditions we find a timescale of 50 million years.
Seeing mergers in a different light
Hello,
My name is Alfredo and I’m a Ph.D. student at Imperial College London. I’ve been asked to write a blog about how we take an idea and turn it into a paper, showing exactly what the man behind the scene does.
I’m working with galaxy mergers so the field from which we are going to pluck our idea has to be that one. Merger properties have been described extremely well by the Galaxy Zoo team, which used the Sloan Digital Sky Survey optical data so we thought it might be interesting looking at the GZ merger catalogue in different wavelengths, specifically in the infrared.
You can study pretty much every object in the infrared because what we call heat is simply the emission of infrared light. If you can measure it’s temperature then it radiates in the infrared. In astronomy infrared radiation allow us to see objects that are not too bright in the visible spectrum (cold stars, gas clouds), to probe regions that are obscure in the optical and to explore the early Universe. Our project will use the infrared fluxes to extrapolate interesting characteristics, mostly to do with the star formation process of the galaxies.

In the past, a huge number of papers have shown that galaxies which were very bright in the infrared ( called LIRGs – Luminous infrared galaxies, U(ltra)LIRGs and H(yper)LIRGs) were mostly mergers or post-mergers. We are going in the opposite direction: since we have a strong visually selected merger catalogue, thanks to your hard work, we can now see what’s the real connection between mergers and warm galaxies.
Spheroidal Post Merger Systems at the AAS
I think Chris said it best – any session which is ended by a guy in a bowtie went well. And for our AAS Galaxy Zoo session, that guy in a bowtie was Alfredo Carpineti from UCL, who talked about his work on the properties of spheroidal post-merger systems selected with the help of the Galaxy Zoo merger classifications, and using a control sample of non-merging spheroidals (or ellipticals) also selected from Galaxy Zoo.
Alfredo provided me with the below description, and his slides are available to download at Carpineti_AAS218talk.pdf.
In this talk we discuss the properties subset of galaxies from the GZ mergers catalogue that are spheroidal ‘post-mergers’, where a single remnant is in the final stages of relaxation after the collision and shows evidence for a dominant bulge, making them plausible progenitors of early-type galaxies.
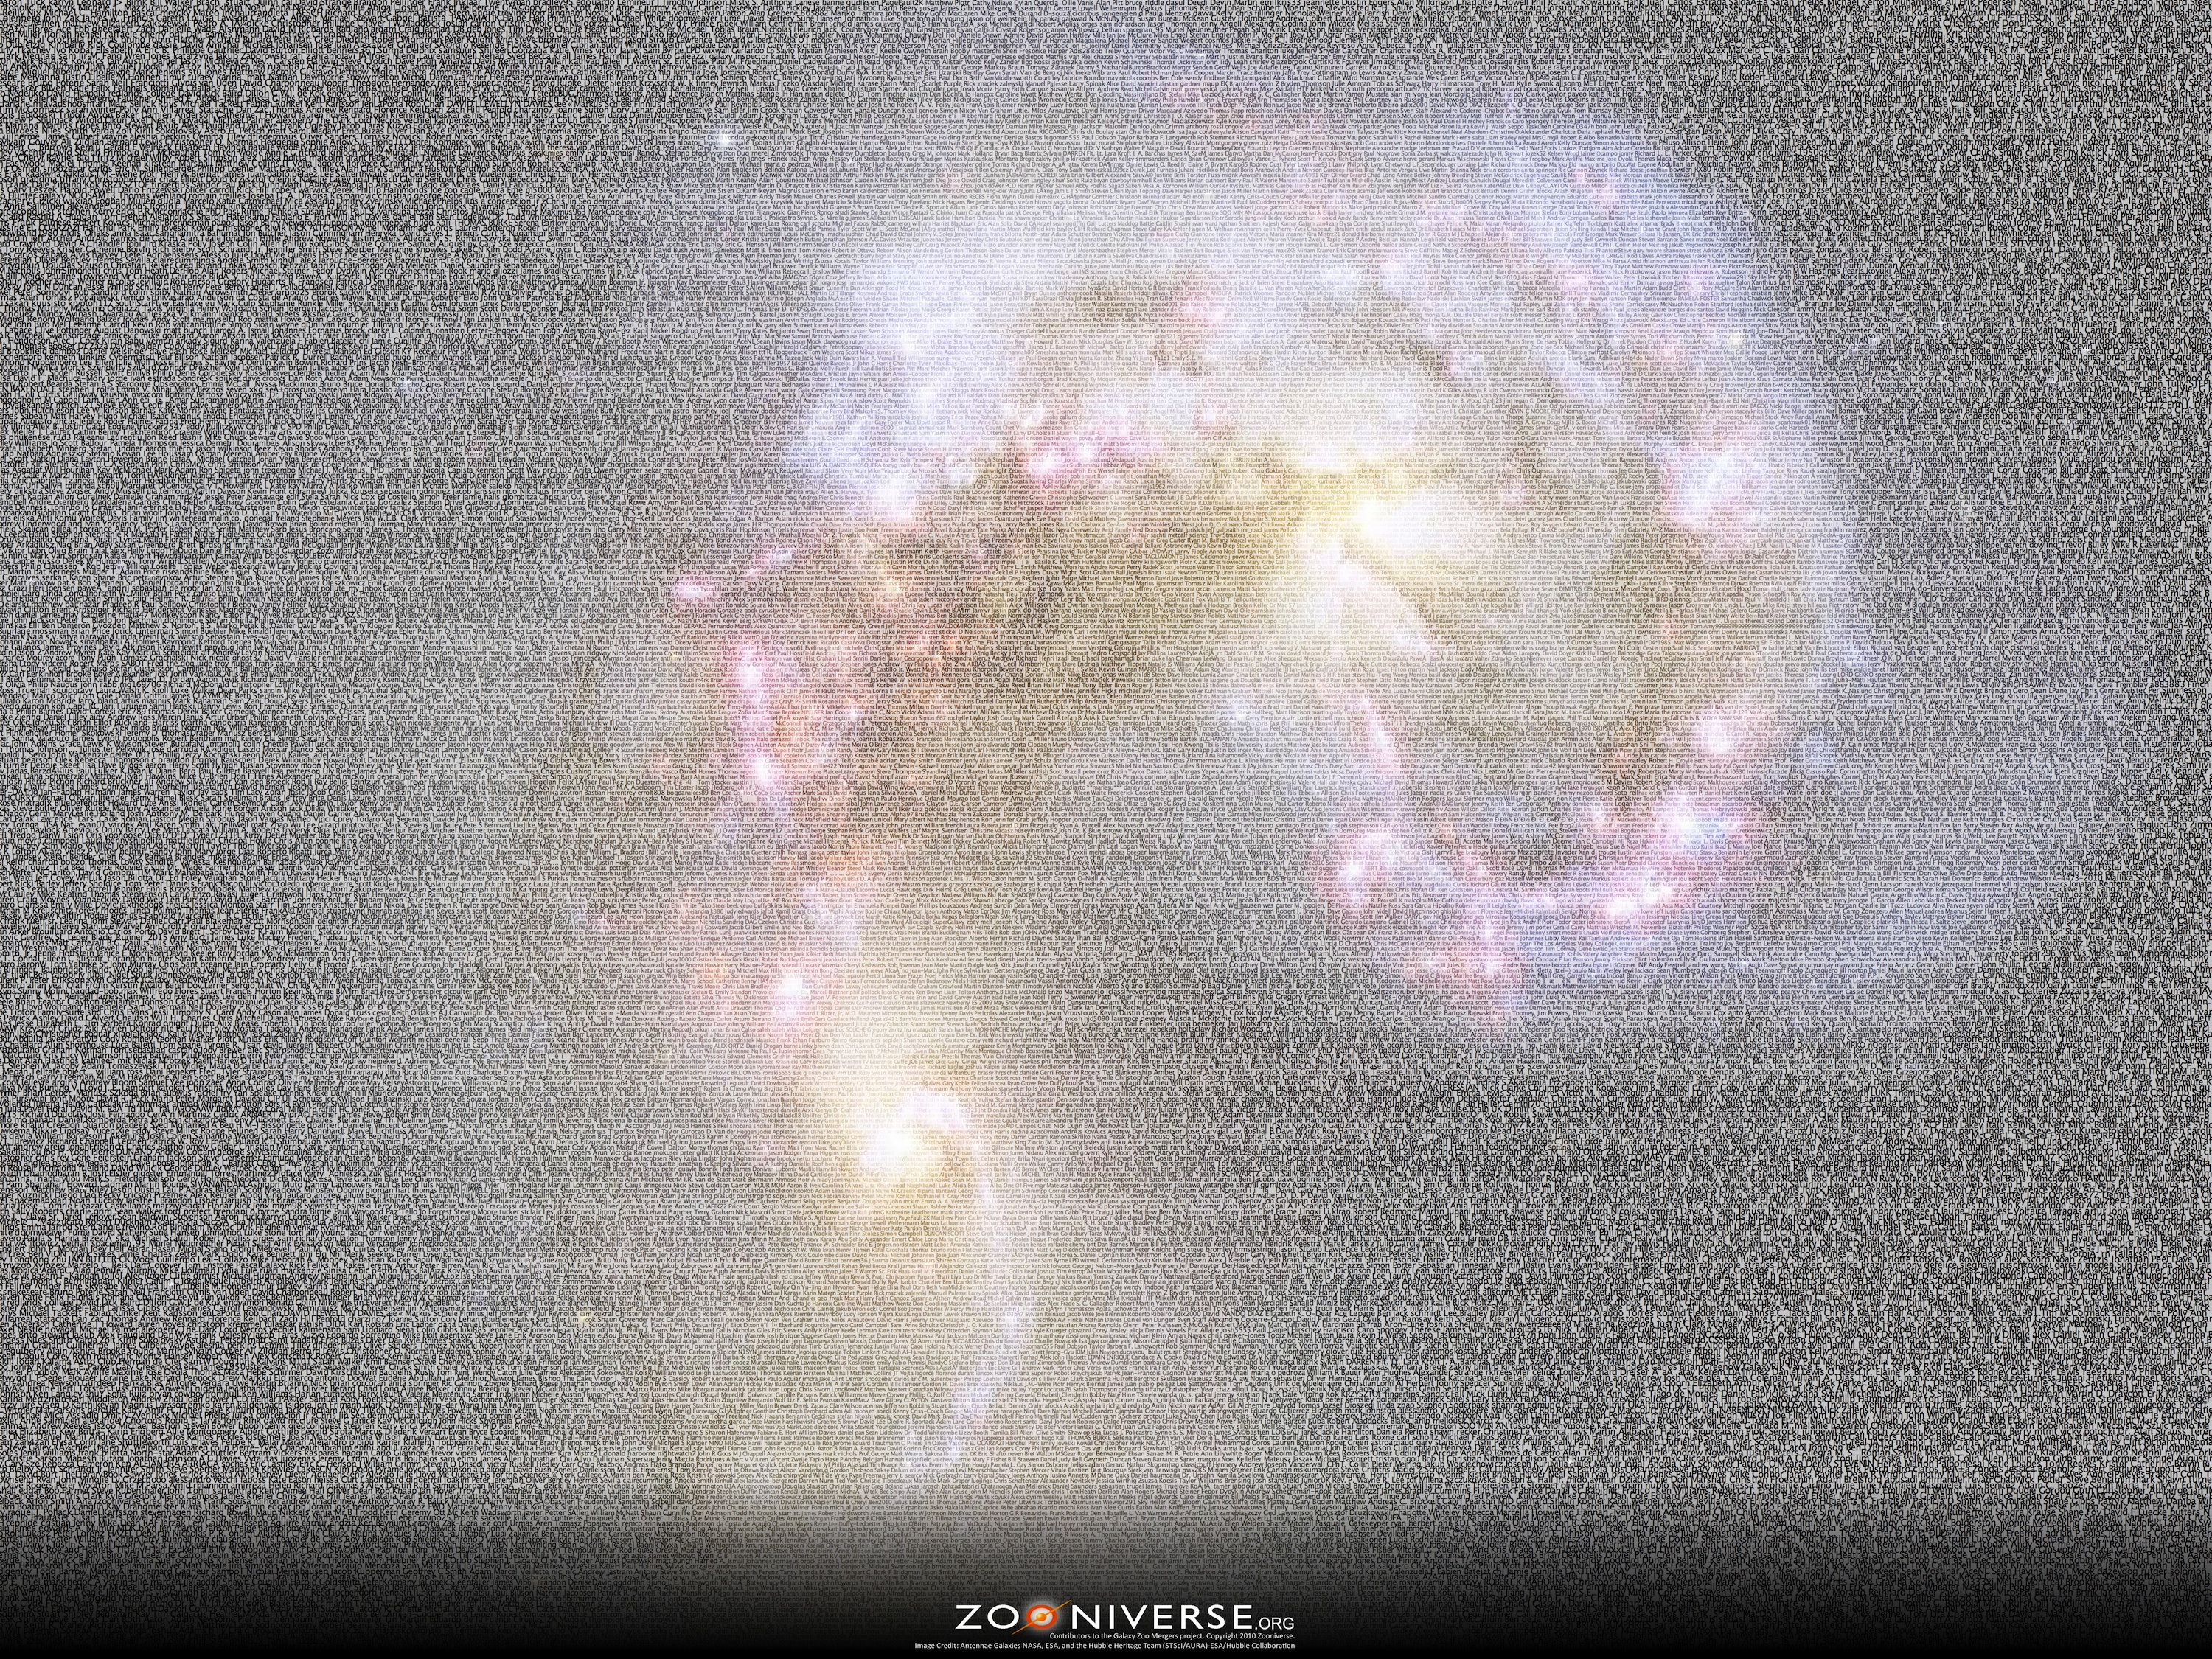
Mergers Author Poster

The final in our series of Zooniverse project posters, created from the names of contributors, is Galaxy Zoo Mergers. The posters features an image of the Antennae Galaxies made up of the names of the 13,000 mergers participants who agreed to have their names published.
You can download the large, 5000-pixel version (15 MB) or the smaller 3,000-pixel version (6 MB).
Galaxy Zoo Multi Mergers
Our latest merger paper is called “Galaxy Zoo: Multi-Mergers and the Millennium Simulation.” We used the original catalogue of 3003 mergers from the previous mergers study to find the interesting subset of systems with three or more galaxies merging in a near-simultaneous manner. We found 39 such multi-mergers (which you can see in the image below) and from this we estimated the relative abundance of such multi-mergers as being ~2% the number of binary mergers (which were themselves ~3% the number of isolated ‘normal’ galaxies). We also examined the properties of these galaxies (colour, stellar mass and environment) and compared them to the properties of galaxies in isolated and binary-merger galaxies; we found that galaxies in multi-mergers tend to be more like elliptical galaxies on average: they’re large, red and in denser environments.

Describing what we see in the world is all well and good, but the equally important thing in science is to compare what we see with what others have claimed to see or to have predicted through theory. Since ours is effectively the first such catalogue of multi mergers, there simply are no other observational sets to compare to. We therefore compared these merger fractions and galaxy properties to a large and well-known simulation called the Millennium Run. This is a cosmic scale simulation of Dark Matter that starts off smoothly distributed (similar to the CMB) within a 500 Mpc box and, over time, clumps together to form structures. Now, galaxies are of course made out of normal matter, so to model how galaxies form and evolve within the Dark Matter, one can take the resulting clumps of Dark Matter from the simulation and, using sensible sounding rules (e.g. bigger Dark Matter clumps get more normal matter because they’ll gravitationally attract more), come up with predictions for numbers of stars formed within the simulation (and where, when, etc.). This means that one can create (with enough fiddling) predictions of what galaxies will look like in such a Dark Matter dominated Universe. These are called ‘Semi-Analytic Models’ and are an important strategy for simulating the Universe since computers would struggle to compute the many many additional interactions between particles in a full N-Body simulation with both Dark Matter and normal matter (Dark Matter is relatively easy since it only feels the 1/r^2 force of gravity).
So what we did in the paper was to compare the results of our multi-merger galaxies to those of the Semi-Analytic Models in the Millennium Simulation (double ‘n’ because it’s a largely German initiative). This is a good test of the Semi Analytic Models because there is no way they could have been fiddled to get the right answer because ours is the first such observational constraint on what multi-mergers look like. And what we found is that the Simulation did rather well – it predicted the relative abundance of multi-mergers to within a few percent and it predicted that galaxies in these systems should have properties more like a typical elliptical rather than a typical spiral. This gives us independent confidence that these Simulations are on the right track and that the assumptions that went into them are sensible ways to get at how the Universe behaves.
In the future, the Galaxy Zoo interface might well allow users to indicate the presence of multi-mergers!
Many thanks to you all for your help in making this interesting study happen.
