
Galaxy Zoo + Galaxy Zoo: 3D
Hi! I’m Tom, and I’m a PhD student at the University of Nottingham, doing some research to try to understand how spiral galaxies have grown and changed over their lifetimes. I’m especially interested in looking at how the spiral arms have been affecting the galaxy as a whole. I’ve recently finished up a paper in MNRAS in which I’ve been demonstrating a couple of new methods using some Galaxy Zoo data.
Amelia has already written [ https://blog.galaxyzoo.org/2018/07/17/finding-bars-in-galaxy-zoo-3d/ ] about how she is using the MaNGA survey [ https://www.sdss.org/surveys/manga/ ] to try to understand what’s happening in bars, so I won’t go into too much detail about this fantastic survey. I’ll just say that it’s part of the Sloan Digital Sky Survey, and for each of its sample of 10,000 galaxies, we have measurements of the spectrum at every position across the face of the galaxy.
MaNGA is really useful for trying to understand how galaxies have grown to their current size, because it is possible to get some sort of estimation of what kinds of stars are present in different locations of the galaxy. It’s a difficult thing to measure, so we can’t say exactly how many of every different type of star is present, but we can at least get a broad picture of the kinds of stellar ages and chemical enrichment (“metallicity”) in the stars. Astronomers have used these kinds of tools to measure the average age or metallicity of stars in different parts of galaxies, and found that in most spirals, the further out you go in the galaxy, the younger the stars are on average. The usual interpretation of this is that bulges tend to have formed first, and the disks have grown in size over time afterwards.

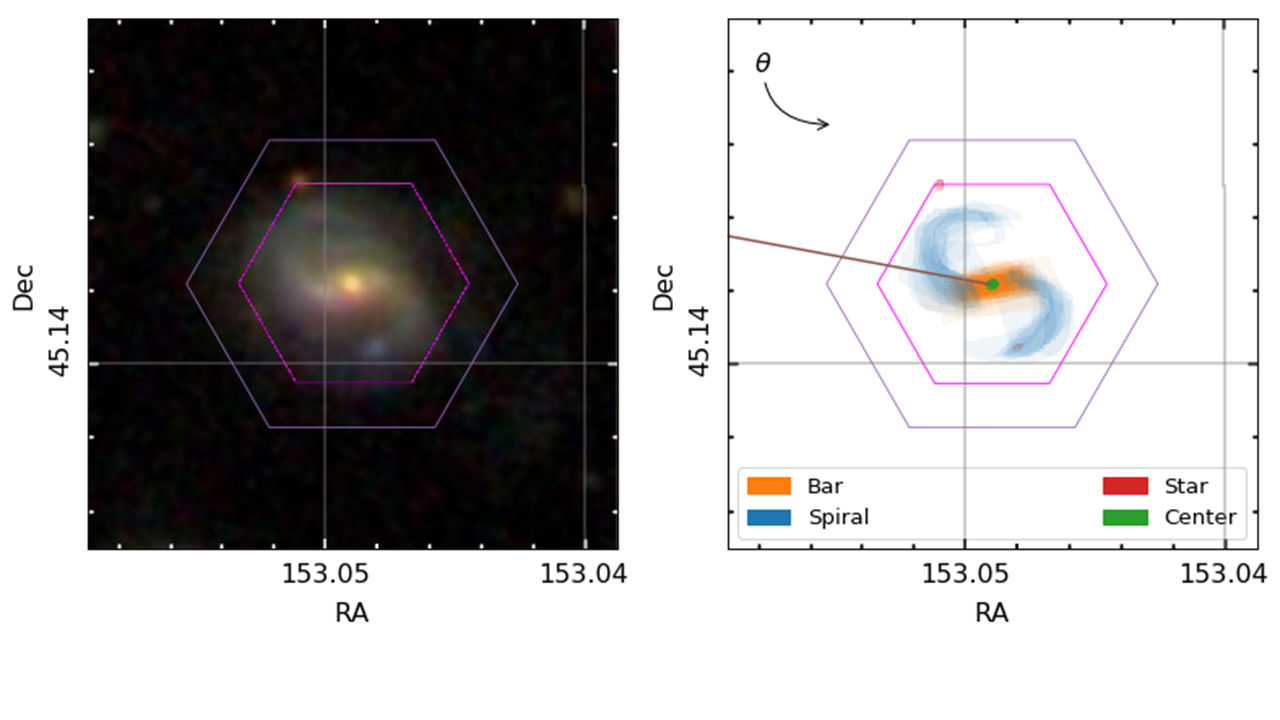
A MaNGA spiral galaxy. We can obtain information about the kinds of stars residing across the hexagonal area, which helps us understand how they’ve grown and evolved.
I’m really interested in trying to push this picture in two ways. Firstly, I’ve been trying to see what we can learn from looking at the general distribution of stars of different ages and metallicities – not just the average properties – at each location in the galaxy. Secondly, I think there is a lot of information that we risk ignoring by only looking at how things change with galactic radius. Spiral arms and the bar aren’t evenly distributed around the galaxy, so if we can see how the stellar properties change as we move around the galaxy, we should be able to measure what effect the spiral arms and bars have on the stars. The goal would be to try to confirm whether the most popular models of the nature of spiral arms and bars are correct or not.
To properly do this, we need to know exactly where the spiral arms and bars are in the MaNGA galaxies, so that we can see how the stars vary in these different regions. Enter Galaxy Zoo: 3D, where volunteers are asked to tell us where the different components are.
An example galaxy in MaNGA, where we’ve managed to split the galaxy into different stellar populations of different ages. Each frame shows where we find stars of a given age in this galaxy, starting from the oldest stars and finishing with the most recently formed stars. The colour denotes the mean metallicity of the stars, shown by the scale at the bottom.
All of this is what my most recent publication is about (read it in full at https://doi.org/10.1093/mnras/stz2204); we’ve shown that by combining the full spatial information available from MaNGA (augmented by Galaxy Zoo:3D) with the full distributions of the ages and metallicities of stars in each location, we can start to see some interesting things in the bar and spiral arms. It’s definitely best illustrated by an animation.
By splitting the age distributions up into different “time-slices”, we can create images of where stars of different ages are located in each of our MaNGA galaxies. Immediately from this one example, it’s obvious that there’s a lot of things going on here.
There are a few features in the animation that we’re not entirely convinced are real, but the main exciting things are that the spiral arms only show up in the youngest stars, and the bar grows and rotates as we move from older to younger stars. The growth of the bar is intriguing; this might be showing us how it formed. The bar changing with angle is even more exciting, and we think it shows us how quickly new-born stars become mixed and “locked” into the bar. The arms show what we should expect; spiral arms are areas of intense star formation, but over time the stars formed there will become mixed around the disk. We measured this effect by looking at what fraction of stars of each age are located in the volunteer-drawn spiral arms from Galaxy Zoo:3D.
This is really interesting, and highlights the power of combining large surveys like MaNGA with crowd-sourced information from the Zooniverse.
The next step is to do these kinds of things with more than just this one galaxy though. I’ve started looking at how these techniques can measure how fast the disks of spiral galaxies grew, using a large sample of spiral galaxies identified by Galaxy Zoo 2 volunteers. I’m also trying to measure how quickly stars get mixed away from spiral arms in different types of spiral galaxies. I have started to find some hints of some exciting results on both of these topics, which I would love to share in a future blog post if you’re interested.
We need volunteers to tell us where the spiral arms and bars are in galaxies, so that we can start to see what makes these regions special.
However, I’m currently limited in the number of galaxies with spiral arm regions identified by Galaxy Zoo:3D volunteers, so it would be really helpful if we could get some more! Understanding what makes spiral structure appear in disky galaxies is one of the unsolved problems in galaxy evolution and formation, and the clues to finding out might well lie in measuring how spiral arms affect the galaxy’s stars. Galaxy Zoo:3D will definitely be able to play a role in this! Help us out at https://www.zooniverse.org/projects/klmasters/galaxy-zoo-3d.
Galaxy Zoo and undergraduate research: spiral arms, colors, and brightnesses
The guest post below is by Zach Pace, an undergraduate physics student at the University of Buffalo. Zach worked at the University of Minnesota during the summer of 2013 through the NSF’s Research Experience for Undergraduates (REU) program. Zach is continuing to work with Galaxy Zoo data as part of his senior thesis.
Hi, everyone–
My name is Zach Pace. I’m an undergraduate physics student from the University at Buffalo, and I’ve been working on the Galaxy Zoo 2 project at the University of Minnesota since late May with Kyle Willett and Lucy Fortson. My investigation has been twofold: I have been diagramming specific morphological categories in color-magnitude space, and also fitting those data to mathematical functions.
As many readers probably know, a galaxy’s magnitude (overall brightness in the red band, on a log scale) and a galaxy’s color (the difference between the blue magnitude and a red band) are two important quantities for determining what a galaxy might look like (and how it might evolve). Brighter galaxies have more mass (more stars produce more light, of course), and bluer galaxies have a more recent star formation history (this is because young, bright stars tend to be large, bright, and blue). In terms of the whole population, we know, for instance, that elliptical galaxies tend to concentrate in a red sequence, and have typical colors between 2.25 and 2.75. Conversely, the vast majority of spiral galaxies concentrate in a blue cloud between colors 1.25 and 2.0. These two populations are clearly separated in color-magnitude space (this can be seen in the accompanying 2-D histogram, made from Zoo 2 data).

Color-magnitude diagram (CMD) for objects in Galaxy Zoo 2. The lines show fits to the two main populations of elliptical (red) and spiral (blue) galaxies, following the method of Baldry et al. (2004). The green line shows an approximate separation between them.
One of the main goals of Zoo 2 is to gauge the extent to which morphology informs physical characteristics like color and magnitude, so my objective for the summer was to come up with good representations of color and magnitude for all of the smaller sub-populations in Zoo 2.
Several of my results were interesting and surprising. For instance, it has been suggested that spiral galaxies with more arms and spiral galaxies with tighter arm winding (which is to say, a shallower pitch angle) tend to be brighter and bluer. This can be intuitively understood as follows: tighter winding of spiral arms and the presence of more spiral arms indicate, on average, denser gas clouds in those arms, which is tied to increased star formation and bluer color. However, I wasn’t able to measure this in the Zoo 2 data (all the differences were on the order of the histograms’ bin size, about 0.1 magnitude, or about a 10% difference in brightness). This suggests that spiral galaxies, no matter arm multiplicity or winding, are drawn from the same base population.

Color-magnitude diagram (CMD) for spirals in GZ2, split by the number of spiral arms identified in each galaxy. The distribution of colors and magnitudes for galaxies are statistically similar, no matter what the number of spiral arms.
I also came across something unexpected when looking at bulge sizes in face-on disk galaxies. The distribution of galaxies classified by users as bulgeless is starkly different from the distribution of obvious bulge and bulge-dominated galaxies. Furthermore, the population with a bulge that is just noticeable seems to form an intermediate population between the bulgeless and bulge. This observation is also borne out in edge-on disk galaxies: the population of bulgeless edge-on galaxies has a similar shape to the population of face-on galaxies, albeit with stronger reddening on the bright end.

Color-magnitude diagram (CMD) for disk galaxies in Galaxy Zoo 2, split by the relative size of the central bulge. Galaxies that appear to have no central bulge (top) have very different colors and luminosity than those with dominant bulges (bottom).
To fit the distributions, I used a method pioneered about 10 years ago by Ivan Baldry, which fits one parameter after another in our profile functions to find a distribution that converges onto the best fit. It works okay (but not great) for the whole sample, and it fails pretty badly when working with the smaller sub-populations. This is because I have to fit many parameters at once, and do that a bunch of times in a row for the fit to converge, so there are a lot of points of failure. I’m working now at Buffalo towards finding a different and better fitting routine, which will allow us to represent more distributions mathematically.
If you have any questions, feel free to comment below.
New paper on Red and Blue Spirals and Ellipticals
Just a quick note to point out a new paper based on Galaxy Zoo classifications appeared on the arxiv this morning (and just accepted to MNRAS): The Differing Star Formation Histories of Red and Blue Spirals and Ellipticals, by Rita Tojeiro et al.
In this work we took samples of galaxies split by their morphological classifications (from you all, and actually going back to the original Galaxy Zoo project) as well as by their optical colour. With the help of an Ogden Trust undergraduate summer student (Joshua Richards) we then compiled the average star formation histories of these samples, based on fits of star formation models to the Sloan Digital Sky Survey spectra of the galaxies (previously published and called VESPA, or “VErsatile SPectral Analysis” by Rita).
Our main result was that red spirals differ in their star formation histories from blue spirals only in the last billion years or less. We also find that blue ellipticals have very similar star formation histories to blue spirals. We show some results about the dust and metal (astronomers metal) content of the galaxies as well. I think it’s a nice project and I’m very happy to see it finally finished and published.
Thanks again for the classifications.
Want to work with the Galaxy Zoo Team?
The Zoo team is once more expanding, this time in the new Black Hole and Galaxy Astrophysics Group at the ETH Zurich Institute for Astronomy in Switzerland!

Your new morning view could include the Alps…
We’re looking for:
A Postdoc
AAS ad: http://jobregister.aas.org/job_view?JobID=43152
The postdoc position is for two plus one year and comes with support for travel, computing, publishing etc. Research will include work with Galaxy Zoo data, especially the new Hubble Zoo data from CANDELS and also include the hunt for the first black holes in the universe.
Two Ph.D Students
AAS ad: http://jobregister.aas.org/job_view?JobID=43155
The Ph.D positions are fully funded for four years and also come with support for all things a student needs. Both thesis ideas are based on Zoo data and ideas. For the Ph.D position, you’ll need a Master’s degree in physics, astronomy, or related field.
Both postdoc and the students can get involved in the Zooniverse and getting more people to engage with science online.
Zurich is usually ranked in the top ten cities in the world in terms of quality of life and ETH is the highest ranked European university in the world. ETH ASTRO has expertise from planet formation to cosmology and is involved in a number of large projects and surveys. Also, there’s unlimited espresso.
The deadline for both is December 7 2012! For further details, please see the AAS ads.
How to Navigate the Astro Literature, Part 1
So you want to learn about current astrophysics research? You’re in luck! Not only are there many excellent blogs, pretty much all of the peer reviewed literature is out there accessible for free. In many areas of science, the actual papers are behind paywalls and very expensive to access. Astrophysics, like a few other areas of physics and mathematics, puts most papers on the arxiv.org preprint server where they are all available for download form anywhere. In addition, we have a very powerful search tool in the form of the NASA Astrophysics Data System which allows you to perform complex searches and queries across the literature.
Suppose you wanted to learn more about the green peas, one of our citizen science-led discoveries. Your first stop could be the ADS:
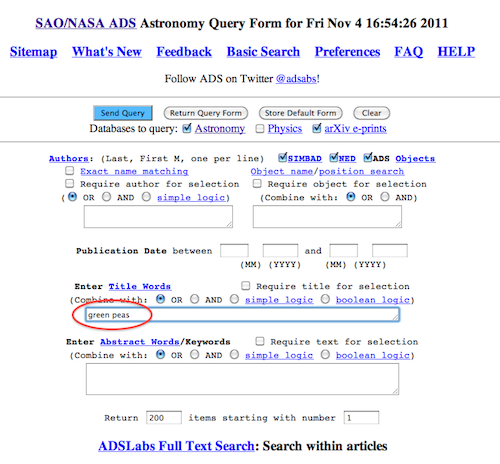
ADS, like any search engine, will now scour the literature for papers with the words “green peas”, “green” and “peas” in it, and return the results:
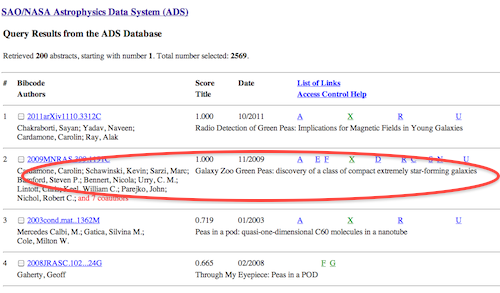
As you can see, the discovery paper of the peas, “Cardamone et al. (2009)” is not the first hit. That’s because in the meantime there has been another paper with “green peas” in the title. You can click on Cardamone et al. and find out more about the paper:

This is just the top of the page but it already contains a ton of information. Most importantly, the page has a link to the arxiv (or astro-ph) e-print (highlighted). Clicking there will get you to the arxiv page of the paper where you can get the full paper PDF.
Also there is a list of paper which are referencing Cardamone et all, at the moment 23 papers do so. By clicking on this link you can get a list of these papers. Similarly, just below, you can get a list of paper that Cardamone et al. is referencing.
Lower still are links to NED and SIMBAD, two databases of astronomy data. The numbers in the brackets indicate that SIMBAD knows 90 objects mentioned in the paper, and NED knows 88. By clicking on them, you can go find out what those databases know about the objects in Cardamone et al. (i.e. the peas).
Obviously there’s a lot more, but just with the arxiv and NASA ADS you can search and scour the astrophysics literature with pretty much no limits. Happy resarching!
Follow the Zooites' Academic Exploits
This post is a plug for two of our forum members – Waveney and Alice – who have been inspired by Galaxy Zoo to go and start a course at university in astronomy. Waveney is working on a Ph.D at the Open University and Alice is doing an MSc course at Queen Mary University. Both are blogging about their experiences on the forum, so if you’re interested in what they are up to, go check out their reports.
The links are:
Hubble Zoo: Summer Research Starts!
Today’s guest post is from Anna Han:
Hi everyone!
My name is Anna Han, and I’m a sophomore undergrad at Yale studying black holes this summer. I’m currently working with images of galaxies observed by Hubble that you as members helped classify on Galaxy Zoo. So excited to be part of the community, and looking forward to sharing ideas with you all!
