
Galaxy Zoo: Hubble – data release and paper accepted!
I’m incredibly happy to report that the main paper for the Galaxy Zoo: Hubble project has just been accepted to the Monthly Notices of the Royal Astronomical Society! It’s been a long road for the project, but we’ve finally reached a major milestone. It’s due to the efforts of many, including the scientists who designed the interface and processed the initial images, the web developers who managed our technology and databases, more than 80,000 volunteers who spent time classifying galaxies and discussing them on the message boards, and the distributed GZ science team who have been steadily working on analyzing images, calibrating data, and writing the paper.
The preprint for the Galaxy Zoo: Hubble paper is available here. The release of GZH also syncs up with the publication of the Galaxy Zoo: CANDELS catalog, led by Brooke Simmons; she’ll have a blog post up later today, and the GZC paper is also available as a preprint.

The first page of the project description and data release paper for Galaxy Zoo: Hubble (Willett et al. 2016).
Galaxy Zoo: Hubble began in 2010; it was the first work of GZ to move beyond the images taken with the Sloan Digital Sky Survey (SDSS). We were motivated by the need to study the evolution and formation of galaxies billions of years ago, in the early days of the Universe. While SDSS is an amazing telescope, it doesn’t have the sensitivity or resolution to make a quality image of a typical galaxy beyond a redshift of about z=0.4 (distances of a few billion parsecs). Instead, we used images from the Hubble Space Telescope, the flagship and workhorse telescope of NASA for the past two decades, and asked volunteers to help us classify the shapes of galaxies in several of Hubble’s largest and deepest surveys. After more than two years of work, the initial set of GZH classifications were finished in 2012 and the site moved on to other datasets, including CANDELS, UKIDSS, and Illustris.
So why has it taken several years to finish the analysis and publication of the data? The reduction of the GZH data ended up being more complicated and difficult than we’d originally anticipated. One key difference lies in our approach to a technique we call debiasing; these refer to sets of corrections made to the raw data supplied by the volunteers. There’s a known effect where galaxies that are less bright and/or further away will appear dimmer and/or smaller in the images which are being classified. This skews the data, making it appear that there are more elliptical/smooth galaxies than truly exist in the Universe. With SDSS images, we dealt with this by assuming that the nearest galaxies were reliably measured, and then deriving corrections which we applied to the rest of the sample.
In Galaxy Zoo: Hubble, we didn’t have that option available. The problem is that there are two separate effects in the data that affect morphological classification. The first is the debiasing issue just mentioned above; however, there’s also a genuine change in the populations of galaxies between, say, 6 billion years ago and the present day. Galaxies in the earlier epochs of the Universe were more likely to have clumpy substructures and less likely to have very well-settled spiral disks with features like bars. So if we just tried to correct for the debiasing effect based on local galaxies, we would have explicitly removed any of the real changes in the population over cosmic time. Since those trends are exactly what we want to study, we needed another approach.
Our solution ended up bringing in another set of data to serve as the calibration. Volunteers who have classified on the current version of the site may remember classifying the “FERENGI” sample. These were images of real galaxies that we processed with computer codes to make them look like they were at a variety of distances. The classifications for these images, which were completed in late 2013, gave us the solution to the first effect; we were able to model the relationship between distance to the galaxy and the likelihood of detecting features, and then applied a correction based on that relationship to the real GZH data.

Top: Example of a galaxy image processed with FERENGI to make it appear at a variety of distances. Bottom: Calibration curves based on FERENGI data that measure the effect of distance on morphological classification. From Willett et al. (2016).
The new GZH data is similar in format and structure to the data release from GZ2. The main product is a very large data table (113,705 rows by 172 columns) that researchers can slice and dice to study specific groups of galaxies with morphological measurements. We’re also releasing data from several related image sets, including experiments on fading and swapping colors in images, the effect of bright active galactic nuclei (AGN), different exposure depths, and even a low-redshift set of SDSS Stripe 82 galaxies classified with the new decision tree. All of the data will be published in electronic tables along with the paper, and are also downloadable from data.galaxyzoo.org. Our reduction and analysis code is available as a public Github repository.
The science team has already published two papers based on preliminary Galaxy Zoo: Hubble data. This included a paper led by Edmond Cheung (UCSC/Kavli IPMU) that concluded that there is no evidence connecting galactic bars and AGN over a range of redshifts out to z = 1.0. Tom Melvin (U. Portsmouth) carefully examined the overall bar fraction in disks using COSMOS data, measuring a strong decrease in bar fraction going back to galaxies 7.8 billion years ago. We’re now excited to continue new research areas, including a project led by Melanie Galloway (U. Minnesota) on the evolution of red disk galaxies over cosmic time. We hope GZH will enable a lot more science very soon from both our team and external researchers, now that the data are publicly released.
A massive “thank you” again to everyone who’s helped with this project. Galaxy Zoo has made some amazing discoveries with your help in the past eight years, and now that two new unique sets of data are openly available, we’re looking forward to many more.
Upcoming Galaxy Zoo: Hubble and CANDELS papers
It’s been a good amount of time since the Galaxy Zoo: Hubble and Galaxy Zoo: CANDELS projects were finished, tackling more than 200,000 combined galaxies thanks to the efforts of our volunteers. While we’ve had a couple of science papers based on the early results (Melvin et al. 2014, Simmons et al. 2014, Cheung et al. 2015), a full release of the data and catalog has taken slightly longer. However, we’ve been working hard, testing the data, and developing some new analysis methods on both image sets. This month has been really exciting, and we now have drafts for both papers that are just about finished. Once they’ve been accepted to the journals (and revised, if necessary), we’ll have some much longer posts discussing the results, and of course attaching the papers themselves. Hopefully that’ll be quite soon.
As a small teaser, here’s a little movie I just made of the Galaxy Zoo: Hubble paper as it went through the various drafts by different members of the science team. If only all paper writing were this easy … 😉

How to write a Galaxy Zoo paper in 15 seconds or less … (Image: K. Willett)
Finished with two more sets of galaxy images!
I’m happy to report that in the last several days, we’ve simultaneously finished the initial sets of galaxies from both the DECaLS survey and the second subset of simulated galaxies from Illustris. This has meant the completion (since last September) of more than 50,000 galaxies seen 40 times apiece, for more than 2 MILLION classifications.
So far, your work is helping reveal new insights based on this deeper data. One very preliminary result: as we’d predicted, the better conditions in DECaLS (bigger camera, better night sky seeing, larger telescope mirror) are revealing galaxies that were classified in SDSS as smooth, but in fact with faint or extended disks and features that are now visible. This is really exciting, and is helping to modify our ideas of the assembly histories of these galaxies.

Comparison of the Galaxy Zoo vote fractions for ~10,000 galaxies detected in both SDSS and DECaLS. The bright yellow dip below the red line in the left panel indicates that galaxies in DECaLS are less likely to be classified as ‘smooth’ based on the improved data. (Image K.W. Willett)
The Galaxy Zoo site is still active – we’ve reactivated a few of the DECaLS DR1 galaxies to slightly improve our statistics, but shortly we’re going to add new sets of (real images) to continue the next phase. I’ll post more as soon as we’ve finalized our plans.
As always, our sincere thanks! Time to start our analysis and continue the science…
Galaxy Zoo at the 227th AAS meeting
We posted briefly about the 227th meeting of the American Astronomical Society, which several members of the Galaxy Zoo science team attended last week. I wanted to share a little bit more about the research that we presented, and the experiences we had at the meeting.

Asst. Prof Lucy Fortson, PhD student Melanie Galloway, and postdoc Kyle Willett (Univ. of Minnesota) at an evening poster session at the 227th AAS meeting.
Kyle Willett (Postdoc, University of Minnesota)
I presented a poster on the data release of the Galaxy Zoo: Hubble project. While it’s been a couple of years since we formally finished the classifications for GZH, we’ve been working hard in the meantime on aggregating and calibrating the data; this includes two supplementary data sets that users helped classify in the newest interface. One of those sets were the images of galaxies processed with the FERENGI code in order to mimic their appearances at higher redshifts; these have been absolutely critical for the calibration/debiasing procedure we’re applying to the real Hubble galaxies. The second set of new images were the deeper images of galaxies in the GOODS north and south fields, completed early last year. We’re using these to analyze the effect of depth on morphologies, and seeing how the disk/clumpy fractions change with improved imaging.
AAS went well for me, and I got to talk about GZH with a number of new colleagues. I particularly liked having my poster between Melanie Galloway’s and Brooke Simmons’ — I got to point out GZH science results on one side and the next generation of even higher redshift galaxies on the other, which made for a very nice story to tell.

Kyle Willett’s poster at the 227th AAS meeting. Click to download the full PDF.
Melanie Galloway (PhD student, University of Minnesota)
Galaxy Zoo users probably know that there are two main types of galaxies: disks and ellipticals. There is a cool relationship between these shapes and their color: disks tend to be blue (which is an indicator of young stars), while almost all ellipticals appear red (which indicates the stars are old; “red and dead” is a term commonly used.) Astronomers believe that this relationship between color and shape implies that galaxies tend to be created as disks, and over their lifetimes, transform from young disks to old ellipticals. Data from Galaxy Zoo revealed that there are also red disk galaxies in the Universe, and right now it is not known how they fit into our current perception of galaxy evolution.
Mel used data from Galaxy Zoo: Hubble to tackle this question by analyzing how the fraction of red disks changed between now and 6 billion years ago. She found that this fraction was actually much higher in the past! This result probably means that red disks don’t tend to stay red disks, and may instead be a common phase of a typical galaxy’s evolution from blue disk to red elliptical.

Melanie Galloway’s poster at the 227th AAS meeting. Click to download the full PDF.
Melanie Beck (PhD student, University of Minnesota)
At this year’s AAS conference, I presented work which focused on the relationship between galaxies’ masses and their sizes. In general, more massive galaxies are also physically larger (but not always!). However, the mass-size relationship is different for galaxies in the distant universe compared to those in the nearby universe. It’s also different between disk galaxies compared to ellipticals in that the sizes of elliptical galaxies grow much, much faster than those of disk galaxies but don’t seem to grow much in mass. To explain this behavior, models predict that disk galaxies must evolve into elliptical galaxies at a rate that mimics the growth rate of the ellipticals. These models predict that there should be many more elliptical galaxies of a particular size and mass in the nearby universe compared to disks. To test this, we need to keep track of the number of galaxies as a function of mass, size, and type (elliptical or disk) over a large period of time.
My initial work utilizes classifications from Galaxy Zoo 2 separated by Smooth or Features/Disk. All the galaxies in this catalog are considered to be in the local universe. Using sophisticated statistical techniques, I’m able to robustly determine the number of galaxies as a function of mass, size and type. Next I’m applying the same techniques to classifications from Galaxy Zoo: Hubble and Galaxy Zoo: CANDELS as these catalogs contain galaxies from the more and more distant universe. Once we have the analysis from all three we can compare the numbers of galaxies at each time and finally test those models!

Melanie Beck’s poster at the 227th AAS meeting. Click to download the full PDF.

Melanie Beck discussing her poster with Prof. Chris Conselice (Univ. of Nottingham).
Brooke Simmons (Postdoc and Einstein Fellow, UC San Diego)
AAS is always a hectic science bonanza, and presenting a poster is a way of slowing things down a bit: unlike a talk, which is over in 15 minutes or less, you get to have your results up all day. My poster was an introduction to the upcoming release of classifications for the high-redshift CANDELS galaxies, so it shows a basic overview of how the classifications work and an early science result about featureless disks at high redshift.
It was great to present 2 data releases side-by-side, with Kyle’s poster to my left, and it was even better to get to present the result of the volunteers’ efforts. Between these posters and the previous data releases for Galaxy Zoo, we’ve measured the shapes of hundreds of thousands of galaxies (actually, I think it’s over a million!) spanning the last 12 billion years of cosmic time.

Brooke Simmons’ poster at the 227th AAS meeting. Click to download the full PDF.
Green pea galaxies may have been responsible for re-ionizing the Universe
The “green pea” galaxies were one of the first discoveries of the Galaxy Zoo; they were first noticed by several of our early volunteers, and appeared in a paper led by Carie Cardamone in 2009 (with over 100 citations so far!). They’ve been the subject of a great deal of follow-up research since then, much of which we’ve tried to follow on this blog.

Examples of the green pea galaxies originally discovered in Galaxy Zoo. Top Row: Sloan Digital Sky Survey images. Bottom Row: Hubble Space Telescope images.
A new paper on the Green Peas has just appeared in Nature, one of the most prestigious and widely-read journals in science. A truly international team of researchers (working in Ukraine, Czech Republic, Switzerland, France, Germany, and the United States) made observations of one green pea galaxy, known as J0925+1403, using an ultraviolet spectrograph on the Hubble Space Telescope. They were able to measure emission from what astronomers call “Lyman continuum” photons; this is light produced by massive stars that are solidly in the ultraviolet wavelengths.
The reason this is so important and interesting relates to one of the most fundamental steps in the history of the Universe that astronomers know of. The majority of matter in the Universe is hydrogen (formed shortly after the Big Bang), and much of it exists in diffuse clouds between galaxies, which is called the intergalactic medium. We know from observations that almost all of that hydrogen is currently ionized – that means instead of consisting of a neutral atom with one proton and one electron orbiting it, the average hydrogen atom between galaxies has had its electron stripped away from the proton. This is a big difference because neutral atoms interact with light differently than ionized atoms. If the hydrogen between galaxies were neutral, it would absorb much of the light coming from individual stars and galaxies, making a huge difference in our ability to observe distant objects.
It’s been known for years the Universe is currently ionized; however, about 700 million years after the Big Bang, we know that the Universe used to be neutral. That’s pretty well-established — however, there’s a great deal of debate about what caused the sudden reionization. Something must have produced large numbers of photons that traveled into the intergalactic medium and ionized all of the hydrogen fairly quickly. There have been lots of papers proposing different possible sources for this, including dwarf galaxies, active galactic nuclei, quasars, very early and massive stars, etc.

Diagram illustrating how individual galaxies may have re-ionized the neutral hydrogen in the Universe shortly after the Big Bang. From Erb (2016).
This new paper proposes that green pea galaxies could be responsible for re-ionizing the early Universe. The measurements from this paper show that at least one green pea galaxy is actively emitting photons with sufficient energy to ionize neutral hydrogen. Lots of galaxies can create such radiation, but one unique aspect of the peas is that the photons are escaping the galaxy where they’re being formed. Usually they’re absorbed by dust or gas clouds within the galaxy before they can affect the rest of the Universe. This is the first time that it’s been demonstrated to occur for a green pea galaxy.
The paper (Izotov et al. 2016) is available online. Nature has also published a nice summary at a slightly less technical level to accompany the article that I’d recommend – you can read that here. Please post if you have any questions or want to discuss more about what this means. We’re extremely excited that your discoveries are still yielding new and interesting science!
Galaxy Zoo is in Florida!
As happens every winter, a large fraction of the world’s astronomers have migrated to a large convention center to share and talk about every aspect of research, outreach, education, and methods of astronomy. This is the biannual meeting of the American Astronomical Society: this winter, the 227th edition is being held in Kissimmee, Florida.

Conference center: now with alligators!
Several posters and talks will be on new research results from Galaxy Zoo data. These include:
- Becky Smethurst (Oxford) – giving a talk on her PhD dissertation research of the quenching history of galaxies and the role of active galactic nucleus (AGN) feedback. (119.04D; Tue)
- Melanie Beck (Minnesota) – a poster on the bivariate mass-size relation of galaxies as a function of morphology (342.38; Thu)
- Melanie Galloway (Minnesota) – a poster on the redshift evolution of the fraction of red disk galaxies, using GZ: Hubble data (342.40; Thu)
- Kyle Willett (Minnesota) – a poster on the upcoming release of the GZ: Hubble catalog (342.41; Thu)
- Brooke Simmons (UC San Diego) – a poster on the release of the GZ: CANDELS catalog (342.42; Thu)
In addition, there are several other abstracts that that use Galaxy Zoo data (although it may not always be the main focus), and several of our core team members (Chris, Kevin, Lucy, etc) are here, but talking about other aspects of their research.
It looks to be an exciting week, and we’ll try to blog and tweet more about the amazing things going on in astronomy right now. Check out more of what’s going on at #aas227!
Finished with the first set of Illustris images!
We’re really excited to report that, with your help, the first batch of galaxy images from the Illustris simulation was finished last week! While we still have plenty of images still available to be classified (both from Illustris and DECaLS), I wanted to explain again how the images are being sorted in Galaxy Zoo and show some of the very early results we’re getting from your classifications.
The galaxies we selected from Illustris were a really big set – after eliminating galaxies which were likely to be too small or dim for accurate visual identification (we did this by filtering on the mass of the galaxies), we had over 110,000 images. In designing this phase of Galaxy Zoo, though, we wanted to try and prioritize the order of the images being shown so that we could do some early science projects along the way, rather than waiting many months for the entire data set to be finished before we started our analysis. This first set of Illustris data included 10,832 images, which were classified a total of more than 430,000 times by Galaxy Zoo volunteers.
One of the main questions we wanted to answer was: “How is the apparent morphology of a galaxy affected by the angle at which it’s viewed?” This is an important one – for observations of the real Universe, we can’t change the position of our telescope relative to the objects we’re looking at. If a galaxy is edge-on, for example, we’re really limited in being able to determine if there’s a bar, how many spiral arms there are, etc. In Illustris, though, we can change the viewing angle in the simulation! As a result, we might hypothesize that all edge-on disks should be identifiable as spiral or S0 galaxies at all the other viewpoints.
Here’s a quick test I’ve run of that. Using the set of collated classifications that just finished from Illustris, I looked for unique galaxies that were classified as “edge-on disks” from at least 1 of the 4 viewing angles that we have data for. Then I looked at the GZ classifications for the other viewing angles to see if they were still edge-on. Results:
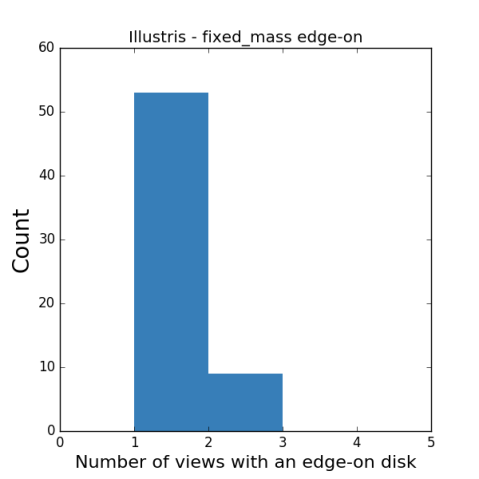
Very close to what we expect! Only about 10% of galaxies had any edge-on classifications; of those, almost all of them are classified as face-on at every other angle (the big bump at N=1 in this plot). The exceptions are where the disk is aligned with two of the virtual cameras — then, we see it as edge-on twice and face-on twice. Since the cameras are oriented like they’re at points of a pyramid with the galaxy at the center, geometry tells us we should expect a typical disk to be edge-on for 0 cameras most of the time, 1 sometimes, 2 very rarely, and never 3 or 4. Just what we see!

Example of a spiral galaxy in Illustris seen from four different viewing angles (“cameras”) in the Galaxy Zoo images. This is a rare case where the galaxy is seen twice as an edge-on disk (upper right, lower left) and twice as a face-on disk (upper left, lower right).
We’re excited to be starting on the analysis phase and are, as always, extremely thankful for your help.
Galaxy Zoo and DECaLS images featured by NOAO
Just a quick reference to a piece that came out in Currents, the newsletter of the National Optical Astronomy Observatory (NOAO) in the US. They included a short piece on the classifications from the new images in DECaLS, a survey which is being co-led by NOAO staff and carried out at their southern observing site in Chile. This followed a longer piece in their September newsletter on the first data release for DECaLS, which includes more details on the tremendous capabilities of the new survey. Good reads if you have a moment!

http://www.noao.edu/currents/201512.html#decals
A quick update: Galaxy Zoo volunteers have already provided more than 750,000 classifications of DECaLS images. We’re completely done with about a quarter of the first data release, and all the images have enough early classifications that we’re starting on preliminary analysis soon. As always, thanks to everyone for your interest and help!
“Blue stuff” in the Illustris galaxy images
I think the most common question/comment we’ve been seeing for classifiers of the simulated Illustris galaxies is along the lines of: “What’s the blue stuff?”
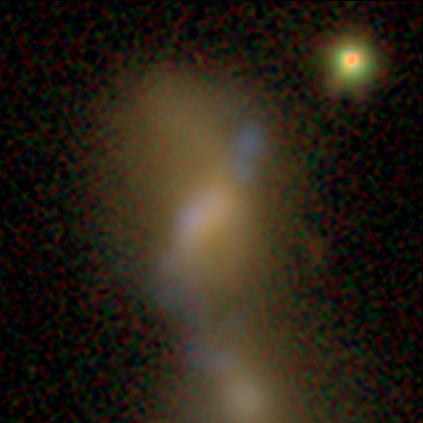
Image of a synthetic galaxy (AGZ00089n5) from the Illustris simulation, being classified in Galaxy Zoo. Blue-ish emission can be seen extending from the lower left to upper right of the center galaxy.
It’s a great question. Let’s talk about it in more detail.
The short answer is that the blue regions are the simulations’ method of reproducing the light emitted by young stars. A star’s lifetime generally scales as a function of its mass – the more massive the star is when it’s first formed, the hotter it is and the faster it burns fuel. Emission from hotter objects will tend to be bluer (ie, produce more photons at shorter wavelengths) compared to less massive stars. These are trends we see in optical images of stars in galaxies, including naked-eye views and composite color images. The exact color depends on the filters being used as well as processing of the images – that’s the difference between images you may have seen of star-forming regions being pink in some images and blue in others, such as those in Illustris.
A couple more specific questions that we’ve received:
What’s causing the blue colors in the galaxies? Are they caused by individual atomic or molecular lines that we can see in the spectra?
Volunteers who worked on the original GZ green peas project might be familiar with the term “nebular emission” – individual, narrow lines caused by ionized or hot gas surrounding stars, or whether they’re the result of the broadband colors of the stars themselves. The GZ-Illustris images use a stellar population model that only computes the broadband colors, due to some issues with unrealistic green images caused by the interaction of the codes that deal with both the emission lines and effects of dust. The model we’re using – based on work by Bruzual & Charlot (2003) – omits the emission lines for that reason. However, we’ve made extensive comparisons of the two sets of images and find that they agree very well for our scientific goals, including the morphology classifications.

A plot of the synthetic spectra for galaxies in the Illustris simulation; each thin horizontal line is the spectrum of an individual galaxy. The most massive galaxies are at the top, while the lowest mass galaxies are at the bottom. Wavelength increases from left to right, or going from bluer to redder colors. The lack of sharp features in this plot (which uses the BC03 model adopted by the Galaxy Zoo images) are a result of excluding the nebular line emission. Figure courtesy P. Torrey (MIT/Caltech).
How should visual morphology classifiers deal with the star-forming regions? Ignore them and look at the underlying stellar populations? Treat them as part of the galaxy? Something else?
This is a tough one. Many galaxies have the “blobby” star-forming regions but others have nicer looking disk or spiral distributions. Our analysis suggests is that this is a pretty tight function of the total star formation rate (higher SFR = more realistic looking features). We suggest that users treat them as part of the galaxy; it might lead to some odd results in lower mass galaxies, but we expect they should trace each other very well for the more massive galaxies. If you see geometry that’s distinctly different from a well-formed spiral disk or elliptical, don’t be hesitant to click the “Anything Odd” or “Other” buttons – that’s one of the simplest ways in which we can measure the unusual effects of the blue regions, given the constraints of our classification scheme.
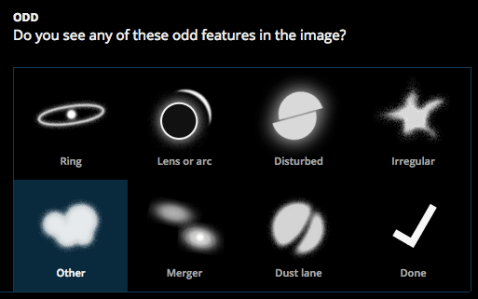
One option for measuring the effect of the blue blobs is to select “Other” under the “Anything Odd” question.
The distribution of the blue blobs is often disconnected and/or in unusual shapes compared to Sloan. What determines the spatial distribution of the star forming regions?
This results from the extremely discrete sampling of the density of stars in the images. Stars can only form in “chunks” of about 1 million solar masses, instead of the more typical small clusters and regions that we know exist in the real Universe. Moreover, these chunks have their light spread over a significant fraction of ~1 kpc (which is pretty big, compared to a typical galaxy radius of ~20 kpc), and so they often won’t look much like real star-forming regions. This, coupled with the lack of dust, leads to what you see in the GZ images.
Thanks as always to everyone for your help. Please post here or on Talk if you have more questions!
This post was written with the help of researchers Gregory Snyder (Space Telescope Science Institute) and Paul Torrey (MIT/Caltech), who worked extensively on the development of Illustris and the generation of the mock images for Galaxy Zoo.
Searching for “tidal debris” in DECaLS images
This post was written with the help of Sugata Kaviraj, senior lecturer at the University of Hertfordshire in the UK. Sugata has been a member of the GZ science team for several years and is leading our analysis of tidal debris in the DECaLS images.
One of the biggest changes to the questions we’re asking for the new DECaLS images asks users to help us classify galaxies that are either merging and/or exhibiting “tidal debris”. While mergers have been part of Galaxy Zoo since our very first classifications, tidal debris is looking for something more specific, which the new DECaLS data is particularly suited for.
In astronomy, “tides” are a type of force exerted on an object by the effect of gravity. Specifically, it refers to the gravitational force exerted by one body on another – since the force exerted by gravity depends on the distance to the object (specifically, it’s proportional to the inverse square of the distance), the nearer side of the object will feel a stronger force than the farther side of the object. On Earth, the differential force caused (mostly) by the gravity of our Moon acts on the liquid in the oceans, causing the rise and fall in sea levels each day.

Example of how a solid body can be deformed under tidal forces. (“Field tidal” by Krishnavedala. Licensed under CC BY-SA 3.0 via Commons.)
When the object is a solid body (like a planet or moon), tidal forces can strain and compress the body, resulting in internal heat and sometimes driving geological activity. A galaxy isn’t a solid body, but composed of individual stars/gas clouds/dark matter particles bound within its own gravitational field. When a galaxy is subjected to tidal forces, it pulls the galaxy apart, causing irregularities in shape that can take many forms depending on the magnitude and direction of the forces involved.
One of the main reasons we want to identify tidal features specifically is to make better measurements of the merger history of galaxies. A complication is that the event of merging with a galaxy isn’t an instantaneous event – depending on the relative masses, velocities, and orientations of the merging galaxies, tidal forces strip out long tails of stars and gas from the galactic centers.

The Mice (NGC 4676): colliding galaxies with tails of stars and gas distorted by tidal forces. Source: Hubblesite.org
Ultimately, the nuclei of the two galaxies will fully merge; if that happened sufficiently far in the past for the orbits of stars to relax, then it’s difficult for observers to determine if an elliptical galaxy today was the result of a merger.
Tidal debris features, however, are longer-lived signals of a merger sometime in a galaxy’s past. If we only asked about mergers, we’d be restricting the sample to galaxies that we’re lucky enough to observe “right in the act” of merging. By identifying the tidal debris as well, we can make a more complete census of galaxies that had a merger at some point in their past. One project that this is critical for is looking at the history of galaxy populations, and trying to figure out whether star formation and/or active black holes might be powered by merger events.
Since tidal debris features can be very faint (ie, having low surface brightnesses), the deeper DECaLS images that we’re currently classifying are much better at picking out these features than SDSS. That’s the main reason we’re focusing on trying to detect them in the current set of images.
Tidal debris can come in many different forms, including extended light, faint shells, dust lanes, or satellites in the process of being assimilated to clearly distorted galaxies which have presumably have had a recent interaction. The features can definitely be faint, but we’d like to ask that when you reach this question, please take a careful second look at the area around the main galaxy and see if you can spot anything. Examples are also available in the help text, and we hope that you’ll discuss features you’re not certain about with the moderators, scientists, and other volunteers in Talk.
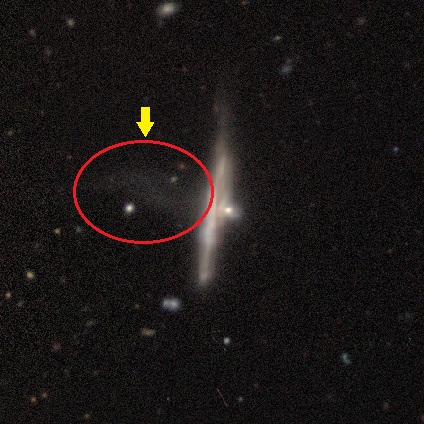
Example 1. Faint tidal debris extension is visible to the upper left of the main galaxy. Image courtesy DECaLS/Galaxy Zoo.
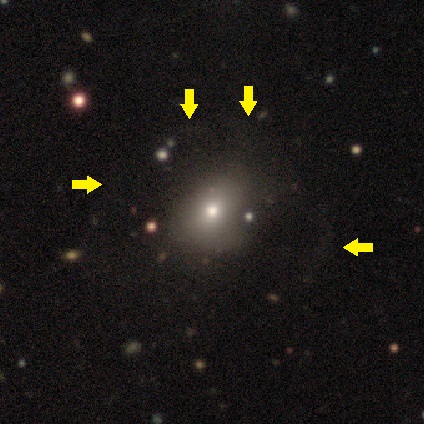
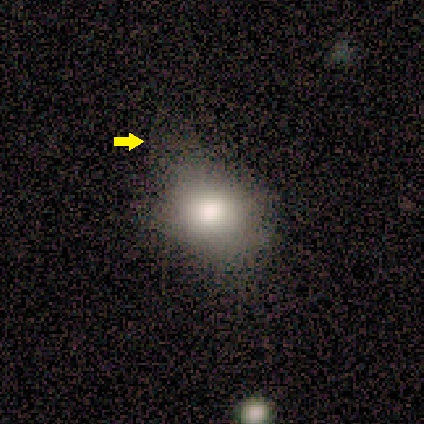
Example 2. Faint tidal debris is visible around the main galaxy in a shell-like shape (see arrows). Image courtesy DECaLS/Galaxy Zoo.
Example 3. Faint tidal debris extension is visible to the left of the main galaxy (within red ellipse). Image courtesy DECaLS/Galaxy Zoo.
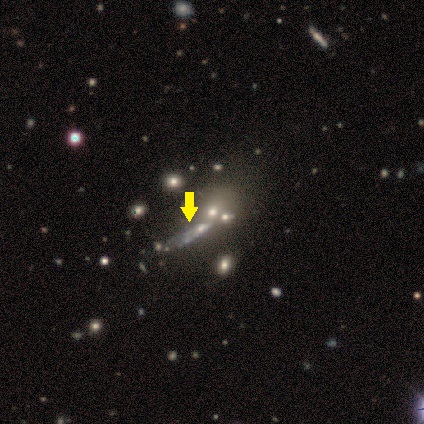
Example 4. A small satellite galaxy is merging into the larger one at the center, being ripped apart and causing tidal debris. Image courtesy DECaLS/Galaxy Zoo.

Example 5. Tidal debris (within the red outline) extending to the top and left of the main galaxy. Image courtesy DECaLS/Galaxy Zoo.

Example 6. Faint tidal debris in a “shell” structure, extending in several directions from the main galaxy (comparable to Example 3). Image courtesy DECaLS/Galaxy Zoo.
Please let us know, here or on Talk, what questions you have. Thanks for your help in tackling a new and interesting scientific problem.
