
Eight Years and the 8 Most Talked-About Galaxies in Galaxy Zoo

Continuing the countdown to Galaxy Zoo’s 8th birthday, below are 8 of the most-commented-on galaxies in the active Galaxy Zoo. They range near (in astronomical terms) and far, from gorgeous disks to space-warping groups, and some of them aren’t even galaxies at all!
8. Galaxies Interacting (Arp 112)

#merger #arc #g-pair #bulge #tidaltails #ugc #wow #agn #ngc #ngc7806 #arp #markarian #dustlane #available_in_dr7 #spiral #gpair #awesome #tidal #lens #no_lens
A lovely example of the diversity of structures in the Universe. The central galaxy may have been a perfectly symmetric spiral before it was seriously disturbed by the elliptical galaxy on the left side of the shot, and what’s that wispy thing off to the right? Is it a former part of the central galaxy? And what is this all going to look like in a few billion years? Whatever happens, the volunteers made it clear this is a special one to classify and to look at.
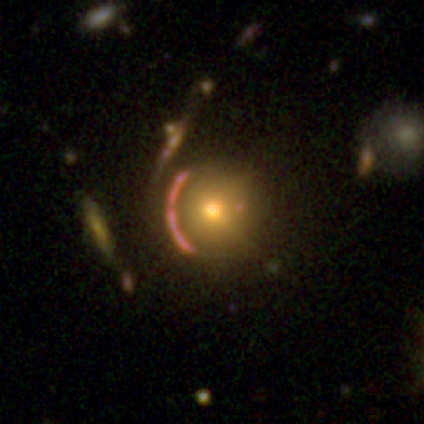
#lens #lensing #knownlens #arc #lense #interesting
This gorgeous gravitational lens was spotted almost immediately upon the launch of the new Galaxy Zoo within the high-redshift CANDELS data. It generated multiple lively discussions and scientists and volunteers alike weighed in with further information. It turned out in this case that this was one of very few lenses that were already known, but there are likely still unknown lenses buried in the data, waiting to be discovered!

#quasar #edge #lbg #star
Initially identified as a high-redshift star-forming galaxy by one of our seasoned volunteers, a number of people subsequently looked further into the existing scientific literature. There was a lot of debate about this particular point of light, but in the end the volunteers uncovered a later paper confirming that this green gem (which would actually be either very red or nearly invisible to the human eye, as it’s “green” because it only shows up in the infrared filters used for this image) is actually just a star in our galaxy. Bummer, maybe, but this process is also an important part of science.

#dustlane #polar #polarring #beautiful #polar-ring #elliptical #ring #edgeon #mothership #dust #polaring #question
This spectacular example of a polar ring galaxy couldn’t have been found in the original Galaxy Zoo or Galaxy Zoo 2, because it only made it into the Sloan Digital Sky Survey when the sky coverage was extended.

#merger #arp148 #arp #available_in_dr7 #lookalike #alphabet #ring
It takes a special kind of galaxy crash to make a collisional ring, and you can see this one in progress. It reminded our volunteers and scientists of the Cartwheel galaxy, another spectacular example of these snapshots of a brief moment in time.

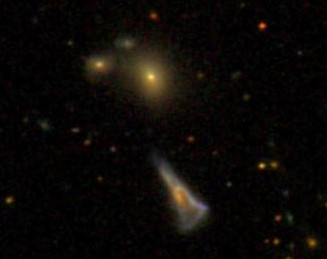
#merger #odd #dark #needle #holycow #wow #doublenucleus #tidaldebris #disturbed #rocket #cluster #irregularshape #spaceship #rocketship
Well, this is odd. This galaxy looks like it’s on its own, but it has a rather unusual shape that would usually imply some sort of interaction or collision. Our volunteers discussed what could be causing it – until they viewed a zoomed-out image and it became clear that this galaxy has recently flown by a trio of galaxies, which would be more than enough to disrupt it into this lovely shape.
2. Hubble Resolves the Distant Universe

#spiral #overlap #dustlane #starburst #edge-on #edgeon
When a new batch of data taken by the Hubble Space Telescope appeared on the latest Galaxy Zoo, this was one of the first stunners remarked on by several people. Some of the parts of the sky covered by Hubble coincide with the Sloan Digital Sky Survey, and we linked the surveys up via Talk. Our tireless volunteers launched a thread collecting side-by-side images from SDSS and Hubble, showcasing the power of the world’s greatest space telescope. Hubble’s primary mirror is about the same size as that used by the SDSS, so the differences between the images of the same galaxy are due to the blurring effect of the atmosphere.

SDSS (on Earth) at left, HST (in space) at right.
And, the most talked about image in the latest Galaxy Zoo is…

It’s always the galaxies you least expect.
Okay, okay… If you saw this and said it looks like there isn’t a lot to talk about here, I wouldn’t blame you. And, indeed, there’s only one “short” comment from one of our volunteers, who used our Examine tools and discovered that this little blotch appears to be a very high-redshift galaxy.
However, that same volunteer also started a discussion with the question: just for fun, what’s the highest redshift you’ve found? Others responded, and thus began a quest to find the galaxy in Galaxy Zoo that is the farthest distance from us. This discussion is Galaxy Zoo at its finest, with new and experienced volunteers using the project as inspiration for their own investigations, scouring the scientific literature, and learning about the very early Universe.
It seems like the most likely known candidate so far is a quasar at a redshift of about 5.5 (at which point the Universe was about 1 billion years old), or, if you don’t think a quasar counts, an extended galaxy at z = 4 or so (1.5 billion years old). But there’s just so much science wonderfulness here, all of it from our fantastic volunteers, and it all started with a patchy blob and a sense of curiosity.
Galaxy Zoo started with a million blobs (ish) and a sense of adventure. I think that’s fitting.
The Green Valley is a Red Herring
Great news everybody! The latest Galaxy Zoo 1 paper has been accepted by MNRAS and has appeared on astro-ph: http://arxiv.org/abs/1402.4814
In this paper, we take a look at the most crucial event in the life of a galaxy: the end of star formation. We often call this process “quenching” and many astrophysicists have slightly different definitions of quenching. Galaxies are the place where cosmic gas condenses and, if it gets cold and dense enough, turns into stars. The resulting stars are what we really see as traditional optical astronomers.
Not all stars shine the same way though: stars much more massive than our sun are very bright and shine in a blue light as they are very hot. They’re also very short-lived. Lower mass stars take a more leisurely pace and don’t shine as bright (they’re not as hot). This is why star-forming galaxies are blue, and quiescent galaxies (or “quenched” galaxies) are red: once star formation stops, the bluest stars die first and aren’t replaced with new ones, so they leave behind only the longer-lived red stars for us to observe as the galaxy passively evolves.

Example images of galaxies classified by you. There are blue, green and red spirals, and blue, green and red ellipticals.

As @penguin galaxy (aka Alice) put it….
Blue Ellipticals & Red Spirals
The received wisdom in galaxy evolution had been that spirals are blue, and ellipticals are red, meaning that spirals form new stars (or rather: convert gas into stars) and ellipticals do not form new stars (they have no gas to convert to stars). Since you’re taking part in Galaxy Zoo, you know that this isn’t entirely true: there are blue (star-forming) ellipticals and red (passive) spirals. It’s those unusual objects that we started Galaxy Zoo for, and in this paper they help us piece together how, why and when galaxies shut down their star formation. You can already conclude from the fact that blue ellipticals and red spirals exist that there is no one-to-one correlation between a galaxy’s morphology and whether or not it’s forming stars.

The colour-mass diagram of galaxies, split by shape. On the right: all galaxies. On the left: just the ellipticals (or early-types) on top and just the spirals (or late-types) on the bottom. On the x-axis is the galaxy mass. On the y-axis is galaxy colour. Bottom is blue (young stars) and top is red (no young stars).
Blue, Red and…. Green?
A few years back, astronomers noticed that not all galaxies are either blue and star forming or red and dead. There was a smaller population of galaxies in between those two, which they termed the “green valley” (the origin of the term is rather interesting and we talk about it in this Google+ hangout). So how do these “green” galaxies fit in? The natural conclusion was that these “in between” galaxies are the ones who are in the process of shutting down their star formation. They’re the galaxies which are in the process of quenching. Their star formation rate is dropping, which is why they have fewer and fewer young blue stars. With time, star formation should cease entirely and galaxies would become red and dead.
The Green Valley is a Red Herring
Ok, why is this green valley a red herring you ask? Simple: the green valley galaxies aren’t a single population of similar galaxies, but rather two completely different populations doing completely different things! And what’s the biggest evidence that this is the case? Some of them are “green spirals” and others are “green ellipticals”! (Ok, you probably saw that coming from a mile away).
So, we have both green spirals and green ellipticals. First: how do we know they must be doing very different things? If you look at the colour-mass diagram of only spirals and only ellipticals, we start to get some hints. Most ellipticals are red. A small number are blue, and a small number are green. If the blue ellipticals turn green and then red, they must do so quickly, or there would be far more green ellipticals. There would be a traffic jam in the green valley. So we suspect that quenching – the end of star formation – in ellipticals happens quickly.
In the case of spirals, we see lots of blue ones, quite a few green one and then red ones (Karen Masters has written several important Galaxy Zoo papers about these red spirals). If spirals slowly turn red, you’d expect them to start bunching up in the middle: the green “valley” which is revealed to be no such thing amongst spirals.

We can time how fast a galaxy quenches. On the x-axis is the optical colour, dominated by young-ish stars, while on the y-axis is a UV colour, dominated by the youngest, most short-lived stars.
Galaxy Quenching time scales
We can confirm this difference in quenching time scales by looking at the ultraviolet and optical colours of spirals and ellipticals in the green valley. What we see is that spirals start becoming redder in optical colours as their star formation rate goes down, but they are still blue in the ultraviolet. Why? Because they are still forming at least some baby stars and they are extremely bright and so blue that they emit a LOT of ultraviolet light. So even as the overall population of young stars declines, the galaxy is still blue in the UV.
Ellipticals, on the other hand, are much redder in the UV. This is because their star formation rate isn’t dropping slowly over time like the spirals, but rather goes to zero in a very short time. So, as the stellar populations age and become redder, NO new baby stars are added and the UV colour goes red.
It’s all about gas
Galaxies form stars because they have gas. This gas comes in from their cosmological surroundings, cools down into a disk and then turns into stars. Galaxies thus have a cosmological supply and a reservoir of gas (the disk). We also know observationally that gas turns into stars according to a specific recipe, the Schmidt-Kennicutt law. Basically that law says that in any dynamical time (the characteristic time scale of the gas disk), a small fraction (around 2%) of that gas turns into stars. Star formation is a rather inefficient process. With this in mind, we can explain the behaviour of ellipticals and spirals in terms of what happens to their gas.

A cartoon version of our picture of how spiral galaxies shut down their star formation.
Spirals are like Zombies
Spirals quench their star formation slowly over maybe a billion years or more. This can be explained by simply shutting off the cosmological supply of gas. The spiral is still left with its gas reservoir in the disk to form stars with. As time goes on, more and more of the gas is used up, and the star formation rate drops. Eventually, almost no gas is left and the originally blue spiral bursting with blue young stars has fewer and fewer young stars and so turns green and eventually red. That means spirals are a bit like zombies. Something shuts off their supply of gas. They’re already dead. But they have their gas reservoir, so they keep moving, moving not knowing that they’re already doomed.

A cartoon version of how we think ellipticals shut down their star formation.
Ellipticals life fast, die young
The ellipticals on the other hand quench their star formation really fast. That means it’s not enough to just shut off the gas supply, you also have to remove the gas reservoir in the galaxy. How do you do that? We’re not really sure, but it’s suspicious that most blue ellipticals look like they recently experienced a major galaxy merger. There are also hints that their black holes are feeding, so it’s possible an energetic outburst from their central black holes heated and ejected their gas reservoir in a short episode. But we don’t know for sure…
So that’s the general summary for the paper. Got questions? Ping me on twitter at @kevinschawinski
Galaxy Zoo and undergraduate research: spiral arms, colors, and brightnesses
The guest post below is by Zach Pace, an undergraduate physics student at the University of Buffalo. Zach worked at the University of Minnesota during the summer of 2013 through the NSF’s Research Experience for Undergraduates (REU) program. Zach is continuing to work with Galaxy Zoo data as part of his senior thesis.
Hi, everyone–
My name is Zach Pace. I’m an undergraduate physics student from the University at Buffalo, and I’ve been working on the Galaxy Zoo 2 project at the University of Minnesota since late May with Kyle Willett and Lucy Fortson. My investigation has been twofold: I have been diagramming specific morphological categories in color-magnitude space, and also fitting those data to mathematical functions.
As many readers probably know, a galaxy’s magnitude (overall brightness in the red band, on a log scale) and a galaxy’s color (the difference between the blue magnitude and a red band) are two important quantities for determining what a galaxy might look like (and how it might evolve). Brighter galaxies have more mass (more stars produce more light, of course), and bluer galaxies have a more recent star formation history (this is because young, bright stars tend to be large, bright, and blue). In terms of the whole population, we know, for instance, that elliptical galaxies tend to concentrate in a red sequence, and have typical colors between 2.25 and 2.75. Conversely, the vast majority of spiral galaxies concentrate in a blue cloud between colors 1.25 and 2.0. These two populations are clearly separated in color-magnitude space (this can be seen in the accompanying 2-D histogram, made from Zoo 2 data).

Color-magnitude diagram (CMD) for objects in Galaxy Zoo 2. The lines show fits to the two main populations of elliptical (red) and spiral (blue) galaxies, following the method of Baldry et al. (2004). The green line shows an approximate separation between them.
One of the main goals of Zoo 2 is to gauge the extent to which morphology informs physical characteristics like color and magnitude, so my objective for the summer was to come up with good representations of color and magnitude for all of the smaller sub-populations in Zoo 2.
Several of my results were interesting and surprising. For instance, it has been suggested that spiral galaxies with more arms and spiral galaxies with tighter arm winding (which is to say, a shallower pitch angle) tend to be brighter and bluer. This can be intuitively understood as follows: tighter winding of spiral arms and the presence of more spiral arms indicate, on average, denser gas clouds in those arms, which is tied to increased star formation and bluer color. However, I wasn’t able to measure this in the Zoo 2 data (all the differences were on the order of the histograms’ bin size, about 0.1 magnitude, or about a 10% difference in brightness). This suggests that spiral galaxies, no matter arm multiplicity or winding, are drawn from the same base population.

Color-magnitude diagram (CMD) for spirals in GZ2, split by the number of spiral arms identified in each galaxy. The distribution of colors and magnitudes for galaxies are statistically similar, no matter what the number of spiral arms.
I also came across something unexpected when looking at bulge sizes in face-on disk galaxies. The distribution of galaxies classified by users as bulgeless is starkly different from the distribution of obvious bulge and bulge-dominated galaxies. Furthermore, the population with a bulge that is just noticeable seems to form an intermediate population between the bulgeless and bulge. This observation is also borne out in edge-on disk galaxies: the population of bulgeless edge-on galaxies has a similar shape to the population of face-on galaxies, albeit with stronger reddening on the bright end.

Color-magnitude diagram (CMD) for disk galaxies in Galaxy Zoo 2, split by the relative size of the central bulge. Galaxies that appear to have no central bulge (top) have very different colors and luminosity than those with dominant bulges (bottom).
To fit the distributions, I used a method pioneered about 10 years ago by Ivan Baldry, which fits one parameter after another in our profile functions to find a distribution that converges onto the best fit. It works okay (but not great) for the whole sample, and it fails pretty badly when working with the smaller sub-populations. This is because I have to fit many parameters at once, and do that a bunch of times in a row for the fit to converge, so there are a lot of points of failure. I’m working now at Buffalo towards finding a different and better fitting routine, which will allow us to represent more distributions mathematically.
If you have any questions, feel free to comment below.
Using Galaxy Zoo Classifications – a Casjobs Example
As Kyle posted yesterday, you can now download detailed classifications from Galaxy Zoo 2 for more than 300,000 galaxies via the Sloan Digital Sky Survey’s “CasJobs” – which is a flexible SQL-based interface to the databases. I thought it might be helpful to provide some example queries to the data base for selecting various samples from Galaxy Zoo.
This example will download what we call a volume limited sample of Galaxy Zoo 2. Basically what this means is that we attempt to select all galaxies down to a fixed brightness in a fixed volume of space. This avoids biases which can be introduced because we can see brighter galaxies at larger distances in a apparent brightness limited sample like Galaxy Zoo (which is complete to an r-band magnitude of 17 mag if anyone wants the gory details).
So here it is. To use this you need to go to CasJobs (make sure it’s the SDSS-III CasJobs and not the one for SDSS-I and SDSS-II which is a separate page and only includes SDSS data up to Data Release 7), sign up for a (free) account, and paste these code bits into the “Query” tab. I’ve included comments in the code which explain what each bit does.
 -- Select a volume limited sample from the Galaxy Zoo 2 data set (which is complete to r=17 mag).
 -- Also calculates an estimate of the stellar mass based on the g-r colours.
 -- Uses DR7 photometry for easier cross matching with the GZ2 sample which was selected from DR7.
 -- This bit of code tells casjobs what columns to download from what tables.
 -- It also renames the columns to be more user friendly and does some maths
 -- to calculate absolute magnitudes and stellar masses.
 -- For absolute magnitudes we use M = m - 5logcz - 15 + 5logh, with h=0.7.
 -- For stellar masses we use the Zibetti et al. (2009) estimate of
 -- M/L = -0.963+1.032*(g-i) for L in the i-band,
 -- and then convert to magnitude using a solar absolute magnitude of 4.52.
 select g.dr7objid, g.ra, g.dec,
 g.total_classifications as Nclass,
 g.t01_smooth_or_features_a01_smooth_debiased as psmooth,
 g.t01_smooth_or_features_a02_features_or_disk_debiased as pfeatures,
 g.t01_smooth_or_features_a03_star_or_artifact_debiased as pstar,
 s.z as redshift,
 s.dered_u as u, s.dered_g as g, s.dered_r as r, s.dered_i as i, s.dered_z as z, s.petromag_r,
 s.petromag_r - 5*log10(3e5*s.z) - 15.0 - 0.7745 as rAbs,
 s.dered_u-s.dered_r as ur, s.dered_g-s.dered_r as gr,
 (4.52-(s.petromag_i- 5*log10(3e5*s.z) - 15.0 - 0.7745))/2.5 + (-0.963 +1.032*(s.dered_g-s.dered_i)) as Mstar
-- This tells casjobs which tables to select from.
 from DR10.zoo2MainSpecz g, DR7.SpecPhotoAll s
-- This tells casjobs how to match the entries in the two tables
 where
 g.dr7objid = s.objid
 and
 -- This is the volume limit selection of 0.01<z<0.06 and Mr < -20.15
 s.z < 0.06 and s.z > 0.01
 and (s.petromag_r - 5*log10(3e5*s.z) - 15 - 0.7745) < -20.15
--This tells casjobs to put the output into a file in your MyDB called gz2volumelimit
 into MyDB.gz2volumelimit
Once you have this file in your MyDB, you can go into it and make plots right in the browser. Click on the file name, then the “plot” tab, and then pick what to plot. Colour-magnitude diagrams are interesting – to make one, you would plot “rabs” on the X-axis and “ur” (or “gr”) on the yaxis. There will be some extreme outliers in the colour, so put in limits (for u-r a range of 1-3 will work well). The resulting plot (which you will have to wait a couple of minutes to be able to download) should look something like this:

Or if you want to explore the GZ classifications, how about plotting “psmooth” (which is approximately the fraction of people viewing a galaxy who thought it was smooth) against the colour.
That plot would look something like this:
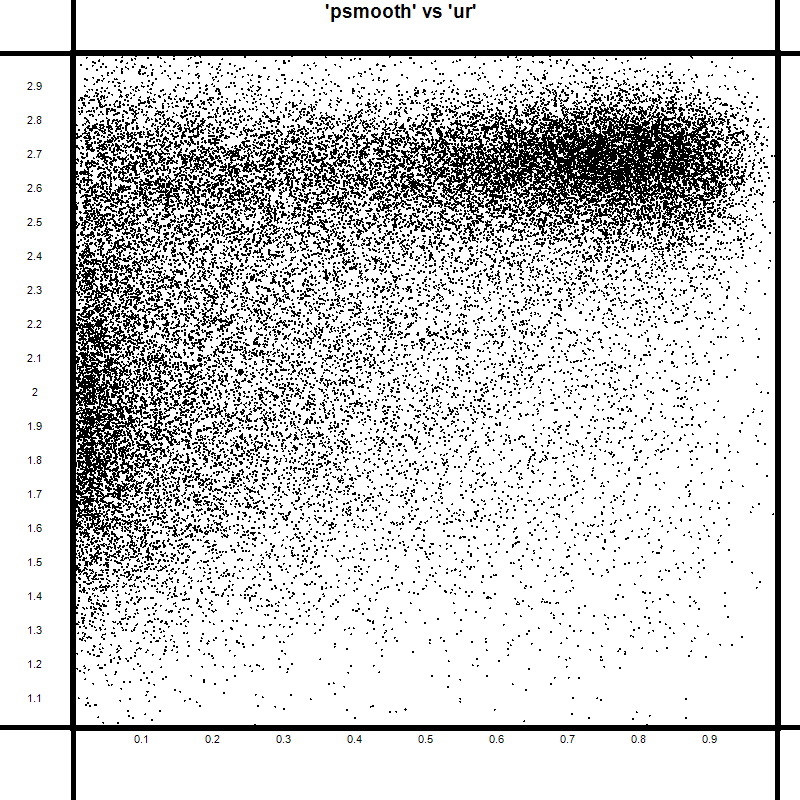
Which reveals the well known relationship between colour and morphology – that redder galaxies are much more likely to be ellipticals (or “smooth” in the GZ2 language) than blue ones.
You can learn more about SQL and the many things you could do with CasJobs at the Help Page (and then come back and tell me how simple my query example was!).
This example only downloads the very first answer from the GZ2 classification tree – there’s obviously a lot more in there to explore.
(Note that at the time of posting the DR10 server seemed to be struggling – perhaps over demand. I’m sure it will be fixed soon and this will then work.)
SDSS Data Release 10 and Galaxy Zoo 2
Since the original launch of the Sloan Digital Sky Survey (SDSS) in 2000, the data from the project has been released to the public on a timescale of every year or two. These Data Releases include both new observations from the telescope, as well as refinements to old data based on improving the processing and reduction routines.
Today, Sloan announced that Data Release 10 (DR10) is now available to both the general astronomy community and to the public. It contains the first release of spectra from the APOGEE experiment, which has been observing tens of thousands of red giant stars in the Milky Way. It also includes new data from BOSS, which has been measuring redshifts for distant galaxies in order to measure cosmological parameters and study structure formation.
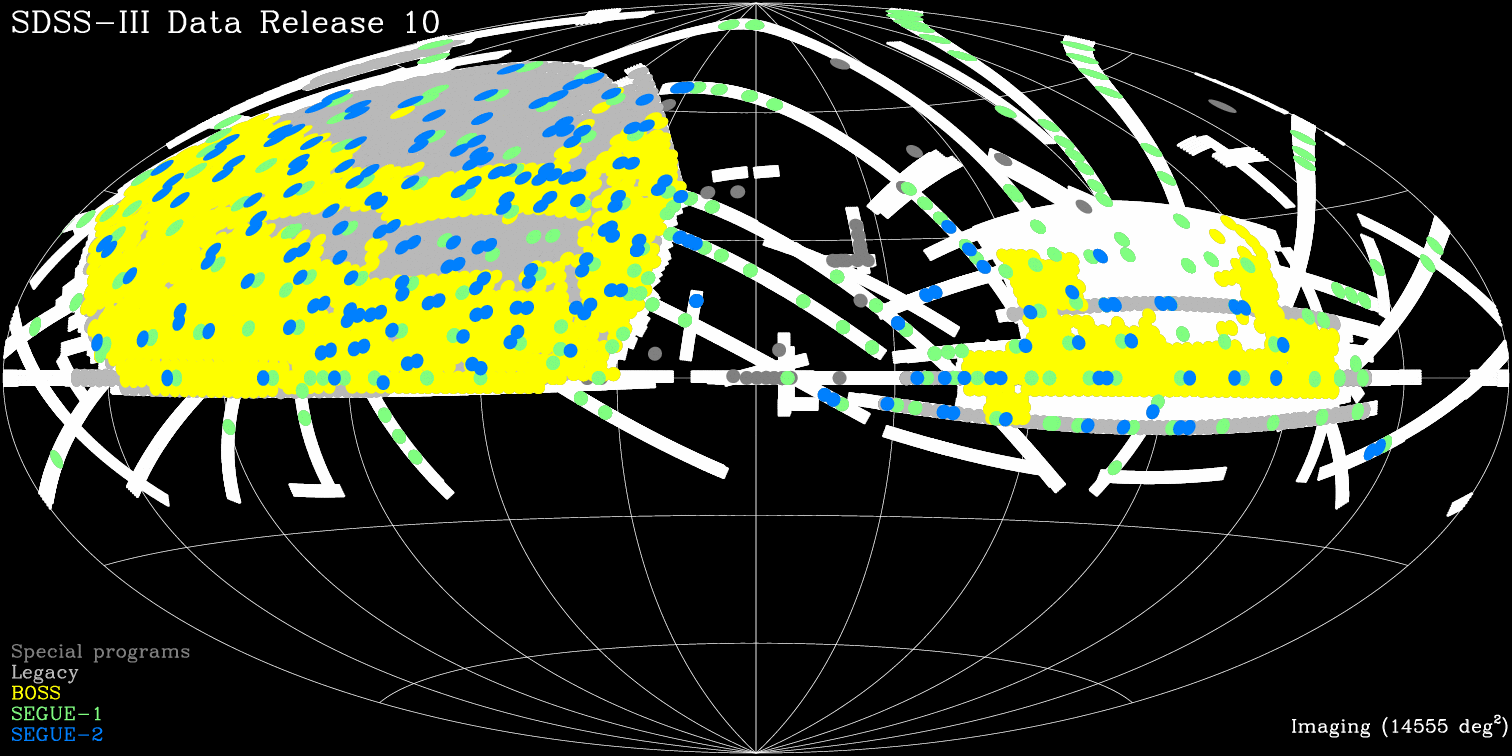
Sky coverage of the SDSS data contained in DR10
The original data from Galaxy Zoo was included in the SDSS Data Release 8. That’s quite important for a couple of reasons. It makes it much easier for scientists to use the GZ data, since SDSS uses this as the input for their own database, called CasJobs. This database enables matching of morphologies to other properties of the galaxies that SDSS measures, such as color or size. It also provides one of the main means of access to the data for people who aren’t members of the Galaxy Zoo team. Finally, it’s a validation that your GZ classifications have become a core data product of the survey, and something which is worth preserving and sharing as widely as possible.
In DR10, we’re happy to announce that data from Galaxy Zoo 2 is available for the first time. The reduction and description of the data is covered in a recent paper, which received a very favorable referee report a couple of weeks ago and will be resubmitted soon. We’ll share the paper as soon as it’s been formally accepted. The GZ2 data will also be hosted on our own site within Galaxy Zoo in the near future.

Galaxy Zoo 2 data is now on CasJobs!
Please check out DR10 if you’re interested in peeking at the GZ2 data – do acknowledge both Willett et al. (GZ2) and Ahn et al. (DR10) if you end up using it, though. Congratulations to the SDSS team on this new release!
New paper on Red and Blue Spirals and Ellipticals
Just a quick note to point out a new paper based on Galaxy Zoo classifications appeared on the arxiv this morning (and just accepted to MNRAS): The Differing Star Formation Histories of Red and Blue Spirals and Ellipticals, by Rita Tojeiro et al.
In this work we took samples of galaxies split by their morphological classifications (from you all, and actually going back to the original Galaxy Zoo project) as well as by their optical colour. With the help of an Ogden Trust undergraduate summer student (Joshua Richards) we then compiled the average star formation histories of these samples, based on fits of star formation models to the Sloan Digital Sky Survey spectra of the galaxies (previously published and called VESPA, or “VErsatile SPectral Analysis” by Rita).
Our main result was that red spirals differ in their star formation histories from blue spirals only in the last billion years or less. We also find that blue ellipticals have very similar star formation histories to blue spirals. We show some results about the dust and metal (astronomers metal) content of the galaxies as well. I think it’s a nice project and I’m very happy to see it finally finished and published.
Thanks again for the classifications.
Space Lasers and the Cosmic Martini: Removing Data Artifacts
As long as there are big data surveys, there will be data artifacts. Our corner of Astronomy is no exception: although the vast majority of images in SDSS and CANDELS are of high quality and therefore of high scientific value, poor quality images do still exist. The Galaxy Zoo team has worked hard to remove as many as possible from both samples so most “bad” images never even make it into the database, but this process is imperfect because computers have trouble identifying every kind of artifact (for some of the same reasons they have trouble identifying different galaxy types).
Of course, as we’ve seen time and again, Galaxy Zoo users have no problem whatsoever spotting the things the computers miss:

Not a Green Pea unless the universe is Tomato Soup.
The thread on Talk where this image was discussed pointed out that this was in the “Cosmic Scarf” of SDSS, where most of the fields have poor image quality:

Now, most of the fields in the zoomed-out image above were removed from the database and will never be shown on the website, but even the parts that look okay in the zoomed-out image don’t look so great when you zoom in. SDSS combines a number of its quality flags to give each field a “score” from 0 (terrible) to 1 (excellent) to assess its quality, but it’s not always that reliable. For example, although fields with scores larger than 0.6 are generally considered good, this field has a score of 0.77 but is clearly not quite right:

And this field has a much lower score of 0.37 but the images are classifiable:

So any choice we made at the beginning based just on the computer evaluations was going to leave some artifacts in, and we chose to err on the side of showing as many classifiable images as possible (increasing the number of artifacts kept in).
The good news is that Galaxy Zoo has always been adaptable, improving with input from all its participants. Now that this field has been flagged, the science team is working on a two-pronged approach: first, removing the entire “cosmic scarf” should immediately help prevent the majority of these big groups of artifacts from being loaded onto the server. Second, we’re working on finding a better method of removing those artifacts that remain, using your classifications and also your hashtags on Talk. (We’re also working on using this to help make the computers better at spotting artifacts in the future.)
So keep clicking, and remember, even your “artifact” clicks are useful.
New Sloan Digital Sky Survey Galaxies in Galaxy Zoo
The relaunch of Galaxy Zoo doesn’t only include the fantastic new images from the CANDELS survey on Hubble Space Telescope, but also includes over 200,000 new local galaxies from the Sloan Digital Sky Survey. We’ve had a lot of questions about where these galaxies came from and why they weren’t put into earlier versions of Galaxy Zoo, so I thought I’d write a bit about these new images.
The Sloan Digital Sky Survey Project (SDSS) is currently in its 3rd phase (SDSS-III). You can read all about the history of SDSS here, and here, but briefly SDSS-I (2000-2005) and SDSS-II (2005-2008) took images of about a quarter of the sky (which we often refer to as the SDSS Legacy Imaging), and then measured redshifts for almost 1 million galaxies (the “Main Galaxy Sample”, which was the basis of the original Galaxy Zoo and Galaxy Zoo 2 samples; plus the “Luminous Red Galaxy” sample) as well as 120,000 much more distant quasars (very distant galaxies visible only as point source thanks to their actively accreting black holes).
Following the success of this project, the Sloan Digital Sky Survey decided they wanted to do more surveys, and put together a proposal which had four components (BOSS, SEGUE2, MARVELS and APOGEE – see here). To meet the science goals of these projects they realised they would need more sky area to be imaged. This proposal was funded as SDSS-III and started in 2008 (planned to run until 2014). The first thing this new phase of SDSS did was to take the new imaging. This was done using exactly the same telescope and camera (and methods) as the original SDSS imaging. They imaged an area of sky called the “Southern Galactic cap”. This is part of the sky which is visible from the Northern Hemisphere, but which is out the Southern side of our Galaxy’s disc. It totals about 40% of the size of the original SDSS area, brining the total imaging area up to about 1/3rd of the whole sky. The images in it were publicly released in January 2011 as part of the SDSS Data Release 8 (DR8 – so we sometimes call it the DR8 imaging area).

This illustration shows the wealth of information on scales both small and large available in the SDSS-III’s new image. The picture in the top left shows the SDSS-III view of a small part of the sky, centered on the galaxy Messier 33 (M33). The middle and right top pictures are further zoom-ins on M33.
The figure at the bottom is a map of the whole sky derived from the SDSS-III image. Visible in the map are the clusters and walls of galaxies that are the largest structures in the entire universe. Figure credit: M. Blanton and the SDSS-III collaboration
We have selected galaxies from this area which meet the criteria for being included in the original Galaxy Zoo 2 sample (for the experts – the brightest quarter of those which met Main Galaxy Sample criteria). Unfortunately in this part of the sky there is not systematic redshift survey of the local galaxies, so we will have to rely on other redshift surveys (the most complete being the 2MASS Redshift Survey) to get redshifts for as many of these galaxies as we can. We still think we’ll get a lot more galaxies and, be able to make large samples of really rare types of objects (like the red spiral or blue ellipticals). Another of our main science justifications for asking you to provide us with these morphologies was the potential for serendipitous discovery. Who knows what you might find in this part of the sky. The Violin Clef Galaxy is in the DR8 imaging area and featured heavily in our science team discussions of if this was a good idea or not.
And interesting things are already being found in just a week of clicks. The new Talk interface is a great additional place for us to discuss the interesting things that can be found in the sky.
For example this great system with tidal tails and a Voorwerpjie:

this weird triangular shaped configuration of satellites:

and an oldie (but a goodie) in the beautiful galaxy pair of NGC 3799 and NGC 3800 (NGC 3799 in the centre, NGC 3800 just off to the upper right):

and just this morning I discovered the discussion of this really unusual looking possible blue elliptical (IC 2540):

There are also rather more artifacts and odd stuff going on in these new images than I think we saw in the SDSS Legacy sample (from GZ1 and GZ2). Remember these are completely new images you are looking at. It really is true that no-one has looked at these in this level of detail (or perhaps ever) before. The original sample had a sanity check at some level, since when GZ1 ran the majority of the sample had already been targeted by SDSS for redshifts (so someone had to plug a fibre into a plate for each galaxy). In this new imaging all that has happened is that a computer algorithm was run to detect likely galaxies and set the scale of the image you see. Sometimes that mistakes stars, satellite trails, or parts of galaxies for galaxies. Always classify the central object in the image, and help us clean up this sample by using the star/artifact button.
And you can enjoy these odd images too. I like this collection of “GZ Pure Art” based on just odd things/artifacts classifier “echo-lily-mai” thought were pretty. 🙂 If you get confused by anything please join us on Talk, or the Forum where someone will help you identify what it is you’re seeing.
New Images in the New Galaxy Zoo
This post is the first of a series introducing the new Galaxy Zoo. The second is here, but come back in the next few days for more information about our fabulous new site

As you’ve probably already noticed, the Galaxy Zoo interface got a shiny new facelift thanks to the wizards in the Zooniverse development team, but that’s not all. The site is stuffed with new galaxies! These brand new, never-seen-before images come from two places:
SDSS

The new SDSS images (right), drawn from the latest data release, are better and hopefully easier to classify than the old (left).
You might remember that the original Galaxy Zoo 1 and 2 used images from the Sloan Digital Sky Survey (SDSS), a robotic telescope surveying the ‘local’ Universe from its vantage point in New Mexico. These images are now prepared in a slightly different way, in order to highlight subtle details. To better understand these galaxies, drawn from our own backyard, we’re making those improved images available through the new Zoo classification page. (These are actually new galaxies, from parts of the sky that SDSS hadn’t surveyed when we launched Zoo 2).
Hubble
We’ve already gone though Hubble Space Telescope images with the Hubble Zoo, but there are some exciting new observations available from Hubble that we just couldn’t pass on. In 2009, astronauts on Space Shuttle mission STS-125 visited Hubble for a final time and installed an exciting new camera in the telescope. This camera, called Wide Field Camera 3 (WFC3) can take large (by Hubble standards!) images of the infrared sky.

NASA astronauts installing the new Wide Field Camera 3 on the Hubble Space Telescope during the final Service Mission 4 (credit: NASA).
As we peer deeper into the Universe, we look into the past, and since the universe is expanding, the galaxies we see are moving away from us faster and faster. This means that the light that left them gets stretched by the time it reaches us. Thus, the light from stars gets “redshifted” and to see a galaxy in the early universe as it would appear in visible light locally, we need an infrared camera.

A weird “clumpy” galaxy spied by Hubble in the early universe. Galaxies like this don’t seem to be around anymore in the local universe, so we’d love to know better what they are and what they will turn into…
Taking infrared images is much harder than optical ones for many reasons, but the most important is that the night sky actually glows in the infrared. This fundamentally limits our ability to take deep infrared images, which is why Hubble’s new WFC3 with its infrared capability is so valuable: in space, there’s no night sky! Hubble is currently using the WFC3 to survey several patches of the sky as part of the CANDELS program (more on that soon!) to generate deep infrared images of galaxies in the early universe and we’re asking you to help us sort through them.
Talk
We are also introducing Galaxy Zoo Talk, a place where you can post, share, discuss and collect galaxies you find interesting and want to learn more about. You can of course still join us on the Forum, but Talk will make it easier for you to systematically discuss and analyse your galaxies.
There’s a whole new mountain of galaxies to go through, so happy classifying!
The Hubble Tuning Fork
The gold standard for galaxy classification among professional astronomers is of course the Hubble classification. With a few minor modifications, this classification has stood in place for almost 90 years. A description of the scheme which Hubble calls “a detailed formulation of a preliminary classification presented in an earlier paper” (an observatory circular published in 1922) can be found in his 1926 paper “Extragalactic Nebulae” which is pretty fun to have a look at.
Hubble’s classification is often depicted in a diagram – something which is probably familiar to everyone who has taken an introductory astronomy course. Astronomers call this diagram the “Hubble Tuning Fork”. I have been meaning for a while to make a new version of the Hubble tuning fork based on the type of images which were used in Galaxy Zoo 1 and 2 (OK the prettiest ones I could find – these are not typical at all). Anyway here it is. The Hubble Tuning Fork as seen in colour by the Sloan Digital Sky Survey:

I should say that my choice of galaxies for the sequence owes a lot of credit to an excellent Figure illustrating galaxy morphologies in colour SDSS images which can be found in this article on Galaxy Morphology (arXiV link) written by Ron Buta from Alabama (Figure 48). I strongly recommend that article if you’re looking for a thorough history of galaxy morphology.
Inspired by the “Create a Hubble Tuning Fork Diagram” activity provided by the Las Cumbres Observatory, I also provide below a blank version which you can fill in with your favourite Galaxy Zoo galaxies should you want to. I have to say though, the Las Cumbres version of the activity looks even more fun as they also talk you through how to make your own colour images of the galaxies to put on the diagram.

Anyway I hope you like my new version of the diagram as much as I do. Thanks for reading, Karen.
