
Using Galaxy Zoo Classifications – a Casjobs Example
As Kyle posted yesterday, you can now download detailed classifications from Galaxy Zoo 2 for more than 300,000 galaxies via the Sloan Digital Sky Survey’s “CasJobs” – which is a flexible SQL-based interface to the databases. I thought it might be helpful to provide some example queries to the data base for selecting various samples from Galaxy Zoo.
This example will download what we call a volume limited sample of Galaxy Zoo 2. Basically what this means is that we attempt to select all galaxies down to a fixed brightness in a fixed volume of space. This avoids biases which can be introduced because we can see brighter galaxies at larger distances in a apparent brightness limited sample like Galaxy Zoo (which is complete to an r-band magnitude of 17 mag if anyone wants the gory details).
So here it is. To use this you need to go to CasJobs (make sure it’s the SDSS-III CasJobs and not the one for SDSS-I and SDSS-II which is a separate page and only includes SDSS data up to Data Release 7), sign up for a (free) account, and paste these code bits into the “Query” tab. I’ve included comments in the code which explain what each bit does.
 -- Select a volume limited sample from the Galaxy Zoo 2 data set (which is complete to r=17 mag).
 -- Also calculates an estimate of the stellar mass based on the g-r colours.
 -- Uses DR7 photometry for easier cross matching with the GZ2 sample which was selected from DR7.
 -- This bit of code tells casjobs what columns to download from what tables.
 -- It also renames the columns to be more user friendly and does some maths
 -- to calculate absolute magnitudes and stellar masses.
 -- For absolute magnitudes we use M = m - 5logcz - 15 + 5logh, with h=0.7.
 -- For stellar masses we use the Zibetti et al. (2009) estimate of
 -- M/L = -0.963+1.032*(g-i) for L in the i-band,
 -- and then convert to magnitude using a solar absolute magnitude of 4.52.
 select g.dr7objid, g.ra, g.dec,
 g.total_classifications as Nclass,
 g.t01_smooth_or_features_a01_smooth_debiased as psmooth,
 g.t01_smooth_or_features_a02_features_or_disk_debiased as pfeatures,
 g.t01_smooth_or_features_a03_star_or_artifact_debiased as pstar,
 s.z as redshift,
 s.dered_u as u, s.dered_g as g, s.dered_r as r, s.dered_i as i, s.dered_z as z, s.petromag_r,
 s.petromag_r - 5*log10(3e5*s.z) - 15.0 - 0.7745 as rAbs,
 s.dered_u-s.dered_r as ur, s.dered_g-s.dered_r as gr,
 (4.52-(s.petromag_i- 5*log10(3e5*s.z) - 15.0 - 0.7745))/2.5 + (-0.963 +1.032*(s.dered_g-s.dered_i)) as Mstar
-- This tells casjobs which tables to select from.
 from DR10.zoo2MainSpecz g, DR7.SpecPhotoAll s
-- This tells casjobs how to match the entries in the two tables
 where
 g.dr7objid = s.objid
 and
 -- This is the volume limit selection of 0.01<z<0.06 and Mr < -20.15
 s.z < 0.06 and s.z > 0.01
 and (s.petromag_r - 5*log10(3e5*s.z) - 15 - 0.7745) < -20.15
--This tells casjobs to put the output into a file in your MyDB called gz2volumelimit
 into MyDB.gz2volumelimit
Once you have this file in your MyDB, you can go into it and make plots right in the browser. Click on the file name, then the “plot” tab, and then pick what to plot. Colour-magnitude diagrams are interesting – to make one, you would plot “rabs” on the X-axis and “ur” (or “gr”) on the yaxis. There will be some extreme outliers in the colour, so put in limits (for u-r a range of 1-3 will work well). The resulting plot (which you will have to wait a couple of minutes to be able to download) should look something like this:

Or if you want to explore the GZ classifications, how about plotting “psmooth” (which is approximately the fraction of people viewing a galaxy who thought it was smooth) against the colour.
That plot would look something like this:
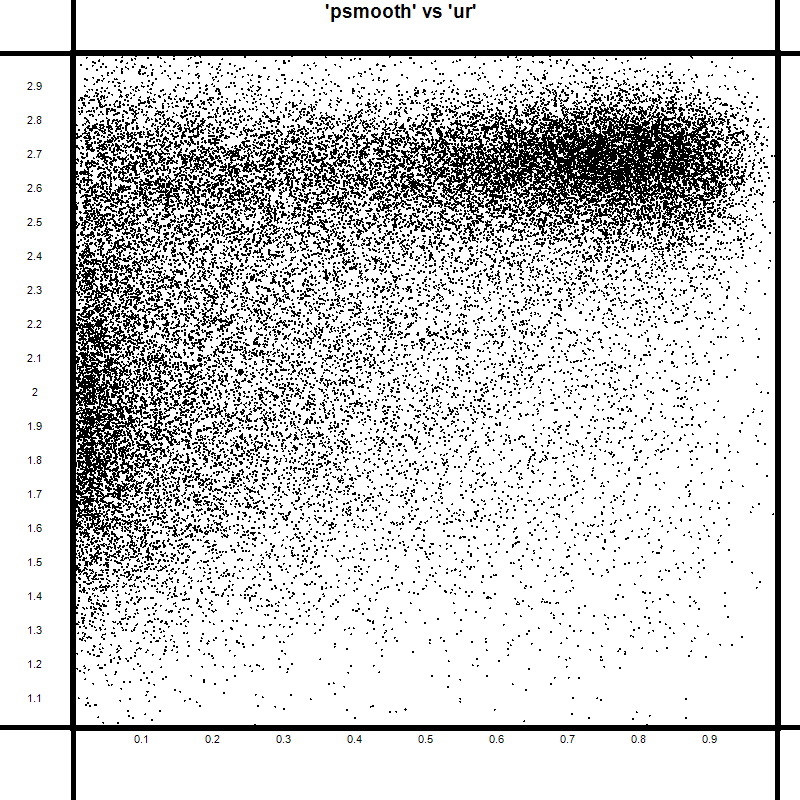
Which reveals the well known relationship between colour and morphology – that redder galaxies are much more likely to be ellipticals (or “smooth” in the GZ2 language) than blue ones.
You can learn more about SQL and the many things you could do with CasJobs at the Help Page (and then come back and tell me how simple my query example was!).
This example only downloads the very first answer from the GZ2 classification tree – there’s obviously a lot more in there to explore.
(Note that at the time of posting the DR10 server seemed to be struggling – perhaps over demand. I’m sure it will be fixed soon and this will then work.)

Very cool Karen!
Question: are the original Galaxy Zoo classifications directly available from DR10 too? If so, how do you reference those in a CasJobs query?
If all x00,000 GZ zooites start writing CasJobs SQL queries like this, I’m sure we’ll melt the servers! 😉
Yep – GZ1 classifications are also on the same server. Available tables are:
zooConfidence
zooMirrorBias
zooMonochromeBias
zooNoSpec
zooSpec
zooVotes
The structure and content of these tables is described in the Lintott et al. (2011) data release paper for GZ1.
No need of CASJob for this example:
Use http://skyserver.sdss3.org/dr10/en/tools/search/sql.aspx
paste the query
and ‘submit’ choosing output format ‘CSV’
No worry about server…
Count query on http://skyserver.sdss3.org/dr10/en/tools/search/sql.aspx with
select count(*)
from
zoo2MainSpecz g
, SpecPhotoAll s
where
g.dr8objid = s.objid
and s.z 0.01
and (s.petromag_r – 5*log10(3e5*s.z) – 15 – 0.7745) < -20.15
gives the max number of the sample because of crossmatch on DR8 objects (to be reduced in DR7):
= 32392
typo corrected
and s.z 0.01