
Galaxy Zoo + Galaxy Zoo: 3D
Hi! I’m Tom, and I’m a PhD student at the University of Nottingham, doing some research to try to understand how spiral galaxies have grown and changed over their lifetimes. I’m especially interested in looking at how the spiral arms have been affecting the galaxy as a whole. I’ve recently finished up a paper in MNRAS in which I’ve been demonstrating a couple of new methods using some Galaxy Zoo data.
Amelia has already written [ https://blog.galaxyzoo.org/2018/07/17/finding-bars-in-galaxy-zoo-3d/ ] about how she is using the MaNGA survey [ https://www.sdss.org/surveys/manga/ ] to try to understand what’s happening in bars, so I won’t go into too much detail about this fantastic survey. I’ll just say that it’s part of the Sloan Digital Sky Survey, and for each of its sample of 10,000 galaxies, we have measurements of the spectrum at every position across the face of the galaxy.
MaNGA is really useful for trying to understand how galaxies have grown to their current size, because it is possible to get some sort of estimation of what kinds of stars are present in different locations of the galaxy. It’s a difficult thing to measure, so we can’t say exactly how many of every different type of star is present, but we can at least get a broad picture of the kinds of stellar ages and chemical enrichment (“metallicity”) in the stars. Astronomers have used these kinds of tools to measure the average age or metallicity of stars in different parts of galaxies, and found that in most spirals, the further out you go in the galaxy, the younger the stars are on average. The usual interpretation of this is that bulges tend to have formed first, and the disks have grown in size over time afterwards.

A MaNGA spiral galaxy. We can obtain information about the kinds of stars residing across the hexagonal area, which helps us understand how they’ve grown and evolved.
I’m really interested in trying to push this picture in two ways. Firstly, I’ve been trying to see what we can learn from looking at the general distribution of stars of different ages and metallicities – not just the average properties – at each location in the galaxy. Secondly, I think there is a lot of information that we risk ignoring by only looking at how things change with galactic radius. Spiral arms and the bar aren’t evenly distributed around the galaxy, so if we can see how the stellar properties change as we move around the galaxy, we should be able to measure what effect the spiral arms and bars have on the stars. The goal would be to try to confirm whether the most popular models of the nature of spiral arms and bars are correct or not.
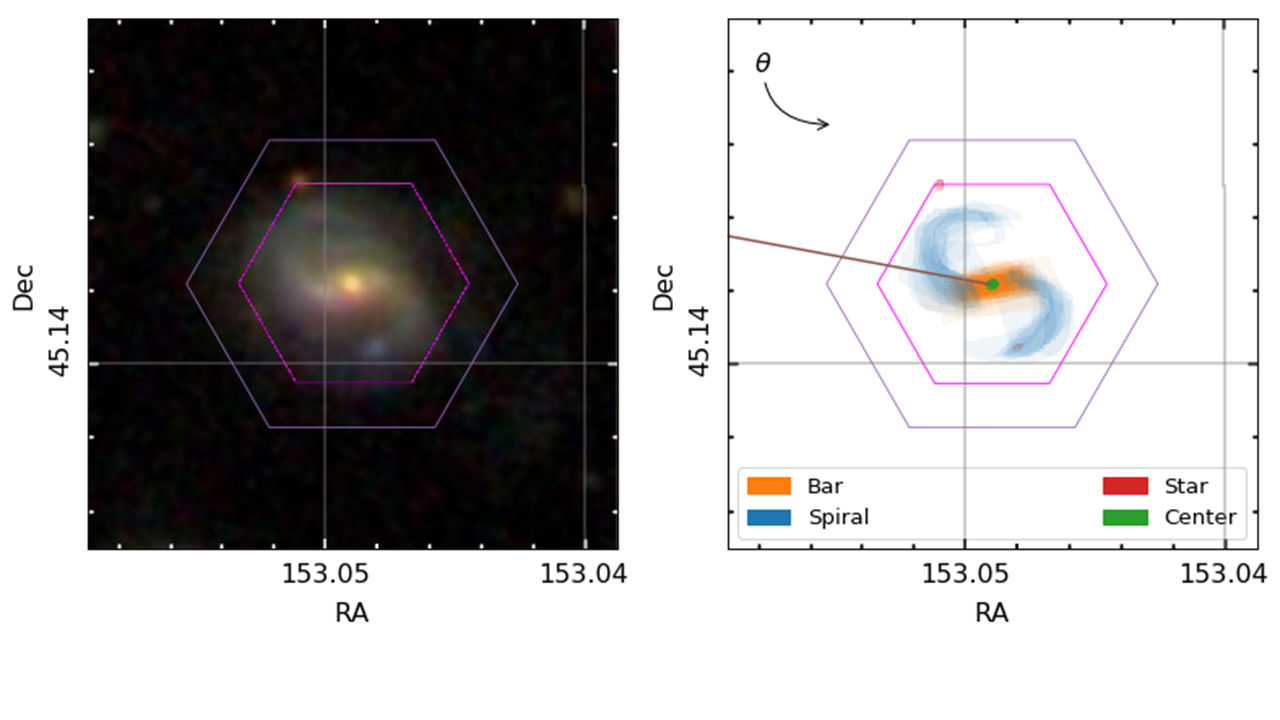
To properly do this, we need to know exactly where the spiral arms and bars are in the MaNGA galaxies, so that we can see how the stars vary in these different regions. Enter Galaxy Zoo: 3D, where volunteers are asked to tell us where the different components are.
An example galaxy in MaNGA, where we’ve managed to split the galaxy into different stellar populations of different ages. Each frame shows where we find stars of a given age in this galaxy, starting from the oldest stars and finishing with the most recently formed stars. The colour denotes the mean metallicity of the stars, shown by the scale at the bottom.
All of this is what my most recent publication is about (read it in full at https://doi.org/10.1093/mnras/stz2204); we’ve shown that by combining the full spatial information available from MaNGA (augmented by Galaxy Zoo:3D) with the full distributions of the ages and metallicities of stars in each location, we can start to see some interesting things in the bar and spiral arms. It’s definitely best illustrated by an animation.
By splitting the age distributions up into different “time-slices”, we can create images of where stars of different ages are located in each of our MaNGA galaxies. Immediately from this one example, it’s obvious that there’s a lot of things going on here.
There are a few features in the animation that we’re not entirely convinced are real, but the main exciting things are that the spiral arms only show up in the youngest stars, and the bar grows and rotates as we move from older to younger stars. The growth of the bar is intriguing; this might be showing us how it formed. The bar changing with angle is even more exciting, and we think it shows us how quickly new-born stars become mixed and “locked” into the bar. The arms show what we should expect; spiral arms are areas of intense star formation, but over time the stars formed there will become mixed around the disk. We measured this effect by looking at what fraction of stars of each age are located in the volunteer-drawn spiral arms from Galaxy Zoo:3D.
This is really interesting, and highlights the power of combining large surveys like MaNGA with crowd-sourced information from the Zooniverse.
The next step is to do these kinds of things with more than just this one galaxy though. I’ve started looking at how these techniques can measure how fast the disks of spiral galaxies grew, using a large sample of spiral galaxies identified by Galaxy Zoo 2 volunteers. I’m also trying to measure how quickly stars get mixed away from spiral arms in different types of spiral galaxies. I have started to find some hints of some exciting results on both of these topics, which I would love to share in a future blog post if you’re interested.
We need volunteers to tell us where the spiral arms and bars are in galaxies, so that we can start to see what makes these regions special.
However, I’m currently limited in the number of galaxies with spiral arm regions identified by Galaxy Zoo:3D volunteers, so it would be really helpful if we could get some more! Understanding what makes spiral structure appear in disky galaxies is one of the unsolved problems in galaxy evolution and formation, and the clues to finding out might well lie in measuring how spiral arms affect the galaxy’s stars. Galaxy Zoo:3D will definitely be able to play a role in this! Help us out at https://www.zooniverse.org/projects/klmasters/galaxy-zoo-3d.
New paper on Red and Blue Spirals and Ellipticals
Just a quick note to point out a new paper based on Galaxy Zoo classifications appeared on the arxiv this morning (and just accepted to MNRAS): The Differing Star Formation Histories of Red and Blue Spirals and Ellipticals, by Rita Tojeiro et al.
In this work we took samples of galaxies split by their morphological classifications (from you all, and actually going back to the original Galaxy Zoo project) as well as by their optical colour. With the help of an Ogden Trust undergraduate summer student (Joshua Richards) we then compiled the average star formation histories of these samples, based on fits of star formation models to the Sloan Digital Sky Survey spectra of the galaxies (previously published and called VESPA, or “VErsatile SPectral Analysis” by Rita).
Our main result was that red spirals differ in their star formation histories from blue spirals only in the last billion years or less. We also find that blue ellipticals have very similar star formation histories to blue spirals. We show some results about the dust and metal (astronomers metal) content of the galaxies as well. I think it’s a nice project and I’m very happy to see it finally finished and published.
Thanks again for the classifications.
Galaxy Zoo in this week's Guardian
Just a quick note to let you know that there’s a very nice story about Galaxy Zoo, it’s beginnings and citizen science in general in the Guardian: http://www.guardian.co.uk/science/2012/mar/18/galaxy-zoo-crowdsourcing-citizen-scientists
It features, amongst others, our very own Alice (@penguingalaxy) and Hanny (@hannyvanarkel). For more late-breaking Galaxy Zoo news, why not follow us on Twitter (@galaxyzoo)?
The Sudden Death of the Nearest Quasar
When I told Bill Keel the results of the analysis of the X-ray observations by the Suzaku and XMM-Newton space observatories, he summed up the result with a quote from a famous doctor:
“It’s dead, Jim.”
The black hole in IC 2497, that is.

To recap what we know: the Voorwerp is a bit of a giant hydrogen cloud next to the galaxy IC 2497. The supermassive black hole at the heart of IC 2497 has been munching on vast quantities of gas and dust and, since black holes are messy eaters, turned the center of IC 2497 into a super-bright quasar. The Voorwerp is a reflection of the light emitted by this quasar. The only hitch is that we don’t see the quasar. While the team at ASTRON has spotted a weak radio source in the heart, that radio source alone is far too little to power the Voorwerp. It’s like trying to light up a whole sports pitch with a single light bulb – what you really need is a floodlight (quasar).
Now it is possible to hide such a floodlight. You just put a whole bunch of gas and dust in front of it. If there’s enough material, no light even from a powerful floodlight will get through. Imagine pointing it at a solid wall – even the brightest floodlight in the world will be completely blocked by the wall. In the realm of quasars, such a barrier is usually made up of the torus of material (gas and dust) spiralling in towards the black hole and settling into an accretion disk. So you can have quasars that are feeding at enormous rates and being correspondingly enormously bright, but our line of sight is blocked.
So there are two possibilities of what could be going on with IC 2497 and the Voorwerp:
1) The quasar is “on” but hidden by lots of gas and dust, or
2) The quasar switched off recently, but because the Voorwerp is 70,000 light yeas away, the Voorwerp is still seeing the quasar – after all, even light takes a while to travel 70,000 light years. This would make the Voorwerp a “light echo.”
So how do we distinguish between the two possibilities? The best way is to look at a part of the electromagnetic spectrum that generally has no trouble penetrating even thick walls: X-rays!
If the quasar in IC 297 is feeding, then we should see the X-ray light it is emitting even through the thickest barriers. That’s why we asked for observations with Suzaku and XMM-Newton. It took many months to gather and analyze the data before we were ready to write up a paper and submit it to the Astrophysical Journal as a Letter. The referee report was challenging but positive, and the Letter got accepted rapidly. The pre-print is now out on arxiv: http://arxiv.org/abs/1011.0427
So what did we find? We found something, but it isn’t a quasar. With the X-ray data, we can definitely rule out the presence of a quasar in IC 2497 powerful enough to light up the Voorwerp. We do however see some very weak X-ray emission that most likely comes from the black hole feeding at a very low level. Compared to what you need to light up the Voorwerp (the floodlight), the black hole currently puts out 1/10,000 of the required luminosity. That’s like trying to illuminate a sports stadium at night with a candle.
We can therefore conclude that the black hole in IC 2497 dropped in luminosity by a factor of ~10,000 at some point in the last 70,000 years. This implies a number of very exciting things:
1) A mere 70,000 years ago (a blink of an eye, cosmologically speaking), IC 2497 was a powerful quasar. Since it’s at a redshift of only z=0.05, it’s the nearest such quasar to us. Since IC 2497 is so close to us, and the quasar has switched off, it means that images of IC 2496 are the best images of a quasar host galaxy we will ever get.
2) Quasars can just switch off very quickly! We didn’t know they could do this before, and the fact that they can is very exciting.
3) Maybe the quasar didn’t just switch off, but rather switched state, and is now putting out all its energy not as light (i.e. a quasar), but as kinetic energy. That’s an extremely intriguing possibility and something I want to investigate.
—————————————————————-
We put out a press release via Yale. You can find it here.
X-ray paper submitted!
Just a quick note: I’ve finally submitted the paper on the X-ray observations of IC 2497 and the Voorwerp with XMM-Newton and Suzaku. It’s a Letter so we should hear back fairly soon, so stay tuned!
Zoo 1 data set free
Hi all
It’s taken longer than it should have done – more than three years since the launch of the site – but the data from the original galaxy zoo is now available.

The paper describing the data set was only accepted by the journal yesterday, but we were confident enough after an earlier report to go ahead and make it public. The data can also be downloaded in a variety of formats from our site, or via Casjobs.
The data set is slightly updated from our previous efforts; while we’ve been busy with Galaxy Zoo, the good people of the Sloan Digital Sky Survey produced a new data release which included more spectra, allowing us to estimate biases for more galaxies than ever before.
We’ve had a lot of fun exploring this data set, and we hope that by making it available to all other astronomers then they will make use of your classifications too.
Knowing the Zoo, I wouldn’t be too surprised to see something interesting come from any of you who wanted to have a play – feel free to download and dig in, and let us know how you get on. Meanwhile, the team are working hard on Zoo 2, and hopefully it won’t take as long before that data set too is ready to go.
Do galaxies care where they live?
Does where we live make a difference to the kind of person we are? This is a question that has been addressed many times by social scientists, and certainly with more refined thought than the following example, but it will serve our purposes.
Consider one person, Victor, living in a small countryside village, and another, Claire, who lives in the centre of a city. The nearest shops to Victor are many miles away. When he has a sudden biscuit craving and opens the cupboard to find, to his horror, that his wife finished off the last packet the previous evening, it is a great effort for him to travel to the shops to get another. Claire, on the other hand, has merely to stroll to the corner of her road to satisfy her craving for something crunchy. However, while Claire often finds herself nipping out for a packet of biscuits, Victor rarely has the need. He always makes sure he buys plenty of biscuits on his regular weekly shopping trip, and there is always the packet hidden at the back of the other cupboard that his wife hasn’t noticed. Victor is very organised, while Claire clearly isn’t, at least when it comes to biscuits. Does this have anything to do with where they live?
Of course, biscuit buying habits, although important, aren’t the only thing one can say about an individual. Each person is complex and unique, imperfectly describable even by a very large number of personality traits. However, there are simple and obvious ways of crudely dividing up the population. Although we have so far confined ourselves to biscuits, the chances are that Victor is generally more organised than Claire. Perhaps there is a way of dividing people into groups by how organised they are. I’ve no idea, but there are small number of general personality traits, like introvert and extrovert, that describe how many specific personality traits tend to group together, such that you can give reasonably good description of someone by just a few words.
By now you are sure to be wondering what the hell this has got to do with galaxies. Well, to date there has been very little research into the biscuit hoarding characteristics of different galaxies, but like people, galaxies are extremely complex objects. There are so many processes simultaneously going on inside them that we just can’t fully describe each one, never mind understand how those processes go towards forming the properties of the individual as a whole. However, one thing about galaxies, that you can’t help noticing when you’ve looked at a enough of them, is how cleanly they can be split into two different types: spirals and ellipticals. Spirals are, at least in some respects, very organised. Most of their stars are travelling in circles around the galaxy centre in an ordered manner. Ellipticals, on the other hand, are in disarray. Their stars move around on many different, random orbits. (It is interesting how the appearance of order, a nice smooth elliptical galaxy, appears when many unorganised things happen at once, but that is a whole other topic.)

We’ve made the distinction between spirals and ellipticals completely obvious in Galaxy Zoo by only giving you those two options, along with “star/don’t know”. Even so, if we’d just sat each of you at a table with a pile of galaxy pictures to sort, without giving you any instructions about how to do it, most of you would probably have arrived at the same way of dividing them up. Those of you who value simplicity would have formed two or three piles. The pickier ones amongst you would probably be surrounded by lots of neat little stacks, containing galaxies with two sprawling spiral arms, with many tightly wound arms, big blobs, small blobs, red, blue, and so on. Nevertheless, the main distinction, the difference between all the galaxies on your left and those on your right, would probably be whether they possess a disk, often containing spiral arms, or whether they are just a big, smooth elliptical.
Of course, as many of you will have noticed, not all galaxies do fit into a nice category. So, as well as your stacks of spirals and ellipticals, you would be likely to have a collection of weird objects. However, these only form a small fraction of the whole population of galaxies. Whether you choose to hide your pile of odd galaxies away to one side, or display it smack right in front of you, again depends on your character. The projects examining blue ellipticals or Hanny’s Voorwerp belong to the latter class – confronting the occasional odd object to see what secrets it can tell us. The analysis I have been working on has more of the former character: as most objects are elliptical or spiral, let’s ignore the few weird ones and study how the majority behaves. One problem with working with the majority is that this is very many objects, hundreds of thousands of galaxies. To analyse a dataset this large we have to use statistics, for example we consider the fraction of objects that are elliptical, and how that changes when we only look at galaxies with certain properties.
If you did the galaxy sorting exercise described above you would be reproducing work performed by many astronomers over the past ninety years, including Hubble, de Vaucouleurs and Sandange. This subject is called morphology, literally the study of the ‘forms’ that galaxies take. Strictly morphology doesn’t include a description of the colours of galaxies, but rather their shape or appearance in greyscale.
The distinction between spirals and ellipticals was noted even before it was fully accepted that these objects reside outside our own galaxy. It was also noticed, almost immediately, that spirals and ellipticals are distributed differently on the sky. They all tend to cluster together in groups, rather than being evenly or randomly arranged, but ellipticals cluster much more strongly than spirals. Ellipticals live in galaxy cities, alongside many others, whereas spirals prefer the villages and isolation of the cosmos’ countryside.
To use more scientific language, ellipticals are concentrated in high density regions, where many galaxies are located in a small volume of space. Spirals, on the other hand, are usually found in low density environments, where galaxies are separated from others by large distances. As mentioned earlier, the dependence of galaxy morphology on the density of surrounding galaxies was noticed early in the 20th century. However, it wasn’t until the 1980’s that it was well quantified in two landmark papers by Dressler (1980), looking specifically at large galaxy clusters, and Postman and Geller (1984), who extended the relationships to lower density environments around clusters and smaller groups. These studies tried to classify galaxies as ellipticals, spirals, or lenticulars. This last type is a galaxy morphology somewhere between a spiral and an elliptical: with a disk, but with no spiral arms. Lenticulars are tricky to classify, and so in Galaxy Zoo so far we haven’t asked the classifiers to try and identify them. Galaxy Zoo “ellipticals” will contain normal ellipticals, and most of the lenticulars. This issue will be discussed more in future posts.

This figure shows the morphology-density relation from Postman and Geller (1984) and Dressler (1980), based on around 9000 galaxies. The lines show the fraction of ellipticals (red), lenticulars (orange), and ellipticals + lenticulars (purple) versus a measurement of local density. The different lines of the same colour just indicate three different sources. You can see that as local density increases, going from left to right in the figure, the fraction of ellipticals and lenticulars increases.
With the latest Galaxy Zoo data provided to me by Anze, I set to work analysing how a galaxy’s morphology depends on the environment it lives in. The initial thing I had to do was carefully measure and correct for any biases in the morphological classifications. This in itself is interesting, although it tells us more about people and the telescope than about galaxies, so I won’t discuss it further here. The next thing to do was to find out about the environments of the galaxies – specifically the local galaxy density. These were kindly provided by Ivan Baldry, an astronomer at Liverpool John Moores University who has done lots of work on the variation of galaxy colours with environment.
When I had my corrected dataset, with measurements of environment added in, the first thing I looked at was the relationship between the fraction of galaxies that are elliptical and local galaxy density.

This figure shows the morphology-density relation for nearby galaxies from Galaxy Zoo, based on 100733 objects. The light shading indicates the very small uncertainties on the relation.
It is difficult to directly compare the Galaxy Zoo morphology-density relation with that by Postman & Geller (1984) shown further above. This is because the local density was measured in a different way, and they include lenticular galaxies separately. However, it is easy to see that the overall behaviour is the same. In regions of high density the fraction of elliptical galaxies increases. The Galaxy Zoo relation is much more accurate, as it is based on more than ten times the number of galaxies, and very clearly defined, which will enable future studies and models to easily compare with it. It shows clearly that morphology depends smoothly on local galaxy density over all environments. Even in the lowest density regions there is some dependence.
Now is a good time to think back to Victor and Claire. Like Victor, organised spiral galaxies tend to live in areas of low density. Disorganised ellipticals are found where many galaxies cluster together, somewhat comparable to the city Claire lives in. But is Victor organised because he lives in such an isolated place, and is forced to be; or is he just an intrinsically organised person, and so living in the countryside didn’t seem such a problem? Likewise, is Claire disorganised because of where she lives? Do the plethora of nearby shops make biscuit hoarding unnecessary? Or is she simply a disorganised person, and so chose to live in the city to avoid having to be organised? If Victor moved to the city, would be become more disorganised? Would the place he lives change his personality?
Obviously galaxies don’t choose where they live, in the sense that Victor and Claire can, but the analogy is still strong. Are there more ellipticals in clusters because that’s where ellipticals happen to be, or because something about where they live has turned them into ellipticals? If otherwise identical galaxies form in areas of different densities, would they be the same, or is there something happening in dense regions that changes galaxies into ellipticals? Maybe something about dense regions turns organised galaxies into disorganised ones.
One of the powers of Galaxy Zoo is the staggering number of galaxies we have data for. It is possible to divide up our sample by a variety of galaxy properties, such as their mass and colour, and still have enough galaxies in each slice to see how environment affects that particular subsample. Each of these different properties tells us something different about a galaxy, and enables us to go someway to disentangling their intrinsic properties from recent changes. I’ll discuss the things we’ve learned by doing this in future posts.
Inside the first results
As Jordan’s already said, this blog is supposed to give you, our users and collaborators, a window into the research we’re doing. As I suspect most of you know, we’re working on a set of papers which will hopefully be submitted to a journal in the next month or so. The first set will probably contain four papers, and I thought I’d give you a run down of what each of these four is designed to do.
Although the whole team will be listed as authors (and we’ll include a link to the site which gives credit to those of you who have chosen to enter the names on the special page on the site), each is being led by a different team member. My paper is a general overview of the project, including a discussion of the process by which we’ve gone from clicks on the webpage to a catalogue of galaxies. The idea is to provide all the information that others working with our data might need in one place, and to avoid having to duplicate information in each of the individual papers.
Steven (in Portsmouth) is writing a paper that focusses on comparing the spirals and the ellipticals; he has to be more careful than most to account for the tendency of faint fuzzy things to be classified as elliptical galaxies, and has developed a whole set of tools to keep an eye on this. The results are excellent; we’ve always known that ellipticals tend to live in denser environment than their spiral counterparts, but with Galaxy Zoo we can really look at the details of this relation.
Kevin’s paper discards most of the galaxies to focus on some of the oddballs; the infamous blue ellipticals. Most elliptical galaxies are supposed to have finished star formation long ago, but these are still going strong. We’re planning to publish a list of these in the paper so hopefully other people will be able to follow them up alongside us.
Finally, Kate and Anze are leading the cosmology study, looking at the rotation direction of spirals. They’re desperate to get the bias study that’s now underway done so that their paper can be finished off – that’s the most critical thing at the moment so every classification you make gets us closer to being able to release the first science results.In the meantime you’ll hear more about each of these projects over the next week or two on this blog, but do comment in the meantime either here or on the forum.
I’ll finish with a couple of mea culpas – when I send out the email announcing our Christmas gift to you, I should have said that the link was on the left of the analysis page, and realised that for some of you it was the Summer Solstice. I won’t make either mistake again (just different ones). Chris
