Classify Now
Excited to join in? Click here to go to Galaxy Zoo and start classifying! What could you discover?
Announcing the Overlap Zoo project!
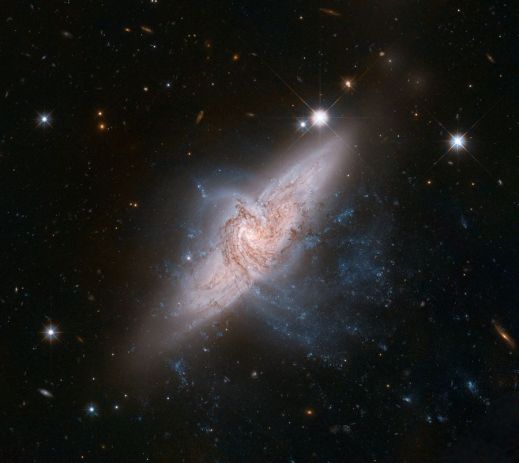
We are excited to announce the launch of Overlap Zoo, a new project under the Galaxy Zoo umbrella! Among the several million galaxies classified in previous Galaxy Zoo projects, a small number of those galaxies happen to overlap one another serendipitously. Now we need your help to classify these rare cosmic objects. We are launching Overlap Zoo with ~4200 candidate overlapping galaxy images from the DESI Legacy Imaging Survey, selected from previous Galaxy Zoo projects, and we invite you to help us identify which of these galaxies are truly overlapping pairs and help us categorise and catalogue them for use in future studies.
A Brief History
To understand how this project came about, it is useful to first look briefly at the work that inspired it. Prior to the start of this project, from around the 1980s through the early 2000s, astronomers began identifying and analysing a small number of individual overlapping galaxy pairs discovered by chance in various astronomical surveys. While these systems provided the astronomers at the time with valuable opportunities to study the properties of overlapping galaxies and dust, a sample consisting of only a small number of pairs was ultimately insufficient (we’ll talk more about the why later!).
This small initial sample was later expanded in 2013, when a project led by Galaxy Zoo team member and astronomer Dr. William ‘Bill’ C. Keel was conducted using imaging data from the Sloan Digital Sky Survey (SDSS) and the help of Galaxy Zoo volunteers to identify candidate overlapping pairs. Rather than relying on chance observation, this approach demonstrated that citizen science, in this case, forum science, could be used to identify a substantial number of overlapping galaxy pairs. This approach was also particularly valuable because these objects are often difficult to identify automatically, and human visual inspection is much better at distinguishing genuine overlapping pairs from apparent overlaps.
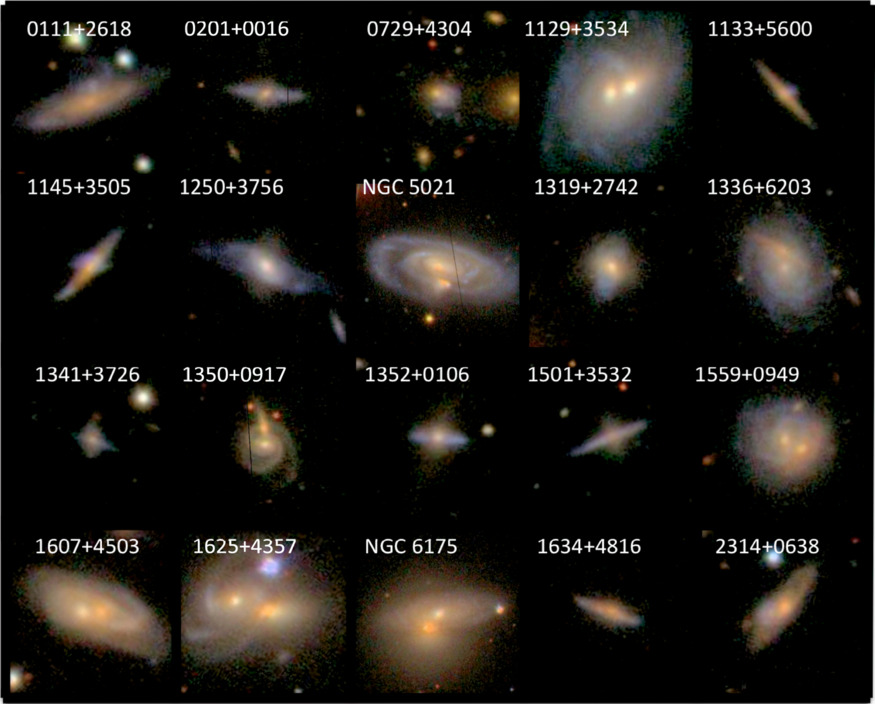
The combined efforts of all the volunteers resulted in the creation of a new large-scale catalogue of about ~2000 overlapping pairs. While this represented a significant increase in sample size, the relatively limited image quality of SDSS made it difficult to study these systems in detail on the scales they were looking for. Nevertheless, it was still a success for classifying and categorising these systems and identifying promising candidates for follow-up observations.
Now, almost a decade later, this earlier project serves not only as the first large-scale catalogue of these objects, but also as the main inspiration for our project, Overlap Zoo. At the same time, the new generation of astronomical surveys from ground and space observatories, including Euclid, the Vera C. Rubin Observatory, the Nancy Grace Roman Space Telescope, and more, have begun, or will soon begin, providing us with higher-quality views of the Universe than ever before. With these extremely powerful new resources becoming available, we now, more than ever, have an exciting opportunity to revisit the study and cataloguing of overlapping galaxies and expand upon previous efforts through our new citizen science project on a much larger scale.
The Science
So, what makes overlapping galaxies so special? Why do we want to study them? These are great questions that I’m sure you were asking yourselves when reading. Now, after learning about how we got here, we can finally get to the why!
When you see a beautiful picture of a galaxy, you may notice a few things right away: its colour, the different structures throughout its disk, the bright core at its centre, and all of the other features that make each galaxy unique. But what we are most interested in are those dark brown patches that you can see throughout the galaxy (like in the picture below!). These dark patches are actually dust, and they can tell us a lot about what is happening inside galaxies.
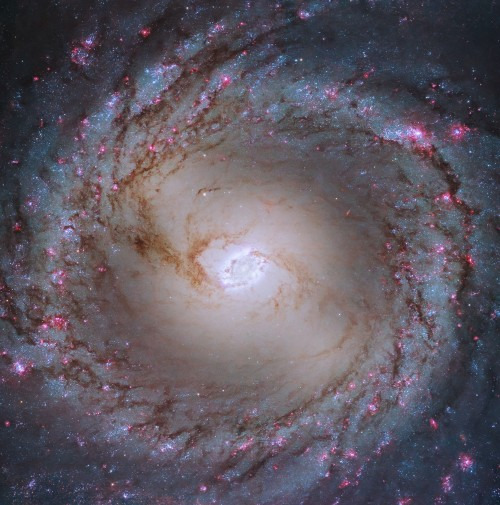
This dust, which consists of tiny particles of silicates and carbon, is an extremely important component of the galaxy, but also a pain point for many astronomers. This is because this dust absorbs and scatters (attenuates) the light of the galaxy. And because we use that light to make many important measurements, such as measuring distances, dust can cause those measurements to be inaccurate. So, astronomers must correct for this attenuation of light in their measurements. It would also be good if we had some type of universal correction that we could apply to every galaxy. And one way we hope to do this is with overlapping galaxies!
When two galaxies happen to overlap along our line of sight, they essentially become an astrophysical laboratory for studying galactic transparency. You can think of the background galaxy as a sort of cosmic flashlight. When it lies behind a foreground galaxy, its light shines through the overlapping region, giving us a direct way to see how much light the dust in the foreground galaxy blocks. By modelling the light from both galaxies and comparing the light that passes through the foreground galaxy with the light from unobscured regions, we can create a map of the dust in the foreground galaxy and also, importantly, measure how much light each region blocks. This direct method, in comparison to other methods, is what makes these systems so valuable to us.
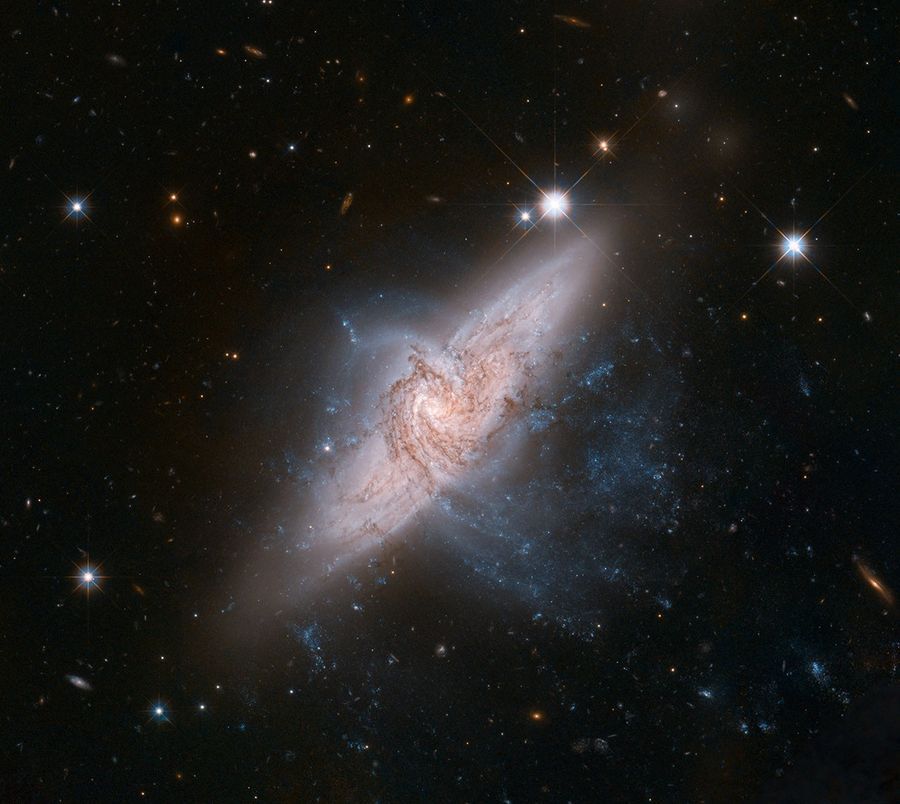
But not every overlapping pair is created equal. If our ultimate goal is to develop a correction that can be universally applied to every galaxy, we first need to understand dust across the many different types and configurations of overlapping pairs that exist. Some configurations can be more useful than others. There are those that are better suited for studying dust in the outer regions, while others allow us to probe into the deeper inner regions. There are also those that are more sensitive to the effects of dust and are easier to model, and vice versa. In other words, every overlapping pair that we can apply our methodology to will provide us with a slightly different piece of the whole picture of dust itself, each with its own advantages and limitations that we must consider when using these systems.
So, by creating dust maps for many different overlapping galaxies, we can begin to put those pieces together and build a more complete picture. With this information, we can hopefully provide astronomers with the data they need to better correct for the effects of dust in their measurements. But we haven’t got there yet!
The Need for a Bigger Sample
Why did we launch Overlap Zoo? What is our goal? To actually start creating those dust maps for many different pairs, we need to move beyond our relatively small sample and build a much larger one. We need as many systems as possible because, among them, we hope to find the rare, ideal configurations that are best suited for applying our technique and achieving this goal.
This is why we launched Overlap Zoo! Our goal with this project is to leverage citizen science and find as many overlapping pairs as we can to support a larger-scale study of these fascinating objects. With enough ideal systems, we could realistically have a background galaxy behind every part of a spiral galaxy—the arms, the outer disk, the inner disk, and so on. This would let us build those dust maps across different regions of spiral galaxies and see how the distribution of dust, and the amount of light it blocks, varies from galaxy to galaxy. We could do the same with elliptical galaxies, although these tend to contain less dust. With these in hand, we can see if there is a universal attenuation law that we can use for each galaxy. We are actually not entirely sure if this is the case yet, so this is extremely important for the field of astronomy as a whole! The more overlapping pairs we find, the better our chances of finding the right systems for these studies and the closer we get to finding a proper answer.
That’s where you come in. Every classification you contribute to Overlap Zoo brings us one step closer to building the sample we need to make these studies possible!
Volunteer Tasks
What will you do in our project? How can you help us? Your task in Overlap Zoo is to answer a series of questions that will help us identify the configuration of each overlapping galaxy pair. You will be presented with an image of an overlapping pair and guided through a series of questions that may feel familiar to Galaxy Zoo, but also slightly different, as we are considering not one, but two galaxies.
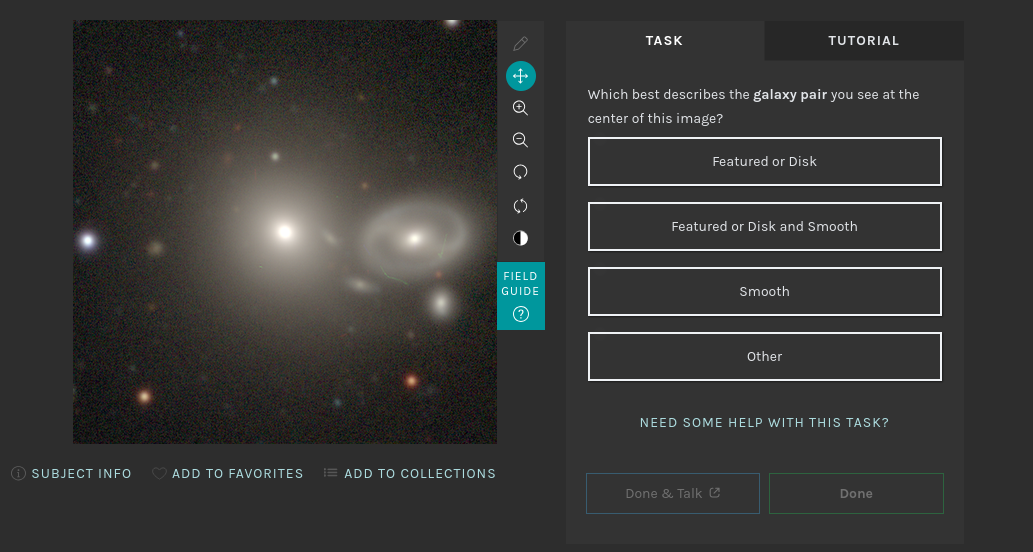
There will also be some questions that will be completely unfamiliar to a typical Galaxy Zoo classifier. We have tried our best to provide as much information as possible so that you can confidently answer these questions. We encourage you to take your time and refer to the field guides or other resources whenever you are unsure about how to classify a particular pair.
To get involved in our project, head over to Overlap Zoo and start classifying now! We look forward to your classifications and your help in expanding our catalogue of these objects for future research!
We look forward to your help,
Trevor Butrum and Benne Holwerda.
A quick summary – Galaxy Zoo in its 20th year
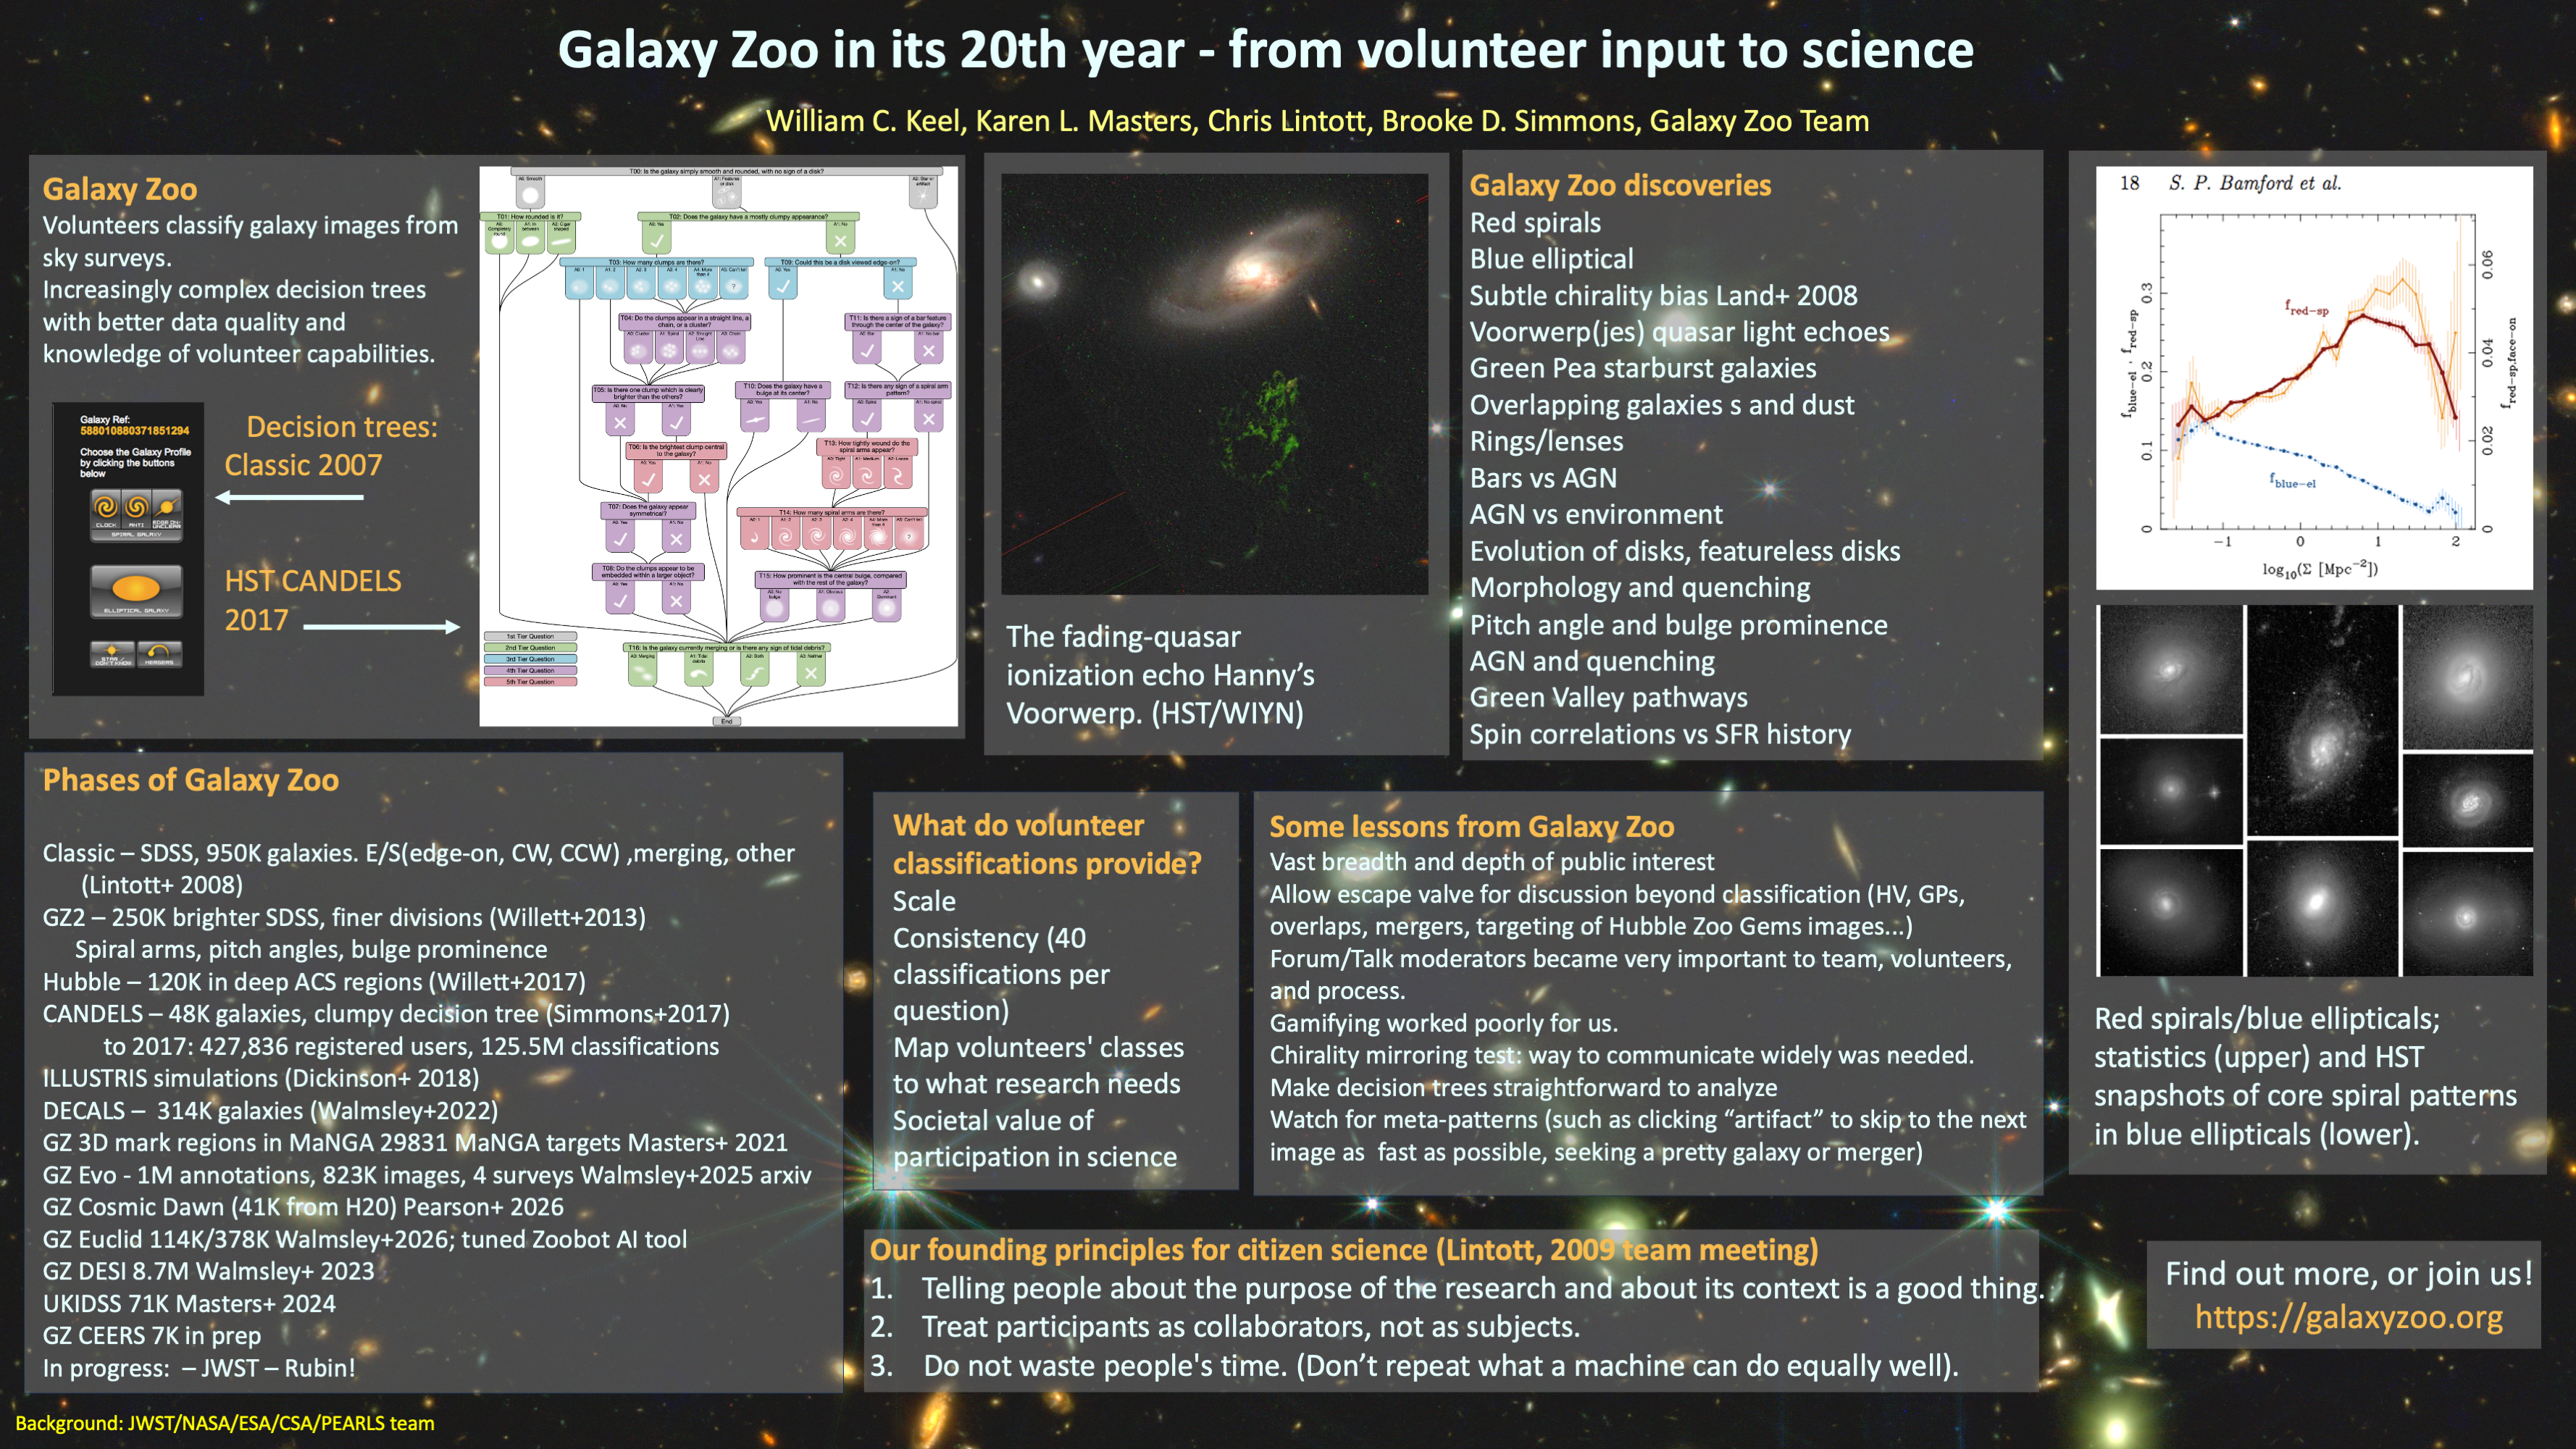
The Astronomical Society of the Pacific (also known lately as the Astro Society to stress that their membership isn’t just around the Pacific Rim) recently held their annual meeting, this time experimenting with a completely virtual format while preserving panels, workshops, and interaction with poster presenters. One of their specific topics was “Building the tools of discovery – observatories, technology, and citizen science that change our understanding of the Universe” That seemed as if Galaxy Zoo ought to be represented, so we put together this poster very briefly summarizing some of the project history, scientific results, and lessons we’ve learned.
Each poster was accompanied by a 60-second “elevator pitch” so viewers could tell which ones they wanted to look at more closely. This one clocked in at 58 seconds at my reading speed: “Galaxy Zoo launched in 2007, as an early case of citizen science enabled by sky surveys and interactive Web design. Volunteers classify galaxy structures and flag unusual features, giving consistent results over large sample sizes. Galaxy Zoo has been wildly successful, leading to additional project phases involving successively higher-quality survey data and more sophisticated volunteer participation. This poster summarizes these projects, and some discoveries – red spiral and blue elliptical galaxies, quasar ionization echoes such as Hanny’s Voorwerp, and Green Pea extreme-starburst galaxies. We also collect some lessons the team has learned along the way, both in how to best interact with the volunteers and how to analyze data from public votes. More information, links to the project papers, and participation are all available at the project URL galaxyzoo.org.”
Here’s the poster itself, a very quick reminder of what we’ve all done with a gift that keeps on giving. Onward to GZ Roman!
Introducing Galaxy Zoo: Clump Scout II
Hi everyone,
If you’ve been following Galaxy Zoo for a while, you may remember the Galaxy Zoo: Clump Scout project. Now, Clump Scout is back, and we need your help with Galaxy Zoo: Clump Scout II!
The first Clump Scout project
Back in 2019, we asked you to help us find giant star forming clumps (or just “clumps”) in nearby galaxies. With your help, the first Clump Scout project was a resounding success. Over 14,000 volunteers took part, looking at nearly 60,000 galaxy images from the Sloan Digital Sky Survey (SDSS) and making millions of individual classifications. When the project completed, you had helped us identify clumps in more than 7,000 galaxies, giving us what was then the largest catalogue of clumpy systems in the local Universe.
What have we been doing since Clump Scout finished?
We’ve learned a lot from the results of Galaxy Zoo: Clump Scout and they provided a crucial foundation for the research that followed. By using the results to train a Deep Learning model, we were able to discover 41,445 bright clumps in 34,246 galaxies by searching over 240,000 SDSS galaxy images. This expanded clumpy galaxy sample allowed us to investigate whether clumpy galaxies are more prevalent in dense galaxy clusters or in the sparse voids between clusters.
Since then, we have continued to update our clump detection deep learning model and we have tried to fine-tune it to detect clumps in survey data from more powerful telescopes like the Subaru Telescope, and most recently the Euclid Space Telescope. These telescopes allow us to find fainter, smaller clumps in more distant galaxies and they produce sharper images that start to reveal the individual clumps’ substructure.
New images
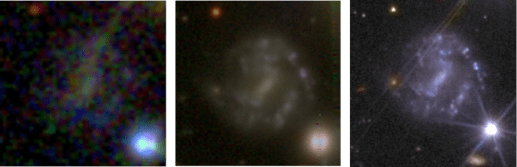
The three images in the figure below show the same galaxy as seen by the SDSS, the Hyper Suprime-Cam (HSC) camera on the 8-metre-diametre Subaru Telescope, and the two cameras on board the Euclid Space Telescope. The galaxy is barely visible in the SDSS image and certainly doesn’t show any obvious signs of being clumpy. In the HSC image the galaxy is clearly visible and shows several clumps that appear as bright, somewhat blurry blobs lying along the galaxy’s spiral arms. The Euclid image is much sharper and shows that the individual clumps from the HSC have complex substructure.
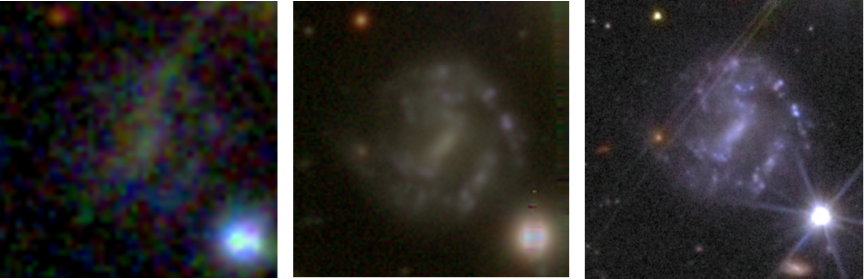
Figure 1. Three images of the same clumpy galaxy as seen by the SDSS Survey’s Apache Point 4 metre class telescope (left), the Hyper Suprime-Cam imager on the 8-metre diameter Subaru Telescope (centre) and the VIS and NIR cameras on the Euclid Space Telescope (right).
New science
Clumps are sites of intense star formation, which can deliver energy to their surroundings via several processes, which are often described collectively as “feedback”. For example, stellar radiation, stellar winds (streams of fast-moving charged particles launched from stars’ surfaces) and supernova explosions can all inject energy into the interstellar medium in and around the clumps. These feedback processes can have profound implications for the effect of clumps on galaxies’ growth and evolution. However, the effects of feedback depend crucially on how well it transfers energy out of the clump and how long the clump survives before being disrupted by material in their host galaxy’s disk. Both factors remain poorly constrained by observations.
How can high resolution Euclid images help to reveal the impact of feedback from clumps? Well, the Euclid images give us the ability to observe and study the detailed substructure of clumps. This is very useful because it allows us to compare real clumps with those produced in high resolution simulations of clumpy galaxies. An example comparison is shown in the figure below. These high-resolution simulations suggest that clump substructural morphology (the distribution of sub-clump shapes and sizes) is strongly correlated with feedback-related properties of clumps, including their longevity and how much energy from their internal star formation they can impart to their surroundings.
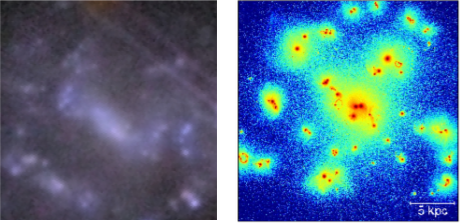
Figure 2. A clumpy galaxy observed with Euclid (left) compared to a simulated clumpy galaxy (right). With the detailed images we are now getting from Euclid, we can begin to study the substructures of clumps that we see should be there in simulations, telling us about clump properties like how long they can survive.
If clumps are resilient to disruption, then tidal forces are expected to make them migrate slowly towards the centres of their host galaxies. Feedback that is generated by the clumps’ as they migrate can regulate star formation in their host galaxies and may even drive gas and dust into the surrounding interstellar medium. Once clumps reach their host galaxy’s centres, they can dissolve and contribute to the growth of galaxy bulges.
The physical properties of simulated clumps can be directly extracted from the simulation data. If we find populations of real and simulated clumps with matching substructural morphology, then we will be able to infer that the physical properties of the real clumps are similar to the known properties of the simulated clumps.
New challenges
The new Euclid images provide new insights into the physics of clumps and clumpy galaxies but they also bring some challenges. Our clump detection model was trained using images with relatively coarse spatial resolution in which clumps normally look like blurry blobs. The complex substructure of the clumps in the Euclid images makes them more difficult for our model to identify. Our model that worked so well on low resolution images now gets confused and starts to mistake other objects, like foreground stars and background galaxies for clumps. Teaching the model to avoid these mistakes is one of the main purposes of Galaxy Zoo: Clump Scout II.
New project
Your task in Galaxy Zoo: Clump Scout II is to correct the clump labels generated by our model. You will be shown an image of a galaxy that our model thinks is clumpy with different coloured boxes, representing our model’s labels, overlaid. The figure below shows an example of the classification interface.
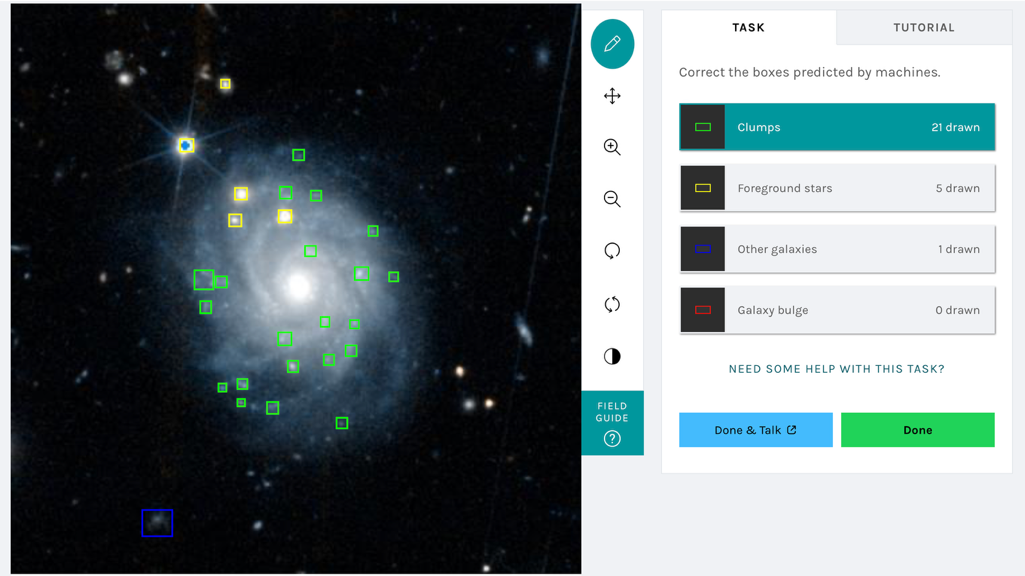
Figure 3. The Galaxy Zoo: Clump Scout II interface
The different box colours represent different types of astrophysical object – green for clumps, yellow for foreground stars, blue background galaxies and red for galaxies’ central bulges. We need you to examine all the boxes, make sure they surround real objects and check that those objects are marked with boxes of the correct colour. We also need you to mark any clumps that our model has missed. Your corrected labels will be used to incrementally retrain our model until it is able to accurately find all the clumps and contaminating clump-like objects in Euclid images.
Our finetuned model will ultimately allow us to search over 250 million Euclid galaxy images for clumps and assemble an enormous catalogue of clumps to analyse, helping to reveal the internal physical processes that drive the evolution of clumps, their host galaxies and their extragalactic surroundings.To get involved head over to Galaxy Zoo: Clump Scout II and start classifying today!
This project makes use of Q1 data from European Space Agency’s Euclid mission; learn more here: cosmos.esa.int/web/euclid/euclid-q1-data-release
A first Galaxy Zoo:Rubin project
We’re delighted to announce the first Galaxy Zoo workflow to include images from the NSF-DOE Vera C Rubin Observatory, using galaxies drawn from its first Data Preview.
First look image showing the diversity of galaxies we can expect from the Vera C Rubin’s LSST survey.
The new workflow went live on the site just now, but with only 10,359 subjects it won’t stick around for long, so do jump in and get classifying. While the goal, as ever, is to understand the processes which shape the galaxies revealed by this new survey, we will also use the results from this project to help us decide which of the millions of galaxies that will be included in images from the Observatory’s upcoming Legacy Survey of Space and Time (LSST), which will start soon, should be classified. To this end, we’ve also included three different images of each galaxy, combining images taken with different filters (technically, these are ugri, riz, and gri images) so that we can see how classifications change if we include information from the ultraviolet (u band) and infrared (i and z bands).
These images were taken as part of the testing and commissioning the observatory teams carried out while preparing the telescope and camera for action. They are a little more rough and ready than those we will expect from the main survey, but they are just the start.
Once the main survey starts, Rubin will produce a spectacular treasury of galaxy images, and we’ve been looking forward to it for a long time. The first mention of the survey on this blog comes from 2008 (when we expected the start date to be, um, 2013, which may have been ambitious even then). Still, good things come to those who wait, and we’re excited to see what you make of these new images.
Chris & the Galaxy Zoo team.
Investigating How Type of Galactic Bar Impacts Bar Quenching
We are happy to announce the acceptance of the latest science team paper making use of Galaxy Zoo classifications (the image below is a link to the paper). Also see this list of all Galaxy Zoo Science Team Publications (which is mostly complete, usually!).

This work was led by (at the time) undergraduate student Petra Mengistu (since Fall 2024 in the PhD Program at UCSC). Petra started this work as an undergraduate, spending the summer of 2023 working at Oxford with the Galaxy Zoo science team there, and then returning to Haverford to continue the work for her undergraduate senior thesis. I’m writing this as a very proud (former) undergraduate supervisor today.
As the”Part II” in the title suggests, this work is a follow-on from previous work. Tobias Geron already wrote in detail about the first paper on the blog Slow Strong Bars Affect Their Hosts the Most which has a lot of the background needed to understand this follow-on result.
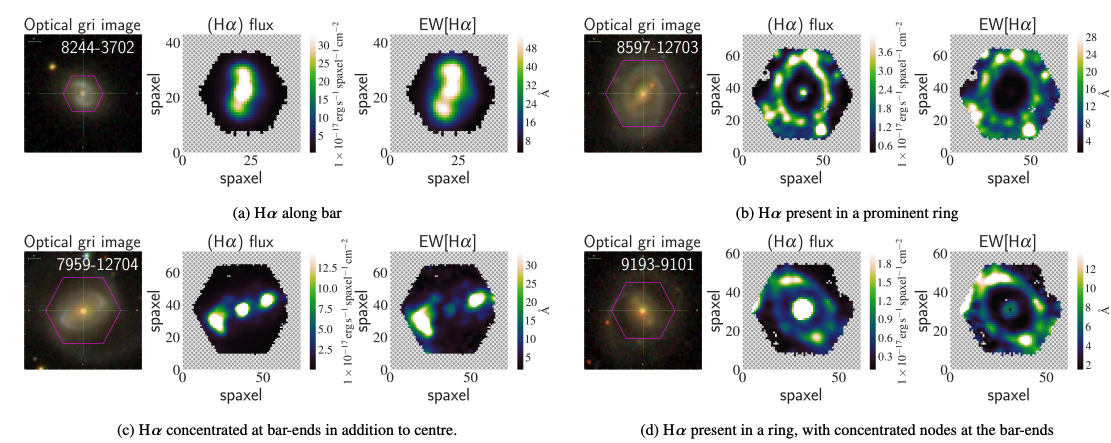
One fun thing we added was a look at the morphology of the ionized hydrogen around the bars in these galaxies (using data from the “MaNGA Survey”). This “Halpha” brightness can be traced by flux or “equivalent width” or EW (which is a measure of relative brightness compared to the stars you see in the normal images you are used to). It turns out this gas, which shows off where stars are currently forming in a galaxy – has a lot of different interesting shapes in barred galaxies, e.g. being found all along the bar, in rings or nodes.
The below image is a part of the sixth Figure in Petra’s paper.
There’s many more result in the paper, but I need to keep this blog post short for now.
Continuing to publish papers about bars in galaxies is also fun for me, as I’ve been working on trying to understand bars in galaxies using Galaxy Zoo classifications for well over a decade at this point. It’s great to see this work continuing with new samples and data and new understanding of the important role these structures play in stopping star formation in spiral galaxies. I wrote about bars for the blog “What’s all the Fuss about Bars in Galaxies” in 2015, or you can read this blog post from way back in 2010 (!) about our first Galaxy Zoo paper wondering “Do Bars Kill Galaxies”.
So thanks again for all the classifications. I’m excited for the future of this scientific area looking more at bars in the more distant universe (so looking back in time), which we already started with “Looking for Bars in Faraway Galaxies“, but I’m sure there will be much more to come.
Here be SDRAGNS! Results from Radio Galaxy Zoo and Hubble’s Zoo Gems
It’s taken a while to get this finished, but I am happy to say that our paper combining Radio Galaxy Zoo and Hubble data on the rare spiral galaxies with large double radio sources (also known as SDRAGNs, Spiral Double Radio AGNs) has been accepted by the Astronomical Journal. The RGZ-HST sample is the largest set of such objects known (we found 15 cases, compared to 11 from everyone else published up through late 2025). With the collaboration of Alexei Moiseev and students using the 6-meter telescope, we could complete the set of redshifts and optical spectroscopic properties for these SDRAGNs
The Zoo Gems project of short-exposure Hubble observations gave us images of 36 potential SDRAGNs. Most of these turned out to be something else – a disturbed but not spiral galaxy, a spiral almost in front of the more distant radio galaxy… Still, we confirmed enough to more than double the known sample of these rare systems from 11 to 26, selected in more systematic ways than their predecessors. As a group, SDRAGNs have a wide range of Hubble types, from Sa to Sc – this was a bit unexpected, since the mass of the central black holes correlates with the bulge starlight, and the radio sources are probably powered by very massive black holes. (Also, another group including Wu, Ho, and Zhuang analyzed many of the Zoo Gems SDRAGN candidates and found that most of them have pseudobulges rather than classical bulges, which suggests that these galaxies have not undergone a major merger over their history). SDRAGN host galaxies are seen nearly edge-on more often than would be expected for a random set of spirals. We do not see many strong interactions, although there are several SDRAGNs with dust lanes twisted out of the galaxy plane which could result from a weak interaction a billion years before our current view. These galaxies occur in denser environments than average as traced by other galaxies, which fits with our understanding of the need to have circumgalactic gas for the radio jets to interact with in order to produce the powerful lobes of radio-emitting material. Combining the radio structures with galaxy properties from the Hubble images, perhaps our key results is that the radio jets merge preferentially within about 30 degrees of the poles of the galaxy disks. This helps understand why the jets make it outside the galaxy – they encounter the least interference from gas within the galaxy that way. This contrasts with the random orientations of those radio jets which happen in spiral Seyfert galaxies, which really do seem to have random directions and mostly dissolve within a few thousand light-years as they encounter the dense gas within the galaxy itself. Returning to the incidence of pseudobulges, within a major merger we expect the black hole to grow by incorporating material from within the galaxy, so it would keep roughly the same “spin” direction as the galaxy disk and impart that to the accretion disk and jets. This directionality seems to be more important than the mass or accretion rate of the black hole in producing SDRAGNs.
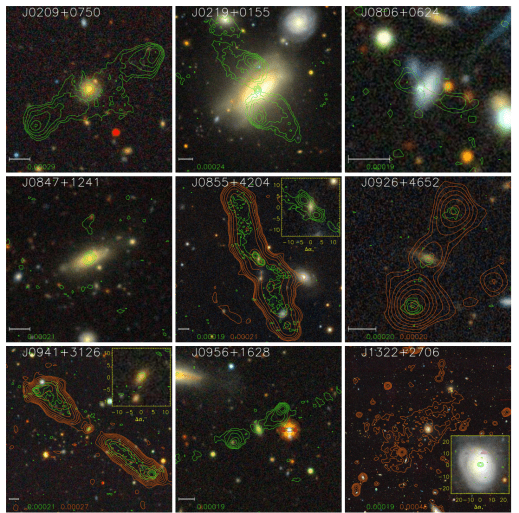
As examples of the data we could work with, here is a montage of 9 SDRAGNs using SDSS images overlaid with VLA Sky Survey contours (green) and contours from the lower-frequency LOFAR sky survey (orange). The LOFAR data became available only after the original Radio Galaxy, and are much more sensitive to the diffuse emission from radio lobes.
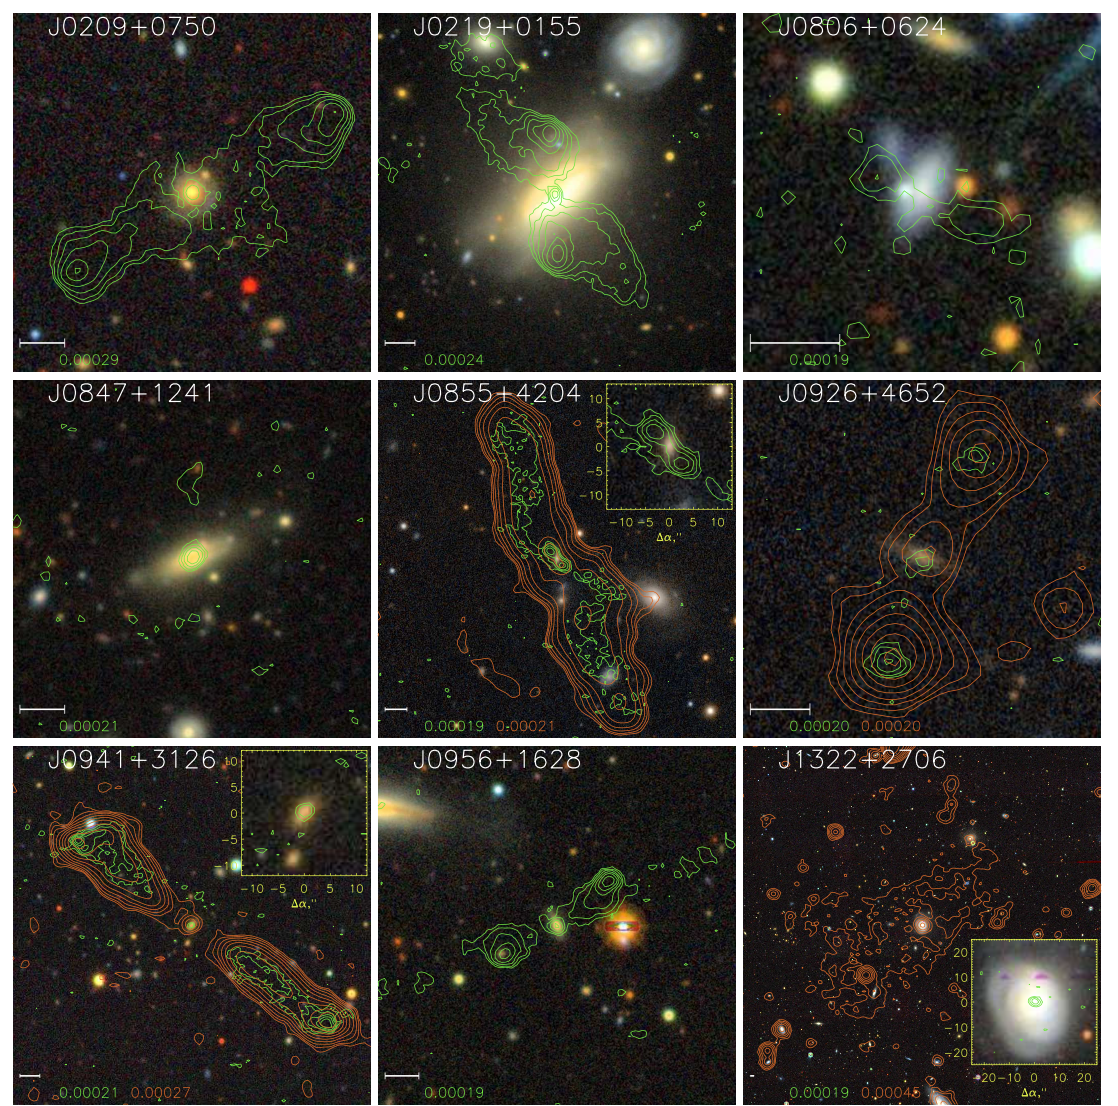
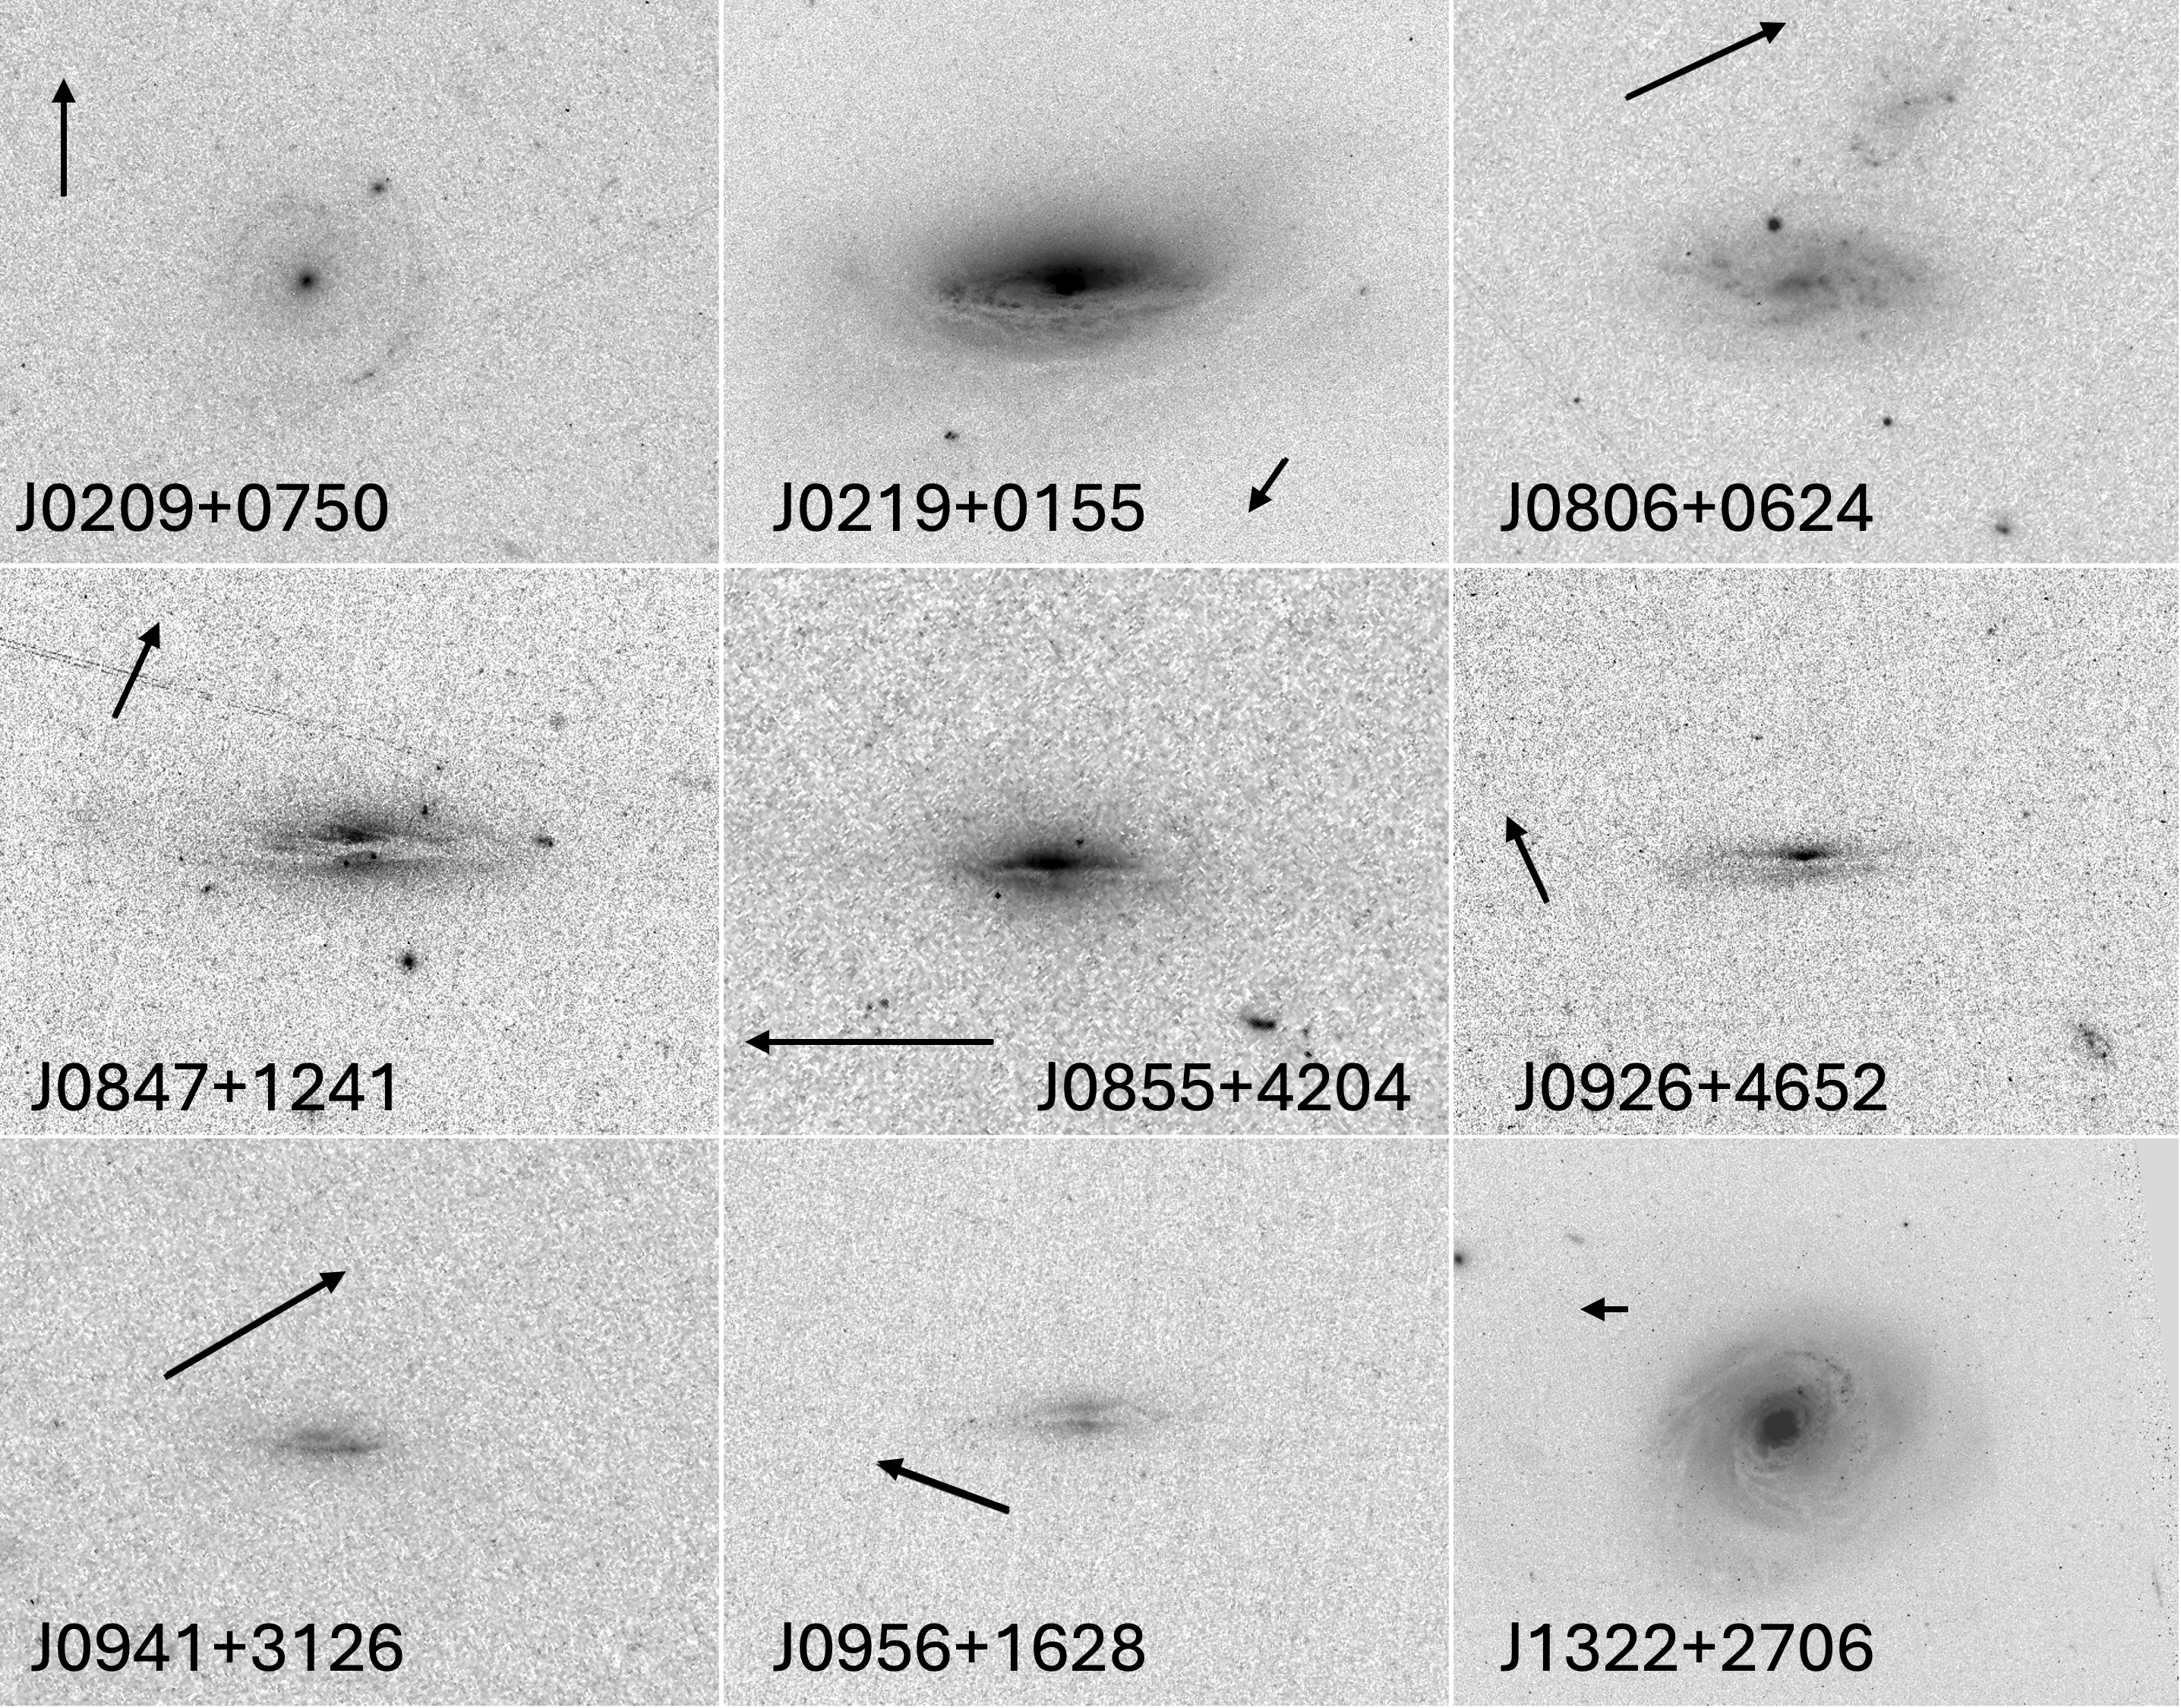
This montage shows the same nine SDRAGNs in negative views of the Hubble blue-light images. They are oriented so the galaxy plane is horizontal; arrows mark north and are 5 arcseconds long (matching the scale bars on the radio overlays).
Given the roots of Radio Galaxy Zoo and Zoo Gems in the Galaxy Zoo family, it would happen that one of the Hubble targets which turns out to not be a spiral does have a giant emission region similar to Voorwerpjes. We can’t help it, they are everywhere (and from some JWST data, almost everywhen too).
The manuscript is available from the arxiv repository (and from the AJ web site in a couple of months, after formal publication). Much of the text in the first two sections comes from a draft written by the late Jean Tate even before Hubble data started to arrive, and once again we regret that he did not live to see some of the later Hubble images. This was a favorite project of Jean, who managed most of the initial voting to select HST imaging candidates and kept the SDRAGN material in a PBWorks online repository, so well organized that we could reconstruct a great deal of the project detail from there. (The paper includes the master table of all 215 RGZ SDRAGN candidates in case someone else wants to follow them up).
Fresh Paint and Familiar Faces: Updates from Galaxy Zoo
We have two quick but exciting updates to share with the Galaxy Zoo community today!
1. Galaxy Zoo’s updated look
Today, Galaxy Zoo is officially migrating to the Zooniverse’s new frontend codebase. This transition brings a fresh, updated design to our project and a more user-friendly interface for your classifications.
This move won’t affect your existing stats, collections, or favorites. The update is all about making the site faster, more accessible, and easier for our team to maintain in the long run. For a deeper dive into the technical details and what this means for the future of the Zooniverse, check out this post over on the Zooniverse blog.
2. Galaxy Zoo featured in recent ISSI video
During our team meeting at the International Space Science Institute (ISSI) in Bern last year, Galaxy Zoo team members Karen Masters (Galaxy Zoo PI) and Becky Smethurst (Dr. Becky) answered some questions about the project and what our team has been working on in the JWST era. In this short video, they discuss why galaxy morphology is so important for understanding the history of the Universe, our recent Galaxy Zoo efforts with JWST, and the incredible impact your classifications have on our science. Check it out below!
As always, thank you for all your hard work and for being such a vital part of the Galaxy Zoo team.
Happy classifying!
— The Galaxy Zoo Team
Almost 1 Million Classifications on GZ JWST! 🎉
We’re thrilled to share that Galaxy Zoo volunteers are about to reach an incredible milestone: 1,000,000 classifications on GZ JWST!
GZ JWST first launched back in April 2025 with over 300,000 galaxies from the COSMOS-Web survey. In the 200 days since, you have worked through this remarkable dataset at an extraordinary pace, helping us trace how galaxy structures change over cosmic time. Thanks to your classifications, we’re gaining a clearer picture of what galaxies looked like in the early Universe and how their shapes evolved into the systems we see around us today.
Galaxy Zoo has always been powered by the curiosity and dedication of its volunteers. Thank you for donating your time, your attention, and your enthusiasm.
Highlights from Talk
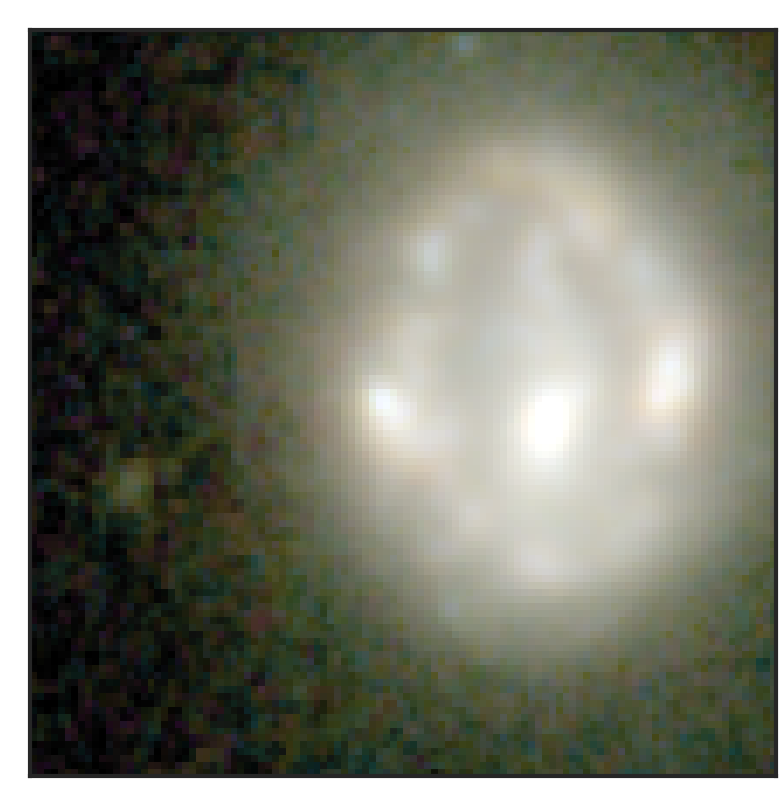
As we celebrate this milestone together, it’s worth taking a moment to look at some of the excitement happening on Talk. These are the top five most-discussed galaxies from this survey, with the images below counting down from #5. Each image links to its Notes page, so check it out and join in.


You can find many more stunning galaxies on Talk. For example, the JWST Gems tag highlights some of the most striking objects volunteers have come across. As always, thank you for making Talk such a joy to explore — it’s a pleasure to see what you all discover. And thank you for helping us (almost) reach one million classifications on GZ JWST! We can’t wait to see what you’ll uncover in the next million. 🎉
Public data release for Galaxy Zoo: Cosmic Dawn!
The below post is by James Pearson (Open University; lead for Galaxy Zoo: Cosmic Dawn data analysis).
We are happy to announce that the classifications for Galaxy Zoo: Cosmic Dawn are now publicly available!
This iteration featured over 41,000 galaxies, using ultra-deep imaging from the Hawaii Twenty Square Degree (H20) survey (a part of the wider Cosmic Dawn survey) to study the Euclid Deep Field North (EDFN), one of the darkest areas of the sky.
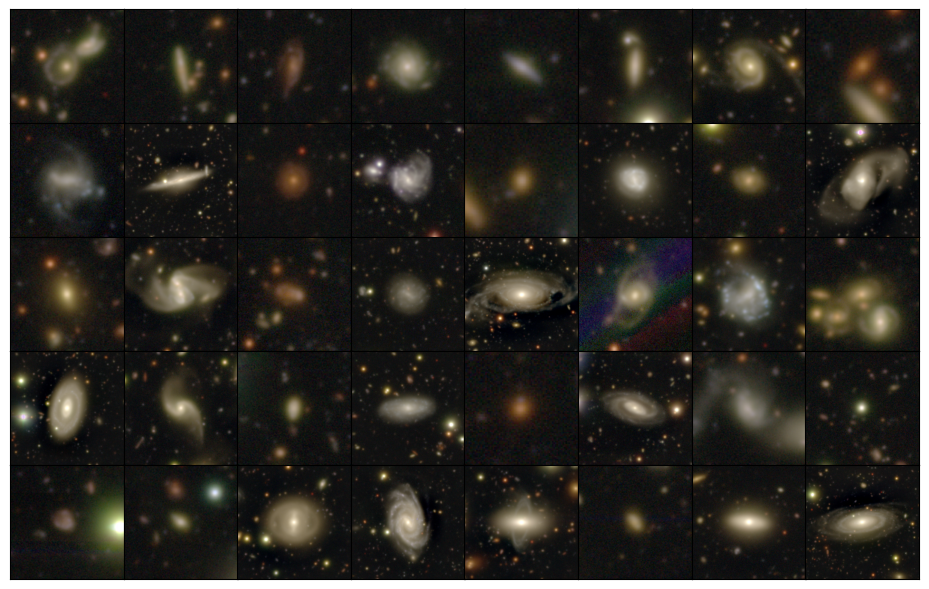
More than 10,000 of you contributed almost four million classifications, helping us to find – amongst other things – galaxies with faint (low surface brightness) features and clumps of star formation, as well as more rare objects hidden in this ultra-deep imaging. Your classifications can also help improve the accuracy of machine learning models for faster processing of ever-increasing subject sets, and provide a means of selecting the most interesting objects for further examination with other telescopes. With your help we have already discovered 51 new gravitational lenses – rare phenomena where the light of a distant galaxy is warped into arcs and rings around an intervening galaxy on its path to us, which allow us to study both galaxies in greater detail (in addition to looking pretty!).

This public data release is accompanied by a paper describing the project and some initial analyses of the classifications made by volunteers and by Galaxy Zoo’s machine learning model, Zoobot. You can read the paper (which is under review) on the arXiv at https://arxiv.org/abs/2509.22311.

Thanks again to everyone who contributed their time to making classifications for this project – we really appreciate your participation.
James Pearson, on behalf of the Galaxy Zoo Team
Looking for bars in faraway galaxies
Hi all! My name is Tobias Géron, I’m a postdoctoral researcher at the University of Toronto. I’ve been using Galaxy Zoo for a few years now to study bars in galaxies.
Bars seem to be very common structures in the present-day Universe, with roughly half of all disc galaxies having a bar. Bars are also thought to influence their host galaxies in all kinds of fun ways (e.g. see some previous blogposts here and here). The quintessential barred galaxy is NGC1300, which flaunts a beautiful long bar in its centre that connect to its spiral arms.
As some of you may know, we recently classified images from the CEERS survey in an iteration of Galaxy Zoo called GZ CEERS. These images were taken by JWST, an amazing telescope in space that excels at taking pictures of galaxies that are really far away. Due to the finite nature of the speed of light, looking at faraway galaxies means that we are also looking back in time. Astronomers quantify this with a property called “redshift”. A redshift of 0 corresponds to the present-day Universe, while higher redshifts means looking back further in time. This allows us to study how common bars are over time.
Using data from GZ CEERS, we tried to study bars up to a redshift of 4. This sounds a bit abstract, but it corresponds to looking back roughly 12 billion years in time! The Universe is only ~13.7 billion years old, so we are able to study bars over most of the history of the Universe. How cool is that? Without further ado, here are some cool pictures.

The top row shows galaxies where we found really long and obvious bars. The middle row shows shorter and less obvious bars, while the bottom row shows some unbarred galaxies. My personal favourite is the one in the top-right corner, EGS23205. This galaxy has an absolutely beautiful bar. What’s even crazier is that this galaxy is found at a redshift of ~2, which corresponds to a lookback time of ~10 billion years.
Great – so we now have found bars at high redshifts. However, in order to do some science, we want to know what fraction of galaxies host such bars at any given redshift. This is shown in the image below.
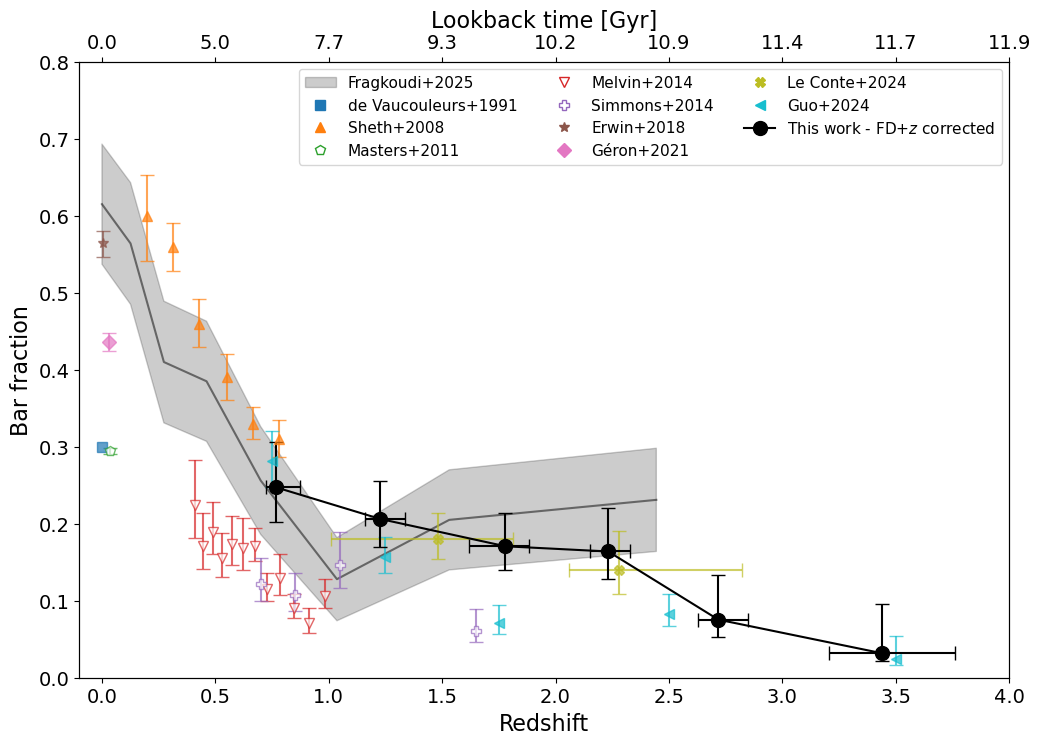
The full black line shows the redshift evolution of the bar fraction found using GZ CEERS. Our bar fractions agree with those obtained from simulations, which are shown with the grey contours (Fragkoudi et al. 2025), as well as some other studies looking at the bar fractions at high redshifts (Le Conte et al. 2024 and Guo et al. 2024). I’ve also added the results of some lower redshift (z < 1) studies to complete the whole picture.
The main conclusion from this plot is that this line is decreasing; i.e. there are fewer bars at higher redshifts. This is consistent with the picture that most galaxies start without a bar. At the highest redshift probed (z = 4), fewer that 5% of disc galaxies have a bar. Over time, more and more galaxies form bars, to such an extent that in the present-day Universe, roughly half of all disc galaxies have a bar!
This has a lot of implications for the evolution of galaxies, as well as the formation and lifetime of the bars themselves. All of this has just recently been published in Géron et al. (2025). We go into much more detail of how the barred galaxies were found, how observational corrections were applied, as well as the implications for galaxy evolution, bar formation and the lifetimes of bars.
In conclusion: bars are awesome. There seem to be a lot of them out there, even at very high redshift. They influence the evolution of galaxies in the local Universe, and are likely a significant contributor to the evolution of galaxies at high redshifts as well. Stay tuned for more exciting upcoming results from GZ CEERS!
Cheers,
Tobias

