
Galaxy Zoo CANDELS

We submitted the Galaxy Zoo CANDELS paper in May. Now, after some discussion with a very helpful referee, the paper is accepted! I hope our volunteers are as thrilled as I was to get the news. It happened within days of the Galaxy Zoo: Hubble paper acceptance. Hurray!

Spot the typo! (No, just kidding.) (Well, sort of. There is one, but it’s not easy to find and it’s pretty inconsequential.) This is not quite the longest paper I’ve ever written, but it is the longest author list I’ve ever been at the top of. It includes both Galaxy Zoo and CANDELS scientists. And the volunteers are acknowledged too, in that first footnote. A lot of people did a lot of work to bring this together.
If you’d like to read the paper, it’s publicly available as a pre-print now and will be published at some point soon in the Monthly Notices of the Royal Astronomical Society. The pre-print version is the accepted version, so it should only differ from the eventual published paper by a tiny bit (I’m sure the proof editor will catch some typos and so on).
The paper may be a little long for a casual read, so here’s an overview:
- We collected 2,149,206 classifications of 52,073 subjects, from 41,552 registered volunteers and 53,714 web browser sessions where the classifier didn’t log in. In the analysis we assumed each of those unique browser sessions was a separate volunteer.

Most subjects have 40 classifications apiece, although some were retired early from active classification and others were classified further, until about 80 volunteers per galaxy had told us what they thought.
- The raw consensus classifications are definitely useful, but we also weighted the classifications using a combination of “gold standard” data and consensus-based weighting. That is, classifiers were up- or down-weighted according to whether they could tell a galaxy apart from a star most of the time, and then the rest of the weighting proceeded in the same way it has for every other GZ dataset. No surprise: the majority of volunteers are excellent classifiers.
- 6% of the raw classifications were from 86 classifiers who both classified a lot and gave the same answer (usually “star or artifact”) at least 98% of the time, no matter what images they saw. We have some bots, but they’re quite easy to spot.
- Even with a pretty generous definition of what counts as “featured”, less than 15% of galaxies in the relatively young Universe that this data examines have clear signs of features. Most galaxies in the data set are relatively smooth and featureless.
- Galaxy Zoo compares well with visual classifications of the same galaxies done by members of the CANDELS team, despite the fact that the comparison is sometimes hard because the questions they asked weren’t the same as what we did. This is, of course, a classic problem when comparing data sets of any kind: to some extent it’s always apples-vs-oranges, and the devil is in the details.

We devote an entire section of the paper to comparing with the CANDELS-team classifications (from Kartaltepe et al. 2015, which we abbreviate to K15 in the paper). The bottom line: the classifications generally agree, and where they don’t we understand why. Sometimes it’s because there’s interesting science there, like mergers versus overlaps. The greyscale shading is a 2-D histogram; the difference in the blue versus red points is in which axis was used to separate the galaxy into bins so that the average trends could be computed.
- By combining Galaxy Zoo classifications with multi-wavelength light profile fitting — where we fit a 2D equation to the distribution of light in a galaxy, the properties of which correlate pretty well with whether a galaxy has a strong disk component — we’ve identified a population of likely disk-dominated galaxies that also completely lack the features that are common in disk galaxies in the nearby, more evolved Universe. These disks don’t have spiral arms, they don’t have bars, they don’t have clumps. They’re smooth, but they are disks, not ellipticals. They tend to be a bit more compact than disk galaxies that do have features, even though they’re at the same luminosities. They’re also hard to identify using color alone (which echoes what we’ve seen in past Galaxy Zoo studies of various different kinds of galaxies). You really need both kinds of morphological information to reliably find these.
- The data is available for download for those who would like to study it: data.galaxyzoo.org.
With the data releases of Galaxy Zoo: Hubble and Galaxy Zoo CANDELS added to the existing Galaxy Zoo releases, your combined classifications of over a million galaxies near and far are now public. We’ve already done some science together with these classifications, but there’s so much more to do. Thanks again for enabling us to learn about the Universe. This wouldn’t have been possible without you.
New images for Galaxy Zoo! Part 2 – Illustris
We’re extremely excited to announce the launch of two new image sets today on Galaxy Zoo. Working with some new scientific collaborators over the past few months, we’ve been able to access data from two new sources. This blogpost will go into more details on where the images come from, what you might expect to see, and what scientific questions your classifications will help us answer. (See Part 1 of this post to learn about the other new images from the DECaLS survey).
The second set of new data comes from the Illustris Project. Illustris is a state-of-the-art simulation of the Universe, led by a large team of researchers in the US, UK, and Germany. Large-scale cosmological simulations are a critical tool in astronomy; since we don’t have laboratories where we can replicate the conditions of processes like galaxy formation, we use computer simulations to investigate them instead. Such simulations start with what we believe conditions in the very early Universe were like (which we infer from the cosmic microwave background), and can include both dark matter and baryons (particles like protons and neutrons that eventually form the stars, dust and gas in galaxies). The simulation then tracks what happens to the matter and energy over billions of years as the Universe expands, evolving according to the laws of physics that are programmed into the simulation. This includes relations like the law of gravity, which dominates how dark matter moves, and hydrodynamics, which describe the motions of the gas. It’s truly amazing – scientists can watch galaxies form and evolve over huge scales of distance and time, and compare the results to real observations to test if the physics of the simulations are correct. Illustris is one of the largest and most detailed simulations ever run, taking more than 19 million CPU hours to run on powerful supercomputers.

A large-scale projection through the Illustris volume at redshift z=0, centered on a massive cluster. The left side of the image shows the density of dark matter, while the right side shows the density of the gas in cosmic baryons. Image and text courtesy of the Illustris project.
This comparison to real data is the key feature that sparked the collaboration between Illustris and Galaxy Zoo. Once the simulation is run, astronomers analyze the results to see if their galaxies match the properties of those seen in the real Universe. This includes measurements like the total number of stars formed, the ratio of stars to dark matter, and the distribution of galaxies of different masses and luminosities. Another critical parameter we want to compare is galaxy morphology; measuring the ratio of ellipticals to spirals, for example, is an important test of whether the galaxy merger rate is correct, and if the simulation codes for star formation and gravitational interaction are correct.
The Illustris scientists have created images of the galaxies from their simulation that GZ volunteers will classify by their morphology. Our comparison data set for this will be the SDSS results from Galaxy Zoo 2, and the images are designed to match the Sloan images as closely as possible. This includes the same set of filters for the telescope, sizing the images so that the galaxies look like they’re at cosmic distance from the Milky Way, and setting them against backgrounds of stars and other galaxies. The quality of the simulations and images are amazing – these look to me like real galaxies in every way. It’s something that astronomers definitely couldn’t do ten years ago.

Two galaxies from the Illustris simulation evolving in time from left to right, from when the universe was a quarter its current age, to the present. The top galaxy shows a massive, red, elliptical-shaped galaxy forming after a series of mergers with other systems. The bottom galaxy reveals the formation of a smaller, bluer, disk-shaped galaxy forming after a less violent history of interactions. Images and text courtesy of the Illustris project.
Although these images aren’t of “real” galaxies, we want to emphasize again how much your classifications will help scientists to do astronomical research. Simulations like Illustris are the only way that we can probe galaxy formation and evolution as it happens. Your classifications, both from Galaxy Zoo 2 and from the new Illustris data, provide vital tests for the output and will be fed back to the science teams in order to improve future versions of these sims.
If you have questions or want to discuss anything you see in the new images, please join the discussion with scientists and volunteers on Talk. The Illustris Project also has some amazing online tools if you want to learn more, including an interactive explorer of the simulation and videos of the evolving Universe. You also can explore specific galaxies you’ve classified via GZ:Examine. As always, thanks to everyone for your help!
New images for Galaxy Zoo! Part 1 – DECaLS
We’re extremely excited to announce the launch of two new image sets today on Galaxy Zoo. Working with some new scientific collaborators over the past few months, we’ve been able to access data from two new sources. This blogpost will go into more details on where the images come from, what you might expect to see, and what scientific questions your classifications will help us answer. Part 2 of this post will discuss the other set of new images from the Illustris simulation.
The Dark Energy Camera Legacy Survey (DECaLS) is a public optical imaging project that follows up on the enormous, groundbreaking work done by the various versions of the SDSS surveys over the past decade. The aim of DECaLS is to use larger telescopes to get deeper images with significantly better data quality than SDSS, although over a somewhat smaller area. The science goals include studies of how both baryons (stars, gas, dust) and dark matter are distributed in galaxies, and particularly in measuring how those ratios change as a galaxy evolves. By adding morphology from Galaxy Zoo, our joint science teams will explore topics including disk structure in lower mass galaxies, better constraints on the rate at which galaxies merge, and gather more data on how the morphology relates to galaxy color and environment.
DECaLS observations use the Blanco telescope, which is located at CTIO in northern Chile at an altitude of 2200m (7200 ft). The telescope has a 4-m aperture mirror, giving it more than three times the collecting area of the SDSS telescope. The camera used for the survey is named DECam, a large-area and extremely sensitive instrument developed for a separate program called the Dark Energy Survey. The camera has 570 megapixels and covers a 2.2 degree field of view – more than 20 times the apparent size of the full moon! The combination of the exquisite dark-sky observing site, a sensitive wide-field camera, and larger telescope all combine to generate the new images, which will eventually include more than 140 million unique sources on the sky when DECaLS is finished.
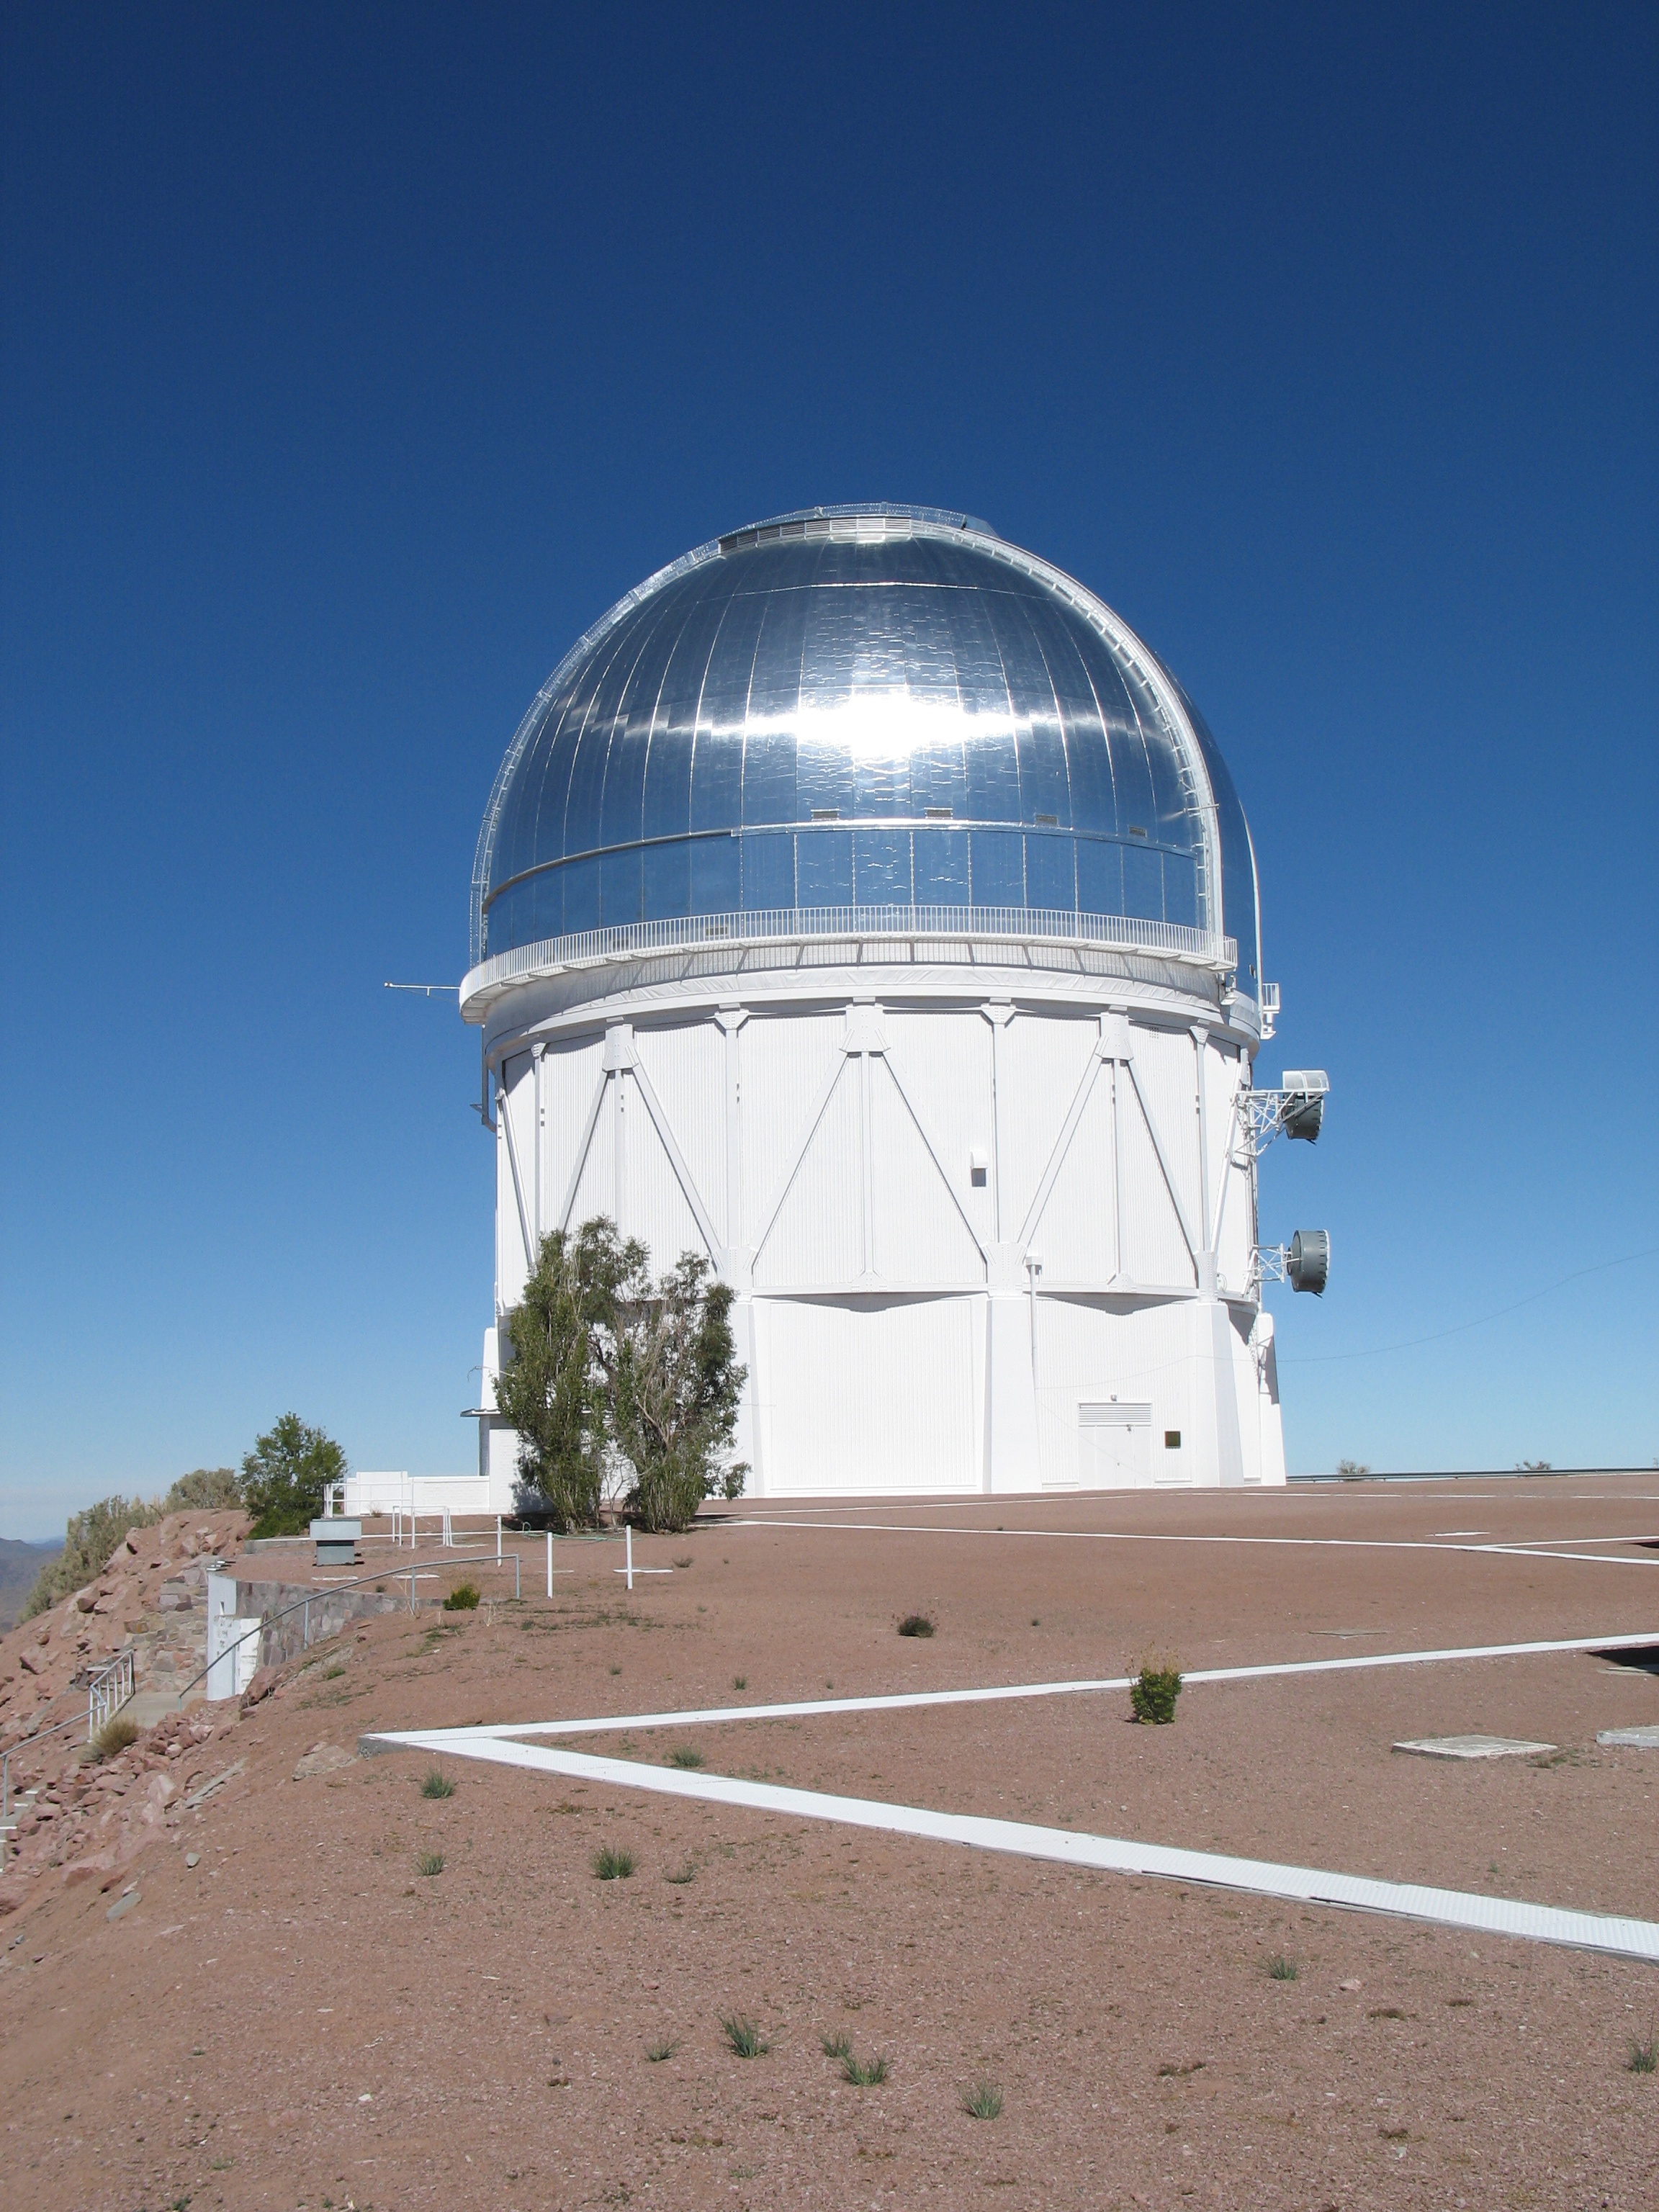
The Victor M. Blanco 4m telescope, located at CTIO in northern Chile, is carrying out the observations for the DECaLS survey. Image courtesy NOAO.
The DECaLS images in Galaxy Zoo are a smaller group taken from a catalog called the NASA-Sloan Atlas. We’re focusing on somewhat larger and brighter galaxies from the catalog. The reason is that although many of these galaxies have been classified in GZ already via their Sloan images, we’re particularly interested in measuring details like tidal tails from mergers, seeing fainter spiral structures, and separating galaxies that couldn’t be individually resolved in the Sloan data. Here’s a great example of a single galaxy in both SDSS and DECaLS – check out how much clearer the spiral arms are in the new images!

Left: an SDSS image of the galaxy J225336.34+000347.4. Right: a DECaLS image of the same galaxy.
Almost all of the morphology and classification tasks are the same as they were for the Sloan images, so it should be familiar to most of our users. If you have questions or want to discuss anything you see in the new images, please join the discussion with scientists and volunteers on Talk. As always, thanks for your help!
New Dataset from Galaxy Zoo!
We’ve posted a new data set here: http://data.galaxyzoo.org/#agn
This sample is presented in the Galaxy Zoo 1 paper on AGN host galaxies (Schawinski et al., 2010, ApJ, 711, 284). It is a volume-limited sample of galaxies (0.02 < z < 0.05, M_z < -19.5 AB) with emission line classifications, stellar masses, velocity dispersions and GZ1 morphological classifications. When using this sample, please cite Schawinski et al. 2010 and Lintott et al. 2008, 2011.
Download here: http://galaxy-zoo-1.s3.amazonaws.com/schawinski_GZ_2010_catalogue.fits.gz
Column definitions are as follows:
- OBJID – SDSS object ID
- RA, DEC – RA and Dec in J2000
- REDSHIFT – SDSS spectroscopic redshift
- GZ1_MORPHOLOGY – Galaxy Zoo 1 morphology according to the Land et al. (2008) “clean” criterion. GZ_morphology is an integer where 1-early type, 4-late type, 0-indeterminate, 3-merger
- BPT_CLASS – 0-no emission lines, 1-SF, 2-Composite, 3-Seyfert and 4-LINER (see Schawinski et al. 2010 for details)
- U,G,R,I,Z -SDSS modelMag extinction corrected but not k-corrected
- SIGMA, SIGMA_ERR – Stellar velocity dispersion measured using GANDALF
- LOG_MSTELLAR – log of stellar mass
- L_O3 – Extinction-corrected [OIII] luminosity
Galaxy Zoo classifications in SDSS Database
The latest release of data from the Sloan Digital Sky Survey happened yesterday (SDSS3 blog article about the release). This has been widely talked about as providing the largest ever digital image of the sky, but one thing which might have passed your notice is that as part of this data release your Galaxy Zoo classifications (from the first phase of Galaxy Zoo) have been integrated into the SDSS public database (CasJobs). This will make GZ1 classifications all that more accessible for professional (and amateur?) astronomers to use in their research, and we hope to see some exciting and novel new uses coming out.
I’ll finish by including this visualization of the SDSS3 imaging data made by Mike Blanton and David Hogg (OK so I can’t work out how to embedd a YouTube video here, so here’s the link!).
Preparing the pixels
At Zoo headquarters we like to be efficient. That means avoiding redoing work that has already been done by someone else. Particularly if those others have already spent a long time thinking how to do it best. Getting the images for the original Galaxy Zoo (way back in 2007!) was particularly easy. The fabulous Sloan Digital Sky Survey (SDSS) had already done all the work of taking the images, calibrating them, stitching them together, combining images at different wavelengths to make colour images, and optimising their appearance. All we had to do was ask their servers for an image, giving it the required location and size, and voilà, a image ready for adding straight into the Galaxy Zoo collection!
Life was rather more difficult when we added the special ‘Stripe 82’ images from the SDSS. For these, Galaxy Zoo team member Edd needed to do the stitching, combining, optimising, cutting-out and resizing. The details of how he did that are all here. We wanted to be able to compare the Stripe 82 images to the normal SDSS images, so we tried to keep things like the brightness scaling and appearance of colours as similar to the original as possible. Even so, it took us a couple of attempts to come up with a solution we were satisfied with.
With the Hubble data, as with Stripe 82, creating the images for the Zoo isn’t completely straightforward, but again most of the hard work had already been done for us. For the launch of Galaxy Zoo: Hubble, data was taken from several surveys:
- GOODS: The Great Observatories Origins Deep Survey
- GEMS: Galaxy Evolution from Morphology and SEDs
- AEGIS: All-wavelength Extended Groth strip International Survey
We’ve also recently added in COSMOS: Cosmic Evolution Survey images – more about the nitty gritty details of those images in a future post.
The data calibration business was already taken care of by the science teams for each survey. The next steps, finding the galaxies, cutting out images at each available wavelength and combining them into colour images, was handled by Roger Griffith, who already had a system set up to do exactly that. Roger used a nifty piece of software called GALAPAGOS to manage the business of finding, cutting out and measuring the galaxies. The difference that Galaxy Zoo added to Roger’s system was that, like with Stripe 82, we wanted the properties of the colour images to match those from SDSS as closely as feasible, to enable us to compare the results from each of the Galaxy Zoo datasets as fairly as possible.
One particular issue with making colour HST images is that many surveys only produce data at two different wavelengths. Normally, colour images are made by choosing a different wavelength image for each of the three primary colours: red, green and blue. For the HST images we instead use one image for red, another for blue, and then just take the average of the two for green. The primary colours used in your computer display don’t usually match the colour filters that were used in the telescope at all, so the colours you see are only an indication of the true colour. Nevertheless the colours contain a lot of information: galaxies containing only old stars will look red, while those which are actively forming new stars will often be blue. Getting the images looking right, with fairly similar appearance to the SDSS images, required a cycle of testing and exchanging images back and forth, but we came to an agreement fairly quickly.
The HST images in Galaxy Zoo might not look as impressive as some of the press images you’ve seen from Hubble over the past twenty years. That’s because press images are usually picked specifically for their attractive appearance. The images chosen are often of nearby nebulae and galaxies for which HST allows us to see huge amounts of detail. The objects in Galaxy Zoo: Hubble are much more typical of the huge number of galaxies in HST surveys. Although HST can see much more detail than ground-based surveys, its mirror and field-of-view are smaller than most ground-based telescopes, so it can only cover a much smaller area of the sky in a reasonable amount of time. Surveys with the HST therefore focus on faint, distant galaxies, so we end up with images having similar quality to those from SDSS, which is remarkable given how much further away the HST galaxies are compared with those from SDSS.
The similarity between the images of galaxies in the early universe from HST and those relatively nearby from SDSS is actually a big advantage. It means that we can fairly compare the morphologies of galaxies at these two eras in the Universe’s history. That’s what professional astronomers will be doing with your Galaxy Zoo: Hubble classifications over the coming year.
Hubble, meet Galaxy Zoo. Galaxy Zoo, meet Hubble.
Regular blog readers will know that we were all hugely pleased to find out that our proposal to observe Hanny’s Voorwerp with Hubble was approved. This was especially welcome because we expected a very high oversubscription rate for next year – new and repaired instruments meant that there was pent-up demand for some kinds of observations which have not been possible for several years. Nearly 1000 proposals were submitted to the Space Telescope Science Institute (STScI). which managed a complex review process involving about 200 astronomers from all over the world (noting that Hubble is a cooperative project of NASA and the European Space Agency). Specialized panels of reviewers looked at various subfields of astronomy, comparing the likely scientific fruitfulness of a wide range of projects.This last week saw the deadline for the next step in preparing for next year’s Hubble observations – what’s known as Phase II. This uses software distributed by STScI to plan each operation in detail – every exposure, filter change, and minute telescope motion. The astronomer can find out whether reordering certain operations uses precious telescope time more efficiently, and whether the results can be improved by restricting the observations to certain orientations of the telescope or times of year. The software will also overlay requested fields of view on sky surveys such as Sloan images), a welcome reality check that you’ve told it to look in the right place. This stage also gives us a chance to see whether anything we’ve learned since the proposal was submitted in early March gave us reason to change any of our originally proposed measurements.
