
Looking for bars in faraway galaxies
Hi all! My name is Tobias Géron, I’m a postdoctoral researcher at the University of Toronto. I’ve been using Galaxy Zoo for a few years now to study bars in galaxies.
Bars seem to be very common structures in the present-day Universe, with roughly half of all disc galaxies having a bar. Bars are also thought to influence their host galaxies in all kinds of fun ways (e.g. see some previous blogposts here and here). The quintessential barred galaxy is NGC1300, which flaunts a beautiful long bar in its centre that connect to its spiral arms.
As some of you may know, we recently classified images from the CEERS survey in an iteration of Galaxy Zoo called GZ CEERS. These images were taken by JWST, an amazing telescope in space that excels at taking pictures of galaxies that are really far away. Due to the finite nature of the speed of light, looking at faraway galaxies means that we are also looking back in time. Astronomers quantify this with a property called “redshift”. A redshift of 0 corresponds to the present-day Universe, while higher redshifts means looking back further in time. This allows us to study how common bars are over time.
Using data from GZ CEERS, we tried to study bars up to a redshift of 4. This sounds a bit abstract, but it corresponds to looking back roughly 12 billion years in time! The Universe is only ~13.7 billion years old, so we are able to study bars over most of the history of the Universe. How cool is that? Without further ado, here are some cool pictures.

The top row shows galaxies where we found really long and obvious bars. The middle row shows shorter and less obvious bars, while the bottom row shows some unbarred galaxies. My personal favourite is the one in the top-right corner, EGS23205. This galaxy has an absolutely beautiful bar. What’s even crazier is that this galaxy is found at a redshift of ~2, which corresponds to a lookback time of ~10 billion years.
Great – so we now have found bars at high redshifts. However, in order to do some science, we want to know what fraction of galaxies host such bars at any given redshift. This is shown in the image below.
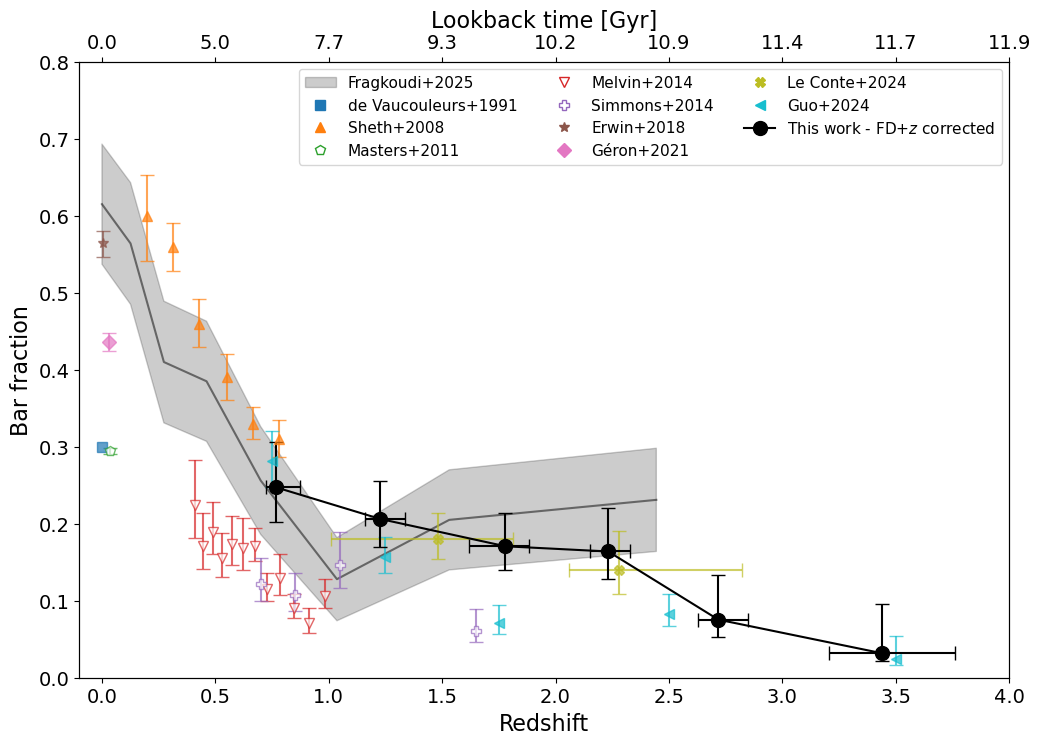
The full black line shows the redshift evolution of the bar fraction found using GZ CEERS. Our bar fractions agree with those obtained from simulations, which are shown with the grey contours (Fragkoudi et al. 2025), as well as some other studies looking at the bar fractions at high redshifts (Le Conte et al. 2024 and Guo et al. 2024). I’ve also added the results of some lower redshift (z < 1) studies to complete the whole picture.
The main conclusion from this plot is that this line is decreasing; i.e. there are fewer bars at higher redshifts. This is consistent with the picture that most galaxies start without a bar. At the highest redshift probed (z = 4), fewer that 5% of disc galaxies have a bar. Over time, more and more galaxies form bars, to such an extent that in the present-day Universe, roughly half of all disc galaxies have a bar!
This has a lot of implications for the evolution of galaxies, as well as the formation and lifetime of the bars themselves. All of this has just recently been published in Géron et al. (2025). We go into much more detail of how the barred galaxies were found, how observational corrections were applied, as well as the implications for galaxy evolution, bar formation and the lifetimes of bars.
In conclusion: bars are awesome. There seem to be a lot of them out there, even at very high redshift. They influence the evolution of galaxies in the local Universe, and are likely a significant contributor to the evolution of galaxies at high redshifts as well. Stay tuned for more exciting upcoming results from GZ CEERS!
Cheers,
Tobias
Slow strong bars affect their hosts the most
Hi everyone, my name is Tobias. I finished my PhD at the University of Oxford almost a year ago now, and I am currently a postdoc at the University of Toronto. I work a lot with Galaxy Zoo classifications, specifically to study bars in galaxies. We’ve just submitted a new paper (which can be found here), but I thought it would be fun to go over some of the main results in this blogpost. I heavily relied on classifications from Galaxy Zoo in order to identify the bars, so this work would not have been possible without your help!
Introduction
There are different ways to classify a bar in a galaxy. One you are all doubtlessly very familiar with, is a classification based on morphology: bars can be classified as either weak or strong. This is what Galaxy Zoo has been asking volunteers to do since GZ DECaLS.
However, another useful approach to classify bars is based on how they move (i.e. the kinematics). Bars will rotate around the centre of their host galaxy with a specific speed, often called the bar pattern speed (
In a previous paper, we tried to measure the kinematics of bars in a bunch of galaxies (this paper can be found here). Bar strength has been reasonably well studied over the last few years, but the kinematics of bars hasn’t been studied observationally to the same degree. Even more, the interplay between bar strength and kinematics (i.e. does a strong slow bar behave the same way as a strong fast bar?) has not really been looked at yet in much detail. This is exactly the topic of our new paper. I have been working on this problem for a while now, and I have recently finished! I’ll go over some of the main findings below, but if you want to learn more, please feel free to check out the actual paper itself: https://arxiv.org/abs/2405.05960
Intermezzo: different regions of a barred galaxy
Before we continue, I want to spend a little time to clarify different regions of a bar. The names are relatively intuitive. The picture below shows a famous barred galaxy called NGC 1300. All credits of the original picture go to NASA, ESA and the Hubble Heritage Team. Overlaid on this image are the different regions of the bar that I will talk about. The bar itself is bounded by the dashed box. The centre of the bar typically coincides with the centre of the galaxy. The bar then has two arms that stretch out either side. The bar-end region is where, as the name implies, the bar ends. The bar-end region where the bar sometimes transitions into spiral arms (as is the case here) or a large ring structure, but this is not always necessarily the case.

How do we study bar kinematics?
We want to study how bar strength and bar kinematics affect their host. Specifically, we will look at how bar strength and kinematics affect the distribution of star formation. I won’t go into too much detail on this now, but the amount of star formation is related to a quantity called the equivalent width of H
In order to measure how the star formation changes in different locations within the bar, we will create so-called radial plots, which is explained using the Figure below. Panel (1) shows the image of a galaxy. Panel (2) shows the amount of EW[H

Effect of bar strength
We can then compare different radial profiles of different groups of galaxies. For example, below, we compare the radial profiles of unbarred (grey), weakly (blue) and strongly barred galaxies (orange). There is a lot going on in these plots, but I’ll walk you through the most important parts. Firstly, the full line is the median radial profile of a group of galaxies (e.g. all strongly barred galaxies), constructed as discussed above. The contours around it show the 33th and 66th percentiles, which can be interpreted as the uncertainty around the median of the radial profile. The bottom part of the figure shows the difference between two radial profiles. Additionally, the size of the dot shows how significant the difference is. A large dot implies that the difference is very significant, while a small dot implies that it is not significantly different.

There are multiple things that we notice. Firstly, the shape of the strongly barred radial profile, when you only look at R < 1.5, is shaped like a “V”: there is a peak in the centre of the galaxy, a minimum in the arms of the bar (at R = 0.5), and a second peak just beyond the bar-end region. This distinct shape is only seen for strongly barred galaxies. The shape of weakly barred and unbarred galaxies are similar to each other: it simply increases slowly with radius. These observations are consistent with the picture that strongly barred galaxies collect gas from the galaxy, and funnel them through the arms of the bar to the centre of the galaxy. This gas is then used in the centre (and to a smaller extent, just beyond the bar-end) to form stars. We can only conclude this for strong bars, not for weak bars.
Effect of bar kinematics
Now that we’re familiar with radial profiles and how to use them, we’ll move to the main point of the paper: what happens when we look into bar kinematics as well? This is done in the Figure below, where we look at the radial profiles of EW[H


So, we see some effect of bar kinematics on the radial profile of strongly barred galaxies, but it is not significantly different, presumably due to low sample sizes. Perhaps we can tease out any potential differences in another way. Remember that the radial profiles were constructed by looking at the area around the barred region, by choosing the pixels that were contained within a box placed parallel on the bar (the red box in the example below). We can compare that to a box placed perpendicular to the bar (the blue box in the example below). By comparing these “on bar” and “off bar” radial profiles with each other we can directly assess the effect the bar has on its host, and perhaps learn more about the importance of bar kinematics.

This is exactly what we did in the Figure below. Here, we show radial profiles for on-bar regions (the red lines) and off bar regions (blue lines). We have done this for four subsets of barred galaxies: slow strong bars (top-right panel), fast strong bars (top-left panel), slow weak bars (bottom-left panel) and fast weak bars (bottom-right panel). There are a lot of different things to look at in this plot, but the main take-away is that the largest differences observed in EW[H


Why would kinematics even matter?
We have shown that slow bars effectively increase the star formation along the bar. But why? To help see why this might be the case, it is helpful to go back to the definitions. As I mentioned above, a slow bar typically moves much slower than the stars in the disc at the bar-end. This means that the difference in velocity between the bar and the stars and gas in the disc is relatively large, as visualised in the left panel of the figure below. The stars and gas in the disc will continuously overtake the bar. This also implies that the bar will come into contact with much more of the gas in the disc. We hypothesise that, because of this difference in velocity, the bar is much more efficient at collecting, funnelling and concentrating gas from the disc into the bar region. This would, in turn, concentrate the resultant star formation along the bar as well and increase the overall values of EW[H

In contrast, fast bars move with similar velocities to the stars and gas in the disc. They are always “in sync” with the disc at the bar-end region. This implies that fast bars do not come into contact with as much gas as their slower counterparts, and therefore will have lower amounts of gas and star formation along their barred regions.
Conclusion
We have talked about a lot of different things in this post. The two main points are summarised below:
1) Bar strength has a clear effect on the star formation distribution. Strong bars have higher amounts of star formation in their centre and beyond the bar-end regions, while they have lower amounts of star formation in the arms of the bar. Meanwhile, a weak bar does not seem to influence the star formation distribution of their host at all.
2) Bar kinematics matter as well. Slow bars increase the amount of star formation along the bar, likely because they come into contact with more of the gas of the galaxy and are more efficient at funnelling and concentrating gas. However, we only see this happen if the bar is also strong.
If you’re interested in learning more about this, please feel free to check out this newly released paper, found here. Of course, none of this work would have been possible without the efforts of citizen scientists, such as yourself. The bar strength classifications used in this work are directly based on your classifications, and we are all very thankful for that!
Cheers,
Tobias Géron
Our last night at the telescope
The story so far: on the first night we were able to observe until 02:00 before the weather forced us to close. The following three nights we were confined to the Residencia, the place where they keep all the astronomers when they are not observing. Much to our surprise, this morning we awoke to a sky only sparsely covered by clouds, instead of being in the middle of one. Maybe we have a chance of observing something tonight?
== 19:30 ==
As the weather has cleared somewhat on Roque de Los Muchachos, La Palma, we have received permission to go to the telescope tonight. We’ve just arrived and started taking the first couple of calibration images with much enthusiasm.
A bit about the telescope itself: we’re using a telescope called the Isaac Newton Telescope (INT). It is a Cassegrain reflector telescope with a ~2.5m primary mirror that weighs ~4000kg!

It takes a while for the telescope to take all the calibration images (biases, arcs and flats), so we were able to enjoy the sunset right before -hopefully- a very busy night.
== 22:00 ==
Unfortunately the weather has taken a turn for the worse. We cannot open the dome of the telescope as the humidity is too high. We’ve had our first cups of coffee and are settling in for the night, while keeping an eye on the humidity sensor.
As tonight will be our last night at the telescope and we’ve had bad luck with the weather the last couple of days, we are very hopeful to observe some galaxies tonight. So far we were able to observe only one galaxy before we had to close on the first night. At this point we will be grateful for any data that comes in, even one more galaxy would double our current sample size!
== 00:45 ==
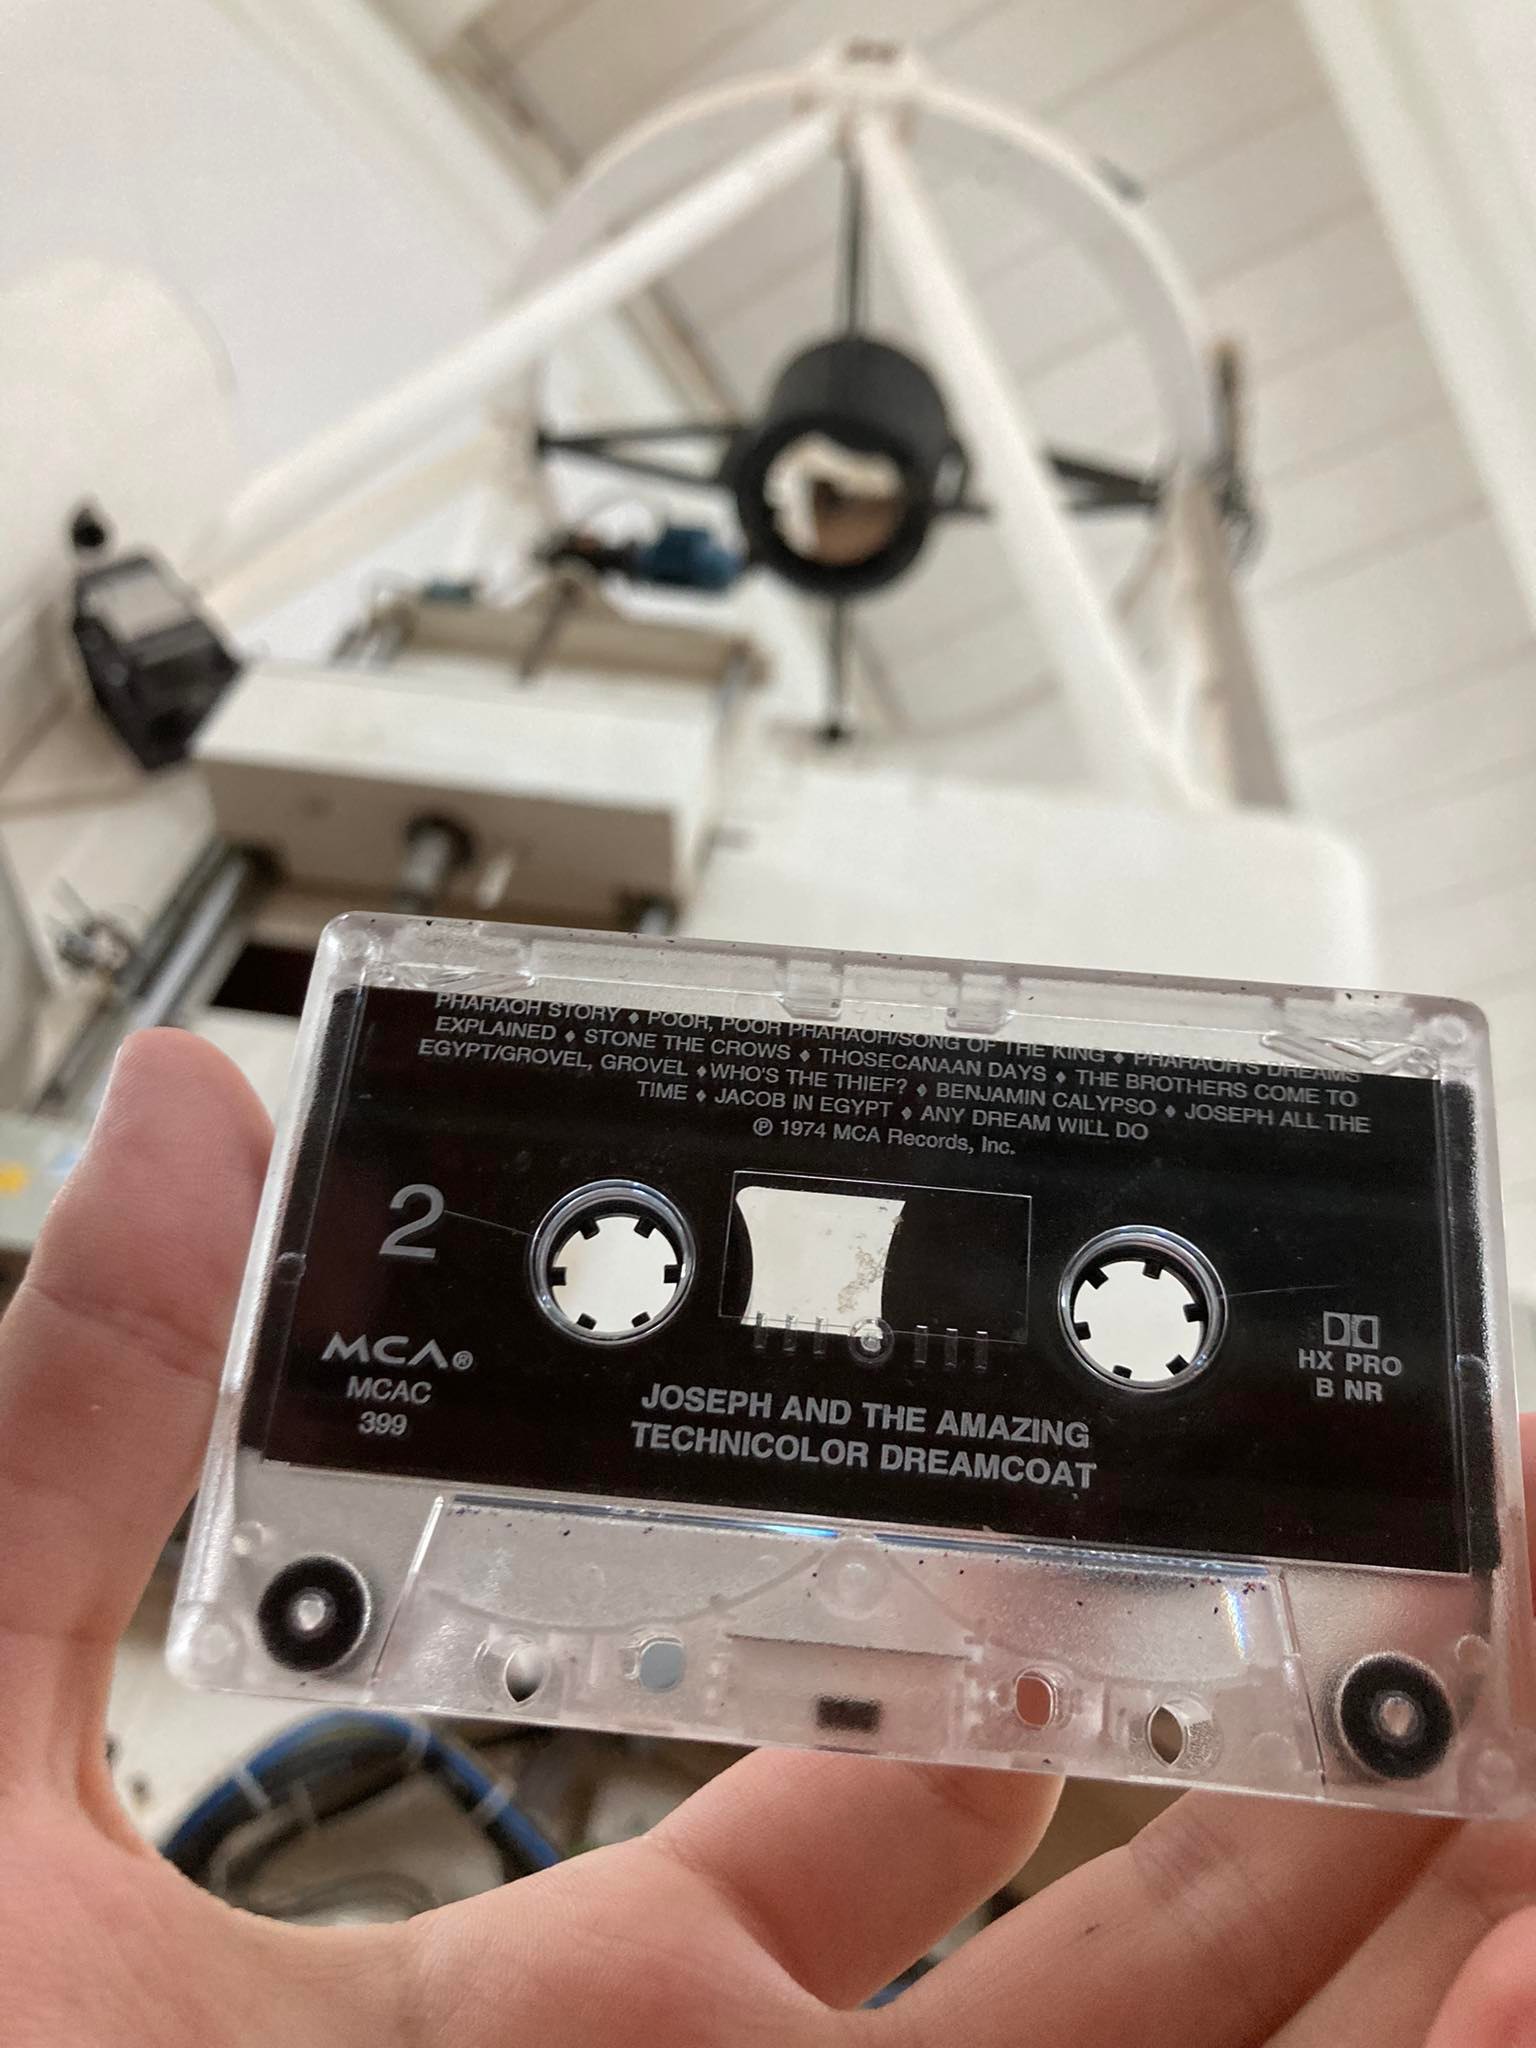
We’re still not able to open, humidity is at 100% and we cannot see any stars. The highlight of the last couple of hours was exploring the library in the INT and listening to an old cassette tape of Joseph and the technicolour dream coat. None of the other tapes work.
== 04:00 ==
We’ve had a popcorn and pizza break, drank multiple cups of coffee and explored most of the telescope building. However, unfortunately we’ve not been able to use the telescope today – the weather gods seem determined to prevent us from getting any data. With any luck we’ll be back next year to try again.

Observing bars in La Palma
As some might remember, in our last paper (which can be found here), we studied differences between weak and strong bars. One of our results was that star forming galaxies with stronger bars have significantly higher star formation in their centres compared to galaxies with weaker bars. This might be due to differences in the gas flows induced by the different types of bars. To investigate this, we selected a sample of 21 galaxies from Galaxy Zoo, which we plan to observe over the next couple days.
The relationship between galactic bars and star formation has long been up for debate. Galactic bars are vast structures of co-orbiting gas, dust and stars that form directly across the galactic nucleus. It is thought that gas flows along the arms of the bar into the centre, increasing the central gas density. As gas density increases, the star formation rate would also. So, that should be the answer then? However, in reality, it is not so simple.
There are many different kinds of bars, with varying characteristics such as strengths and orientations. A galaxy might contain a very strong bar – where it clearly dominates even over the galactic disk – or it could have a very weak bar – where the disk dominates over it. So, we need to ask ourselves further, is the gas flow and resultant star formation higher in galaxies with strong bars? What about weak bars? Does it even change at all if we compare either type of bar to galaxies which have no bars?
These are the questions we are going to answer at the Isaac Newton Telescope, or INT, on the island of Santa Cruz de la Palma. With a sample of 21 galaxies characterised by Galaxy Zoo – 7 strongly barred, 7 weakly barred and 7 with no bars at all – we are investigating if any relation between star formation rate and bar strength exists. An example of each type of galaxy in our sample is shown below. On the left is a galaxy with no bar at all, while on the right is a galaxy with a strong bar. The strong bar clearly dominates over the disk of the galaxy. The middle panel shows a galaxy with a much weaker bar, where the disk dominates over the disk galaxy.
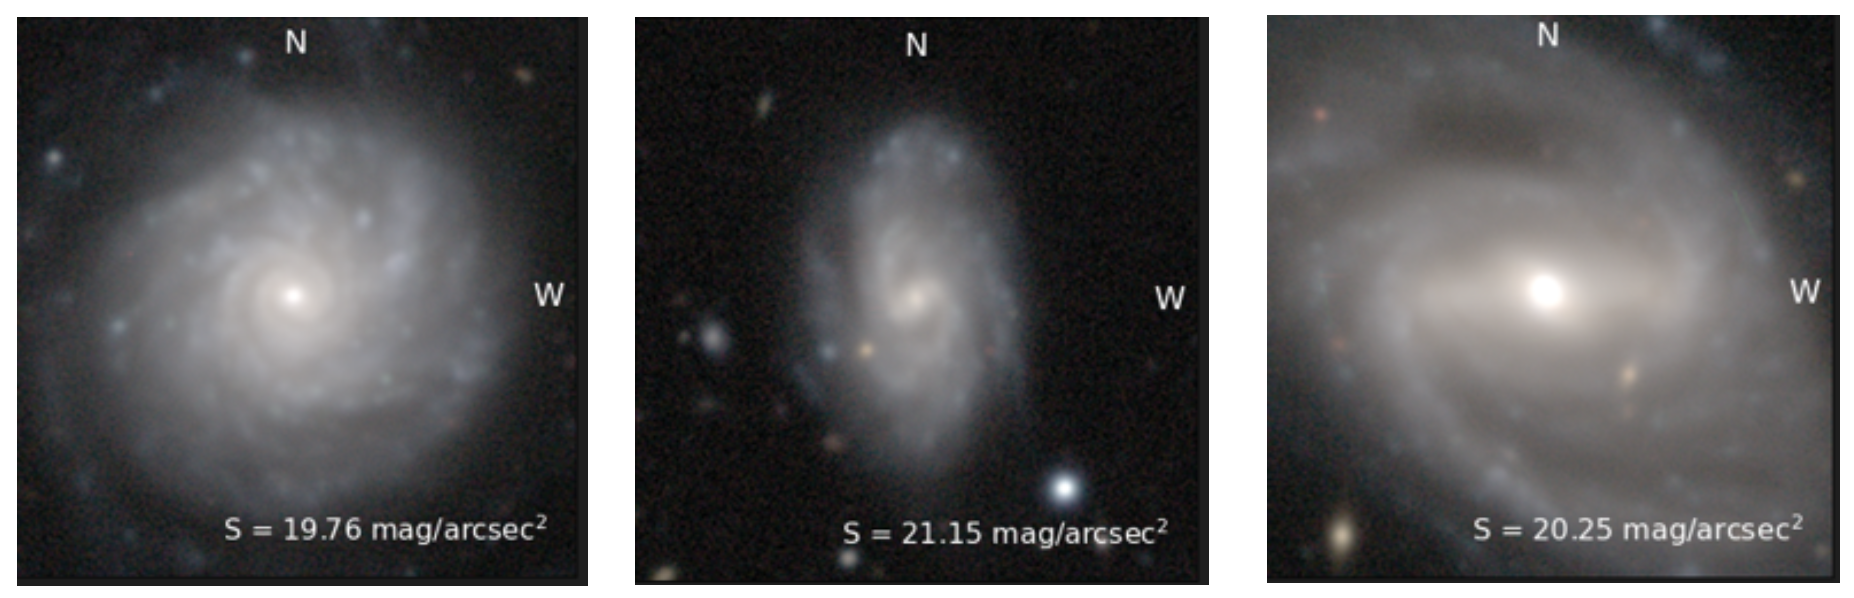
To investigate this, we must turn to spectroscopy. Rather than utilise images, such as the ones above, we align a spectroscopic slit along and perpendicular to the bar direction on the image. The spectroscope will split the incoming light into a spectrum of wavelengths, where we will be able to find any spectral signatures of elements within the bars themselves.
There are two chemical signatures of star formation that we are looking for. The first, an indirect measurement, is looking for Hydrogen Alpha, or Hα. If there is a much higher abundance of Hα at the core of a galaxy with a strong bar, weak bar or not, it is very likely that there is a higher gas density. Ergo, there is a higher star formation. The second signature we are looking for is Oxygen III, or O[III]. O[III] is highly ionised only typically exists in areas where there are high rates of the star formation; the newly born stars being the cause of the ionisation. This would be direct evidence of higher star formation.
So, what do we find? Thus far, due to the adverse weather conditions caused by tropical storm Hermine on La Palma, we have set our spectroscopic observations on a single strongly barred galaxy. We have extracted the spectrum, removed any sources of contamination and reduced to only that of the bar and galactic nucleus. The top image is the spectrum from the slit at ninety degrees perpendicular to the bar direction and the bottom is aligned along it.


The top spectrum (perpendicular to the bar) appears to be almost empty, with only noise present. Along the bar, however, we get a very strong emission line at precisely 6562.801Å. Guess which wavelength Hα happens to rest at? Precisely the same!
This is certainly a promising initial result. If the abundance of Hα is much higher along bars than not, then this is certainly a case for them enhancing star formation! The next steps are to confirm this finding by taking observations for the rest of our sample. Once the weather clears up on La Palma, we will be aiming to finally answer the question, what do galactic bars do for star formation? Enhance, prevent or nothing? Well, it looks like enhancing has won the first point!
We will keep you updated!
Cheers,
David, Tobias and Chris
Stronger bars help shut down star formation
Hi everyone!
I’m Tobias Géron, a PhD student at Oxford. I have been using the classifications of the Galaxy Zoo DECaLS (GZD) project to study differences between weak and strong bars in the context of galaxy evolution. We have made significant amount of progress and I was able to present some results a couple of weeks ago at a (virtual) conference in the form of a poster, which I would love to share with you here as well.

To summarise: I have been using the classifications from GZD to identify many weakly and strongly barred galaxies. Some example galaxies can be found in the first figure on the poster. As the name already implies, strong bars tend to be longer and more obvious than weak bars. But what exactly does this mean for the galaxy in which they appear?
One of the major properties of a galaxies is whether it is still forming stars. Interestingly, in Figure 2 we observe that strong bars appear much more frequently in galaxies that are not forming stars (called “quiescent galaxies”). This is not observed for the weak bars. This suggests one of two things: either the strong bar helps to shut down star formation in galaxies or it is easier to form a strong bar in a quiescent galaxy.
In an attempt to answer this chicken or egg problem, we turn to Figure 3. Here, we show that the rate of star formation in the centre of the galaxy is highest for the strongly barred galaxies that are still star forming. This suggests that those galaxies will empty their gas reservoir quicker, which is needed to make stars, and are on a fast-track to quiescence.
I’m also incredibly happy to say that we’ve written a paper on this as well, which has recently been accepted for publication! You can currently find it here. Apart from the results described above, we also delve more deeply into whether weak and strong bars are fundamentally different physical phenomena. Feel free to check it out if you’re interested!

It’s amazing too see all this coming to fruition, but it couldn’t have been possible without the amazing efforts of our citizen scientists, so I want to thank every single volunteer for all their time and dedication. We have mentioned this in the paper too, but your efforts are individually acknowledged here. Thank you!
Cheers,
Tobias
Strong and weak bars in Galaxy Zoo
Good morning everyone,
My name is Tobias and I’m a new PhD student here at Oxford. I use the classifications everyone made in Galaxy Zoo to attempt to understand how galaxies evolve. Right now, I’m especially interested how bars affect galaxy evolution.
As some of you know, Galaxy Zoo currently asks to differentiate between so-called ‘strong’ or ‘weak’ bars. Below you can find some neat examples of both classes of galaxies that were identified using your classifications. It seems that the difference between strong and weak bars is some sort of combination between the length, width and brightness of the bar.

The relationship between bars and galaxy evolution has been studied before by members of the Galaxy Zoo team, but the previous incarnation of Galaxy Zoo only allowed binary answers to the bar question: either there was a bar or not. The interesting bit, however, is to see whether strong and weak bars have different effects.
In fact, we have exciting preliminary data that suggests both types do behave differently in the context of galaxy evolution! When a galaxy evolves and moves from the ‘blue cloud’ to the ‘red sequence’ in the colour-magnitude diagram, its morphology and properties change (e.g.: its star formation rate decreases). This process is called ‘galaxy quenching’. With the new Galaxy Zoo data and the classifications that everyone involved made, we saw that galaxies with weak bars are found in both the blue cloud and the red sequence, whereas the strongly barred galaxies are very much clustered in the red sequence, as you can see below. In more detail, strongly barred galaxies only make up ~5% of the blue cloud, while making up ~16% of the red sequence. To contrast this, weakly barred galaxies have a much more modest increase, populating ~17% and ~21% of the blue cloud and red sequence, respectively.

This finding hints at a fundamental difference between the two types of bars, but in order to do real science we need to interpret the clustering of the strong bars correctly. Do strong bars cause the galaxy to quench and move up the red sequence or can a strong bar only form if the galaxy is already sufficiently quenched – a chicken or egg question on the scale of galaxies.
Before I end this post, I want to emphasise that this research is only made possible because of many volunteers, like yourself, that help classify galaxies and we are very grateful for your time and effort. However, this is only the start and a lot of work still needs to be done, so keep on classifying!
I hope to report on interesting new developments soon.
Cheers,
Tobias
