
Stellar Populations of Quiescent Barred Galaxies Paper Accepted!
A new paper using Galaxy Zoo 2 bar classification has recently been accepted!
In this paper (which can be found here: http://arxiv.org/abs/1505.02802), we use hundreds of SDSS spectra to study the types of stars, i.e., stellar populations, that make up barred and unbarred galaxies. The reason for this study is that simulations predict that bars should affect the stellar populations of their host galaxies. And while there have been numerous studies that have addressed this issue, there still is no consensus.
A graphic summary of this study is shown here:
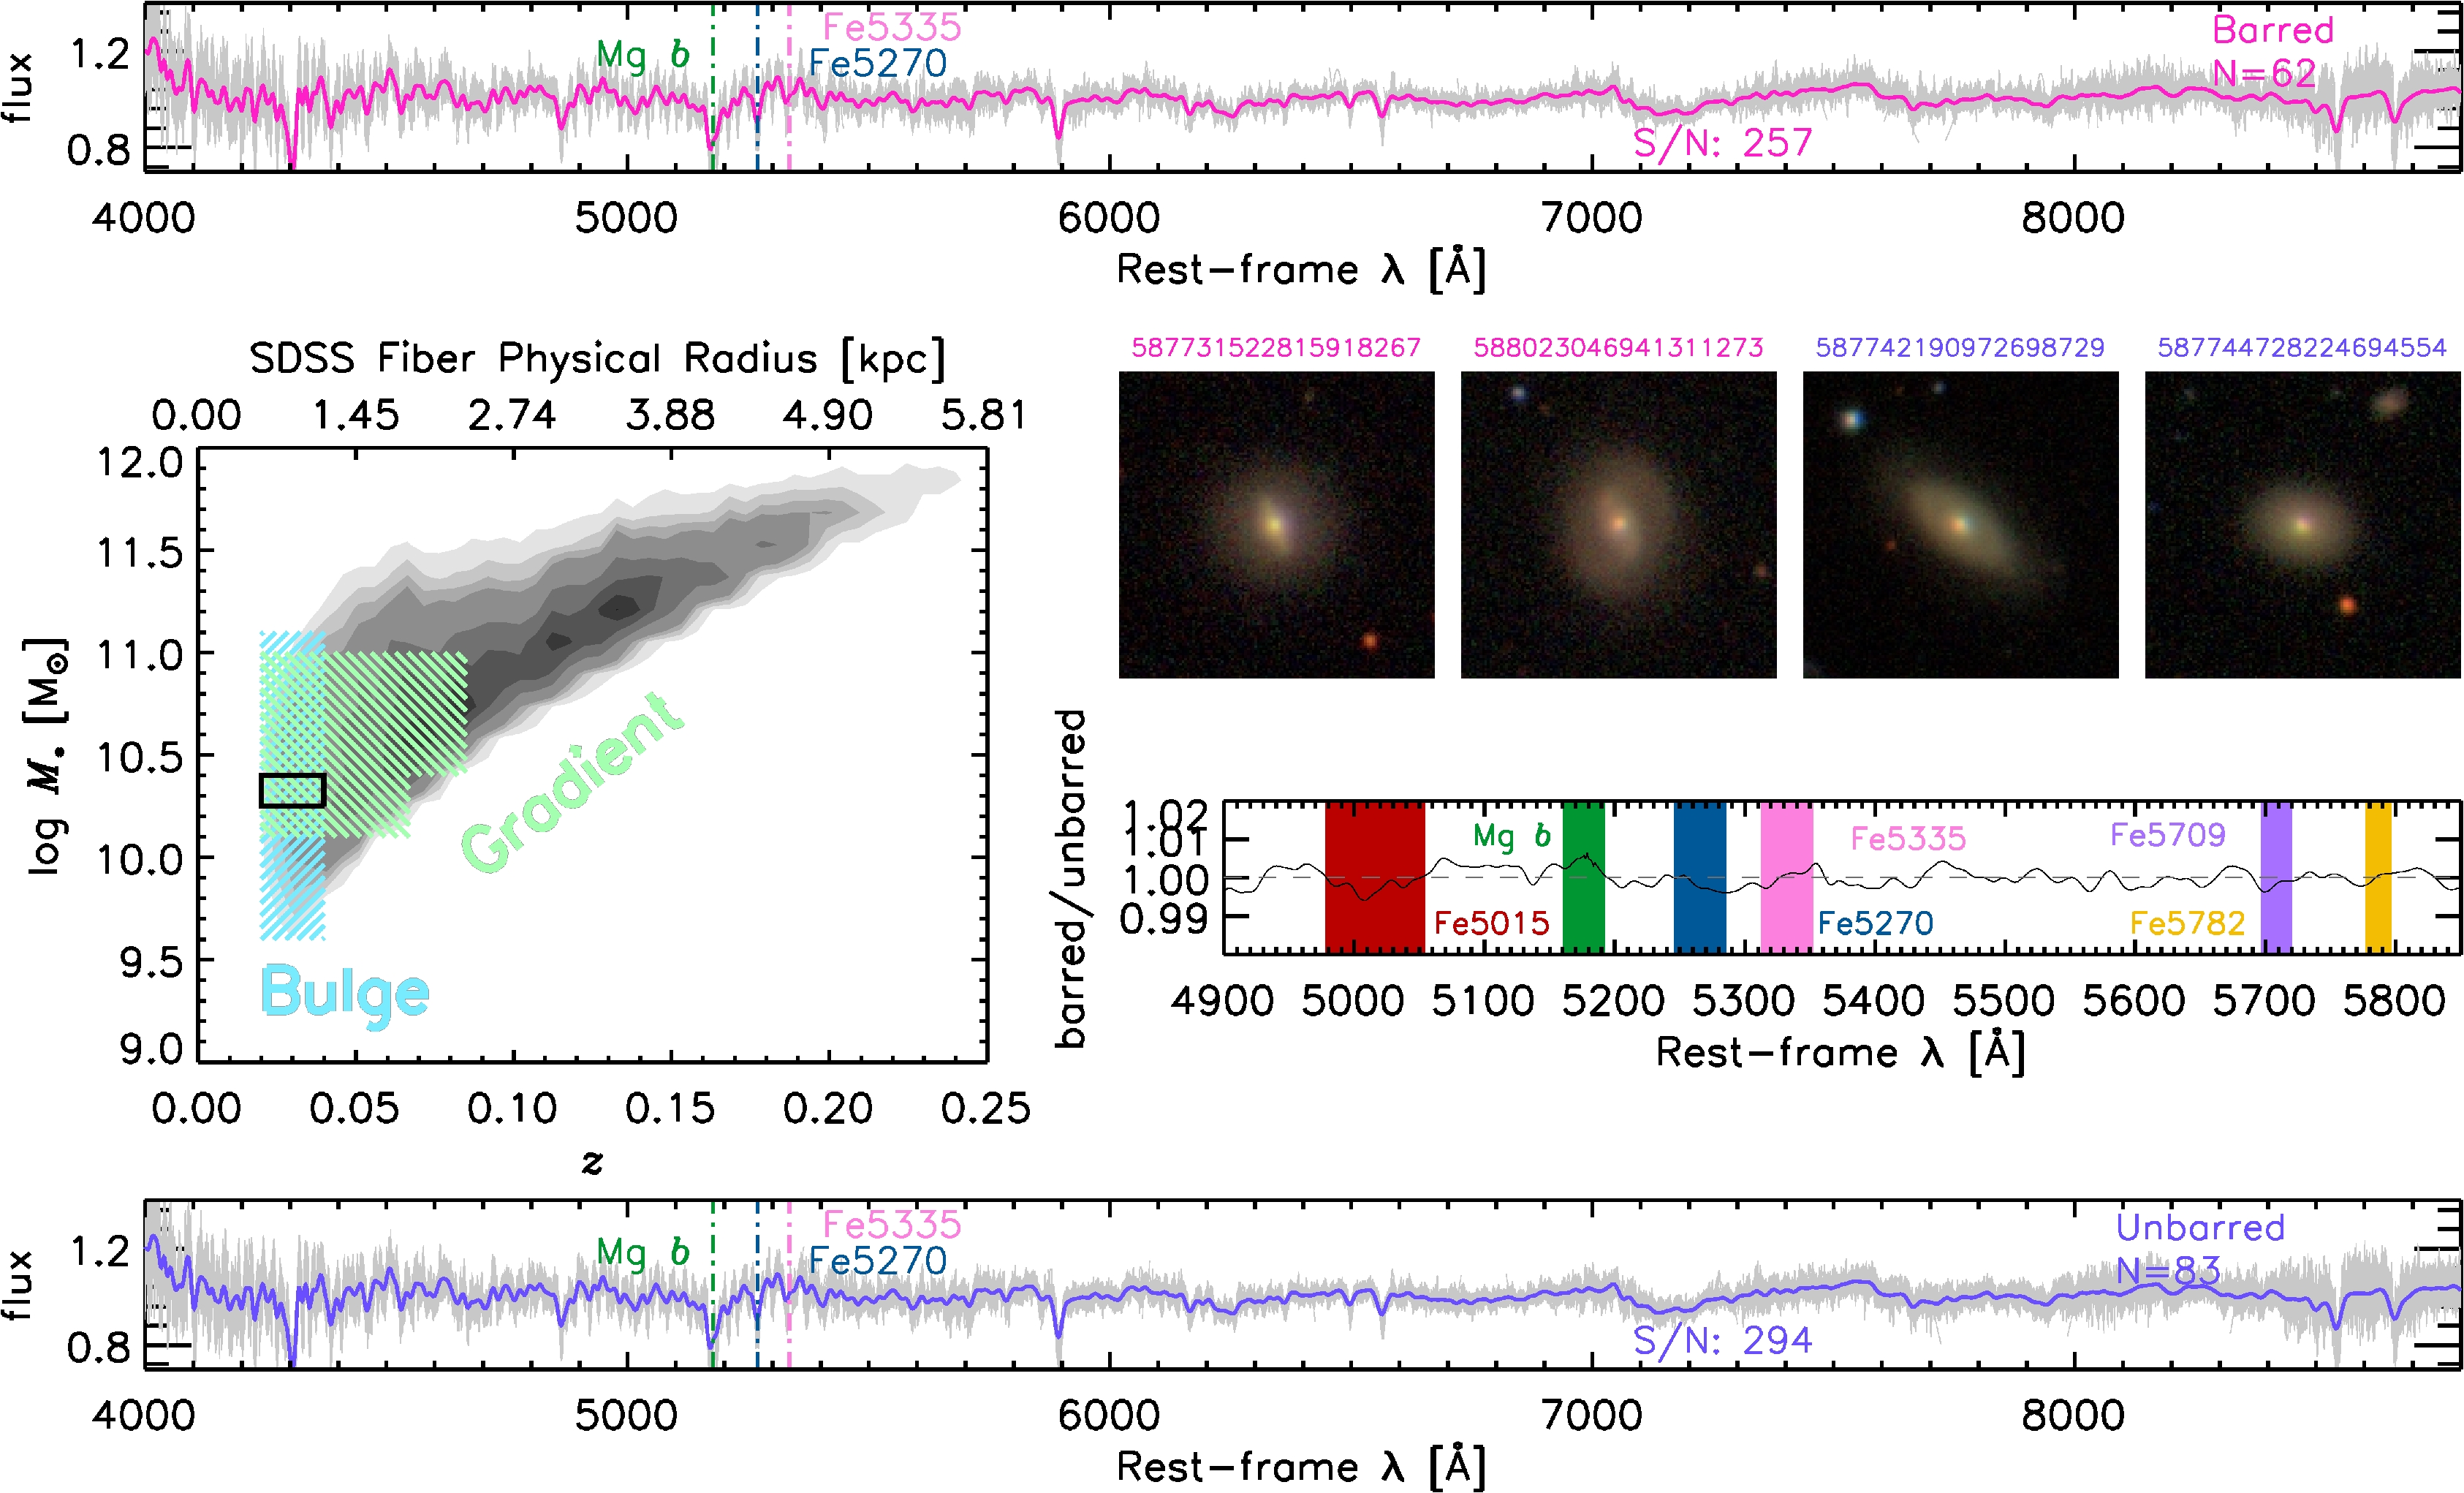
In this study, we stack hundreds of quiescent, i.e., non-star-forming, barred and unbarred galaxies in bins of redshift and stellar mass to produce extremely high-quality spectra. The center-left panel shows our parent sample in grey, and the cyan and green hash marks represent our galaxy selection for our bulge and gradient analysis. The black rectangle represents one of the bins we use. The upper and lower plots show the resultant stacked spectra of the barred and unbarred galaxies, respectively. We show images of barred and unbarred galaxies in the center, selected with the Galaxy Zoo 2 classifications. Finally, the center-right panel shows the ratio of these two stacked spectra at several wavelengths that reflect certain stellar population parameters.
Our main result is shown here:
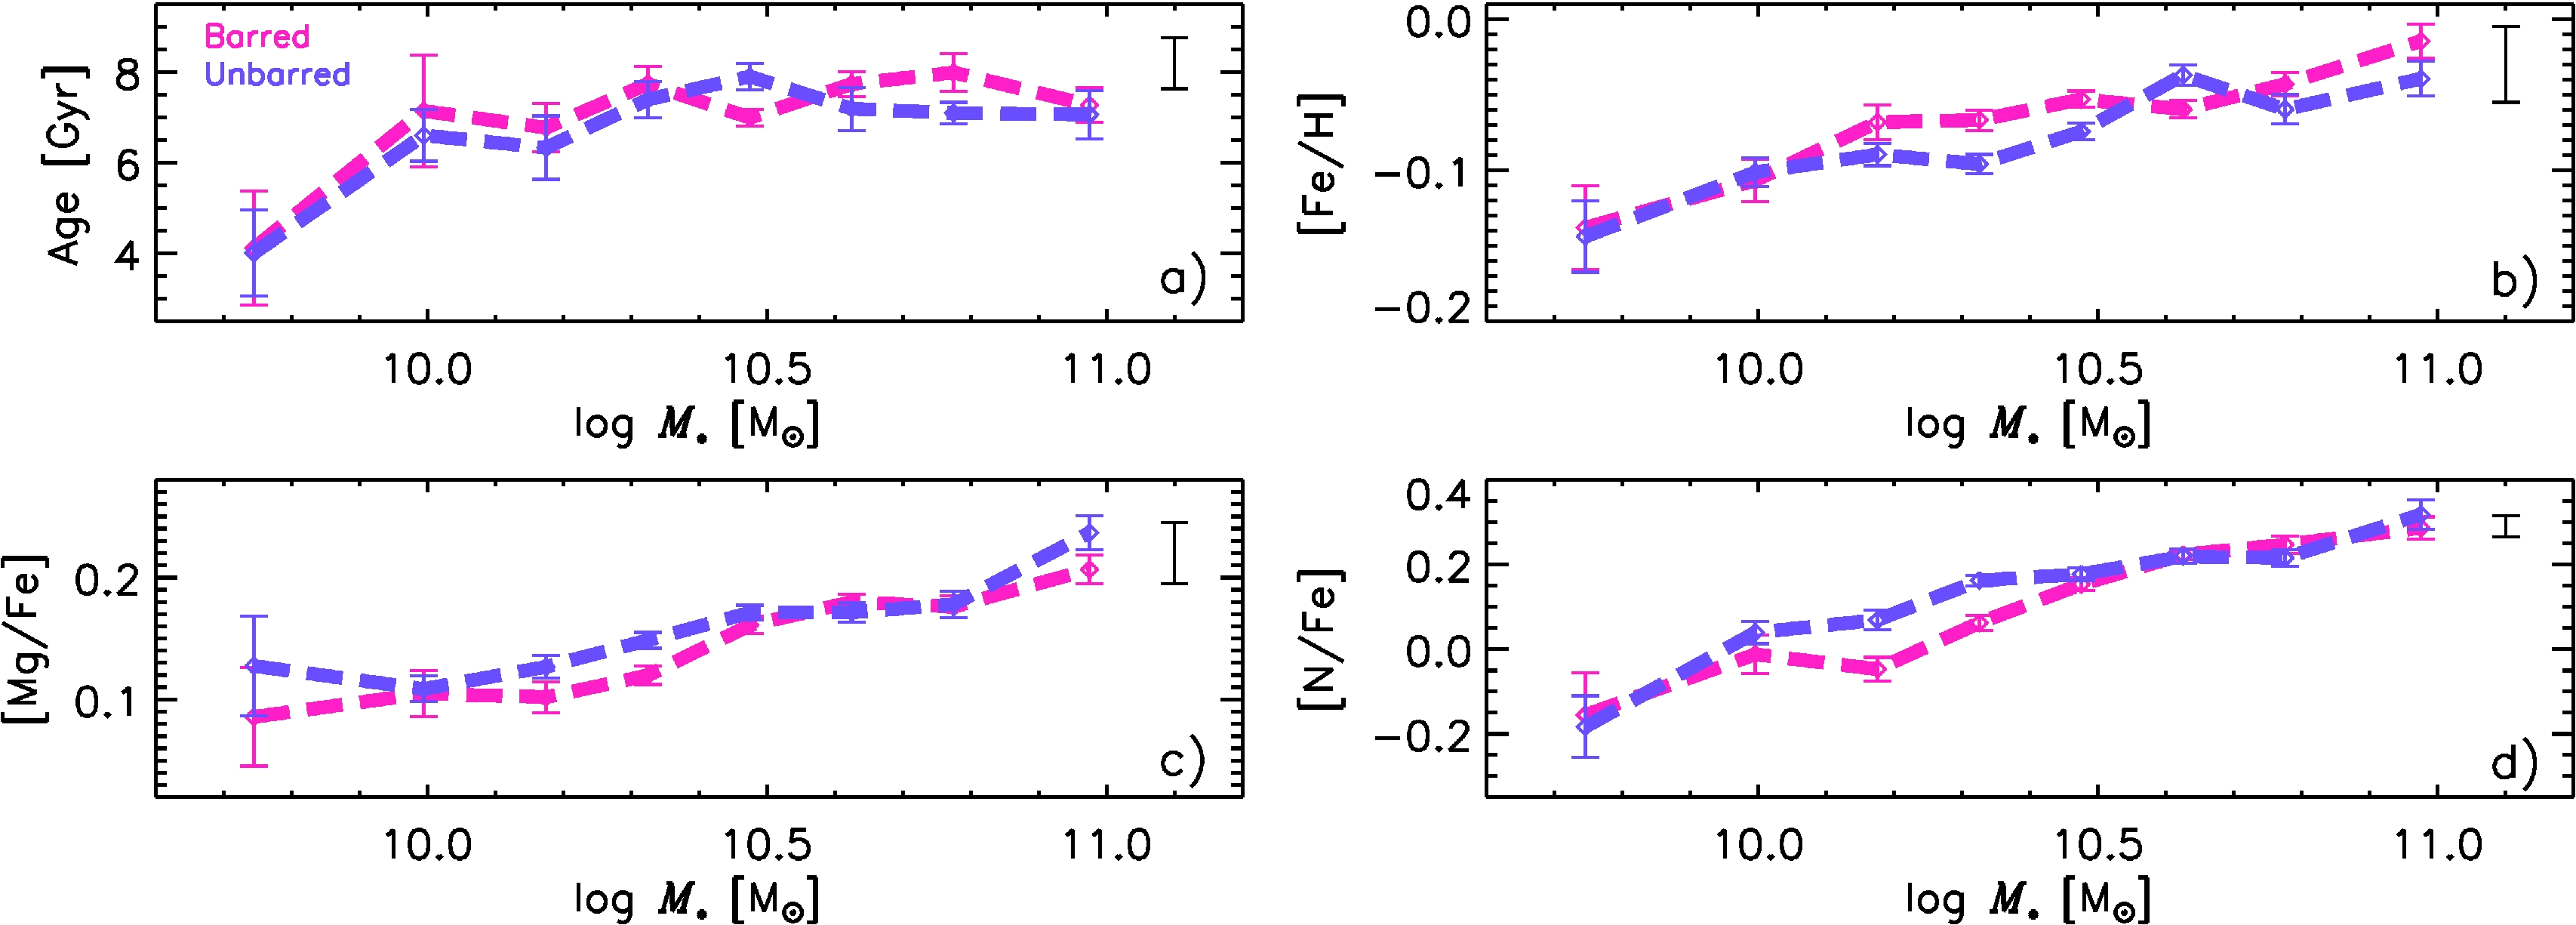
We plot several stellar population parameters as a function of stellar mass for barred and unbarred galaxies. Specifically, we plot the stellar age, which gives us an idea of the average age of a galaxy’s stars, stellar metallicity ([Fe/H]), which gives us an idea of the relative amount of elements heavier than hydrogen in a galaxy, alpha-abundance ([Mg/Fe]), which gives us an idea of the timescale it took to form a galaxy’s stars, and nitrogen abundance ([N/Fe]), which also gives us an idea of the timescale it took to form a galaxy’s stars.
The main result of our study is that there are no statistically significant differences in the stellar populations of quiescent barred and unbarred galaxies. Our results suggest that bars are not a strong influence on the chemical evolution of quiescent galaxies, which seems to be at odds with the predictions.
Finished with Hubble (for now), with new images going back to our “local” Universe
Thanks for everyone’s help on the recent push with the Hubble CANDELS and GOODS images. I’m happy to say that we’ve just completed the full set, and are working hard on analysis of how the new depths change the morphologies. In the meantime, we’re delighted to announce that we have even more new images on Galaxy Zoo!
The new set of images now active are slightly different for us, and so we wanted to explain here what they are and why we want to collect classifications for them.
In all phases of Galaxy Zoo so far we have shown you galaxy images which are in colour. The details of how these are created varies depending on which survey the images are from. With the SDSS images, we combine information from three of the five observational filters used by Sloan (g, r, i) to produce a single three-colour image for each galaxy. We’ve talked before in more detail about how those colour images are made. All five Sloan filters and their wavelengths and sensitivity are shown below. You can probably see why we’d pick gri for our standard colour images: these are the most sensitive filters, roughly in the “green”, “red” and “infrared” (or just about) parts of the spectrum.
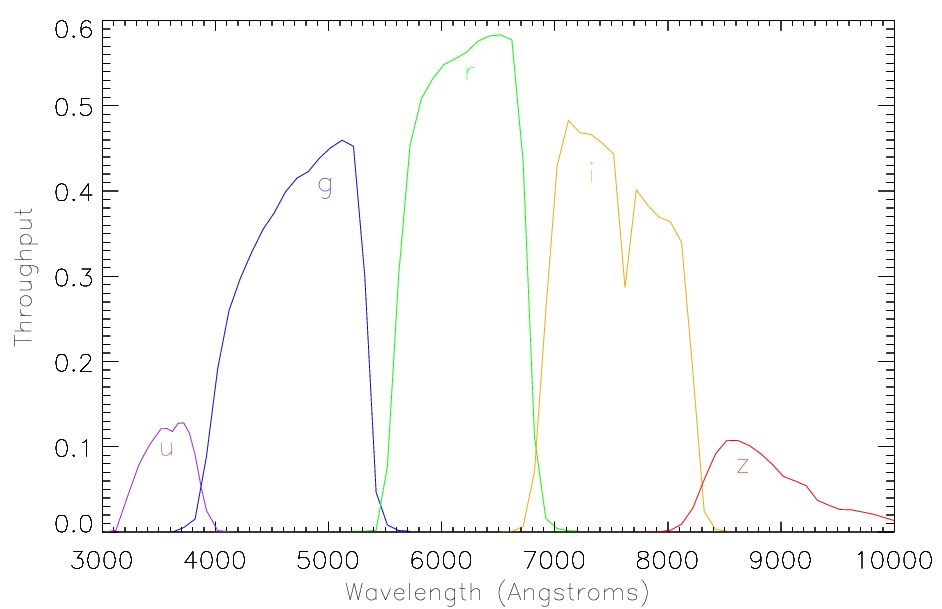
The five SDSS filters and the wavelengths they span.
Each of the SDSS filters is designed to observe the galaxy at a different part of the visible (or near visible) spectrum, with the bluest filter (the u-band; just into the UV part of the spectrum) and the reddest the z-band (which is into the infra-red). Different types of stars dominate the light from galaxies in different parts of the spectrum, for example hot massive young stars are very bright in the u-band, while dimmer lower mass stars are redder. Galaxies with older populations of stars will therefore look redder, as the massive blue stars will all have gone supernova already.
We are interested in measuring how a galaxy’s classification differs when it’s observed in each of the filters individually. To investigate this specific question, we have put together a selection of SDSS galaxies and instead of showing you a single three-colour image for each, we are showing you separately the original single filter images. We want you to classify them just as normal, and we will use these classifications to quantify how the classification changes from the blue to the red images.
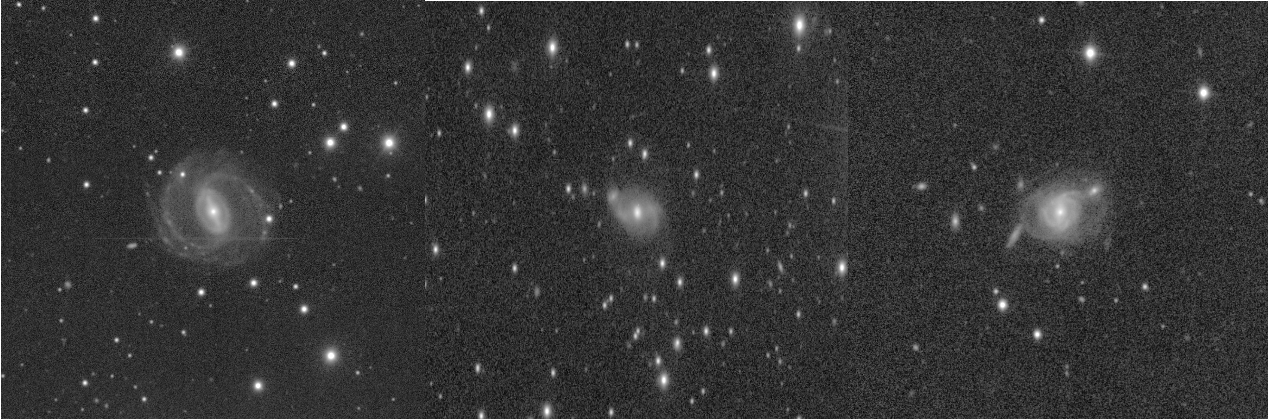
Example postage stamp images of the monochromatic single filter images.
Astronomers have a good “rule of thumb” for what should happen to galaxy morphology as we move to redder (or bluer) filters, but it’s only ever been measured in very small samples of galaxies. With your help we’ll make a better measurement of this effect, which will be really useful in the interpretation of other trends we observe with galaxy colour.
(Hint: some users might want to use the “Invert” button on the Galaxy Zoo interface a little bit more for these images, as some galaxies are more clearly seen when you toggle it.)
