
(Galaxy) Bars in the Summer
This is a guest post by Freya Pentz, who has spent much of this summer doing research with Galaxy Zoo.
Hi Galaxy Zoo volunteers!
I’m a summer student at the Zooniverse. I’m at university studying natural sciences about to go into my second year and for the past 5 weeks I’ve been working at the Zooniverse office here in Oxford. I wanted to let you know what I’ve been doing during that time.
I’ve been using data from the Galaxy Zoo: Bar Lengths project, writing code to process the information and making sure it looks sensible. Before I started working at the Zooniverse, I had done very little computing so I had to learn a lot! For those of you who are interested, I’ve been using python to extract the measurements you did on the galaxies and plotting graphs with all the data. Learning how to use python was like learning another language but it was definitely worth it.
The first thing I did was to find out how many of the galaxies that you’ve classified have bars. That meant looking at the answers to the first question about the galaxy in the Bar Lengths project ‘Does this galaxy have a bar’ and seeing for each galaxy if most people answered ‘Yes’ or if most people answered ‘No’.

Remember this question?
Luckily, the code could do that for me; otherwise I would have had to look at over 66000 answers! So far, 4960 galaxies have been classified out of a total of 8612 in the project. Your classifications show that 700 of these have a bar, meaning that the fraction of classified galaxies with a bar is around 14%. This is similar to the 10% bar fraction referred to in the study recently done by the Galaxy Zoo and CANDELS teams on bar fractions out to z=2 (blog post & paper). This number will probably change a little bit as more galaxies get classified, but it’s good that it is similar to known values so far.
The next thing was of course to find the lengths and widths of the bars. When you draw lines on the galaxy to mark the length and width, the database records this as coordinates. Each line has four coordinates, 2 x coordinates and 2 y coordinates. Once you have the coordinates, it’s fairly simple to turn them into lengths. All you need is some Pythagoras. When plotting a histogram of the lengths, the shape was a Gaussian distribution, or a bell curve. This shows that most of the galaxies have lengths between certain limits (5-15 kpc) and then as you go beyond these limits, the number of galaxies decreases.
During my time here, I found some interesting galaxies. When I first looked at the redshifts, there was a galaxy with a redshift of 4.25. I mentioned this to a couple of people on the Zooniverse team and they all said there wouldn’t be a galaxy with such a high redshift in the sample. I checked it out and this is the galaxy in question:

The galaxy that fooled the computer into thinking it had a redshift of 4.25
You can see that there is a bright blue smudge in the top left of the galaxy. When I first saw this, I thought it was a lens. It looks like one, and you can just see a small bit of blue on the other side of the galaxy’s core, suggesting a lens even more. According to the experts in the Zooniverse however, this is probably not a lens, as the galaxy does not look massive enough to lens light. Also, the blue curve is well inside the galaxy, instead of being around the outside. Usually, all the mass of the galaxy is needed to lens an object so the light would appear around the edge. The blue curve is most likely an unusual feature of the galaxy itself, which can explain why the reported redshift is so high. The redshift for this galaxy was measured photometrically. This is where astronomers use galaxy colours across a wide range of wavelengths to predict the likely redshift. This method of measuring redshift is much more prone to error than spectrometry (where the absorption lines for certain elements in a galaxy are observed and the shift of these lines is measured) so the blue smudge could have easily made the telescope think the redshift was higher than it is. This redshift is therefore almost definitely a mistake. We also know this from the high resolution of the image. You normally wouldn’t be able to see a galaxy with even a redshift of 1 this well!
The reason telescopes have to use photometric redshifts sometimes even though they are often wrong is that there is not enough time to take a spectrum of every galaxy when you are conducting a large survey of the sky. Telescope time is expensive and photometric measurements allow you to get a bit of information about lots of galaxies which can sometimes be more useful that getting a lot of information about a few.
When running into problems like this it was really useful to be able to look at a picture of the galaxy on the Galaxy Zoo: Bar Lengths website. Looking at the galaxies and seeing in real life what the data on the graphs was telling me was probably my favourite part of my time at the Zooniverse. It’s so amazing that thanks to the Sloan Digital Sky Survey, the Hubble Space Telescope projects and other mass surveys of the universe, we can actually look at pictures of thousands of galaxies easily.
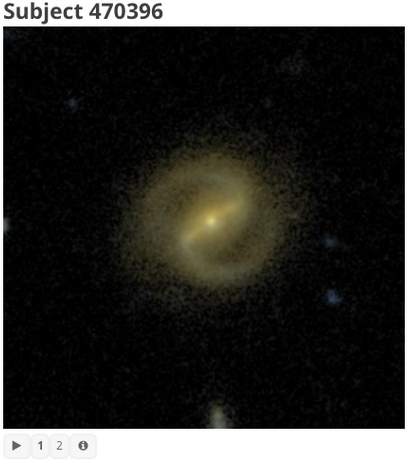
A cool barred galaxy you can see in Bar Lengths
The Zooniverse is such a cool organisation and I’m lucky to have worked for them this summer. The great thing about them is that you can get involved too! I know from my work with Bar Lengths that even if a few people log on and classify in any of the projects, it can be really helpful. None of the science can be done without you providing the data.
Measure some galaxies here:
www.zooniverse.org/projects/vrooje/galaxy-zoo-bar-lengths/classify/
Or have a look at some of the other projects here:
Freya

As far as I know, the image 472009 shows the galaxy, whose GOODS survey ID is GDS J123800+621814! If so, it had been published in following paper as a Lens Candidate!: http://arxiv.org/abs/astro-ph/0309060
Curiously, in the blog post there is said following.: “According to the experts in the Zooniverse however, this is probably not a lens, as the galaxy does not look massive enough to lens light.”
472009 isn’t one of the six most promising lens candidates, whose images are presented in the paper, but it is shown as a lens candidate in the related list.: http://www.stsci.edu/science/goods/lensing/Lenscands/lenscands.html
Good to know the rest of us weren’t way off to consider it a possible candidate! As Freya says, it really looks like it might be promising… but then again, that paper does say that they’re going to try and target galaxies for spectroscopic follow-up, yet we haven’t heard anything more about this source for a long while since. I wonder if they did get that spectrum…
Below there is another GZ image of the galaxy 472009! Survey:GOODS full-depth: http://talk.galaxyzoo.org/#/subjects/AGZ000825u
happy I could help!