
Oh, Sweet Spiral Of Mine

See the video of our latest hangout here (or, if you prefer, click to download the podcast version):
Spiral galaxies are seemingly endless sources of fascination, perhaps because they’re so complex and diverse. But why does spiral structure exist? Why do some spiral galaxies have clearly defined spiral arms and others have flocculent structure that barely seems to hold together? What’s the difference between a 2-arm spiral and a 3-arm spiral? How many kinds of spirals do we actually observe? And what is happening to the stars and gas in spiral galaxy disks?
.")
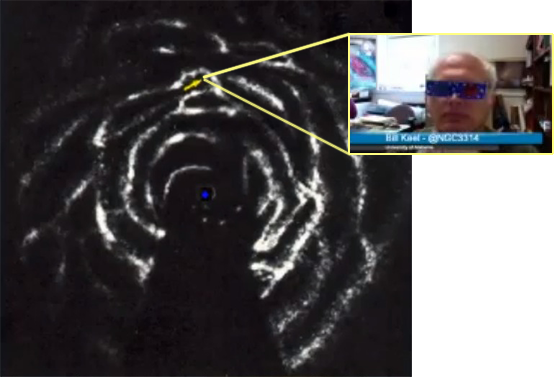
Clockwise from top right: X-ray, UV, optical, near-IR, mid-IR, far-IR, radio
All of the above questions are related to a question we got right at the end of our last hangout: what is the significance of the number of spiral arms? Determining how many spiral arms a galaxy has is hard, and is often subjective — so why bother?
It’s a good question. Part of the reason spiral arm classification & count is a challenge is that it often depends on the wavelength at which you observe a galaxy. New stars tend to form along the spiral arms, whereas older stars have time to spread out into more uniform orbits. So ultraviolet observations of a galaxy, which tend to pick out the new and bright stars, often highlight the spiral arms much more strongly than longer-wavelength observations, which see more light from older stars.
It’s not quite that simple, though. As you get to longer and longer wavelengths, you start to pick up the heat radiated by clouds of gas and dust, which are often stellar nurseries — and often trace spiral arms. At a wavelength of 21 centimeters you can detect neutral Hydrogen, which provides raw material for the cooling and condensation of gas into cold, dense molecular clouds that form stars in their densest pockets. Each wavelength you observe at provides a glimpse at a different targeted feature of a spiral galaxy.
A map of neutral Hydrogen in the Milky Way — complete with yellow “you are here” arrow.
Including our own, of course: we live in a spiral galaxy (though how many arms it has, and whether it’s flocculent, is a matter of debate), and it provides the best means of studying star formation up close. When studying other galaxies, it’s easy to get caught up in the race to discover the biggest, the smallest, the farthest and the most extreme, and forget that our own Universal neighborhood is pretty amazing too.

Herschel sees much longer wavelengths than HST, so its resolution isn’t as high even though it has a bigger mirror. (Click to see a larger version.) Credit: ESA/NASA
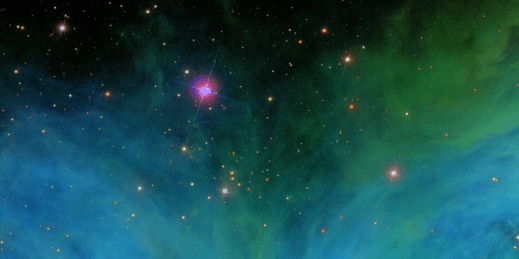
For example, one of the most famous nebulae in the world was recently imaged by one of the most famous telescopes in the world — again — but this time in the near-infrared. The Horsehead Nebula is a well-known feature in the Orion star-forming complex, and the new Hubble images provide a great opportunity to learn even more about this region that has been studied for hundreds of years. How thick and cold is the gas and dust in the nebula? How long will it take for it to dissipate under the harsh radiation of the bright, young stars near it? What’s going on behind it?
The near-infrared view from HST is sort of the sweet spot in this spectacular space — the wavelengths aren’t so long that the resolution suffers, but they are long enough that you see through a bit more of the clouds than in the optical. So you see more of the structure of the cloud itself, and more of where it’s thin and thick. If you zoom in, you can even see distant galaxies peeking through! And not just on the edges: in some parts you can see galaxies through the middle of the nebula. Wow. This image alone contains spiral galaxy insights big and small, near and far, from the very distant universe and right in our own backyard.
Note: right at the end of the hangout, we again got another great question from a viewer that we didn’t have time to answer. So stay tuned for the next hangout when we just might have a thing or two to say about dark matter, dark energy and new projects!
Next GZ Hangout: Thursday, April 25th, 18:30 GMT
Our next hangout will be on Thursday the 25th of April at 6:30 p.m. GMT, which is 11:30 a.m. Pacific Daylight Time, 2:30 p.m. Eastern Daylight Time, 7:30 p.m. British Summer Time, 8:30 p.m. Central European Time and 9:30 p.m. Central African Time.
Just before the hangout we’ll update this post with the embedded video, so you can watch it live from here. Last time we had some great live tweets from volunteers during the hangout. If you’re watching live and want to jump in on Twitter, please do! we use a term you’ve never heard without explaining it, please feel free to use the Jargon Gong by tweeting us. For example: “@galaxyzoo GONG big bang nucleosynthesis“.
In the meantime, please feel free to leave a question in the comments section below. See you soon!
Update: view the summary and video here!
Two Atoms Populate on a Dust Grain
I enjoy days where we get to use questions from the public to meander our way through the Universe. Our latest live hangout saw us discussing the latest update to the Galaxy Zoo site — made based on your clicks! — and doing a live, collective classification on a few example objects from our Hubble sample that we hope represent the kind of things you’ll be seeing more of from now on.
We debated, for example, whether this galaxy’s central “feature” was a bulge or a bar:
.")
We also discussed whether these galaxies are merging or overlapping.
Whether this relatively featureless galaxy’s blue smudge indicates a voorwerp:

Depending on the redshift, a voorwerp in Hubble could be blue, green or red.
And how many spiral arms this galaxy has:

Also, these two galaxies may have roughly the same proportions between them as between the Milky Way and the Large Magellanic Cloud.
We also talked about the origin and importance of dust in galaxies, and just what a green pea would look like in the Hubble data. Green peas are galaxies with incredibly high rates of star formation. They’re rare in the local Universe, but how rare do we think they were billions of years ago, at the epoch we’re looking back to with Hubble?

Thing is, a “green pea” at redshift z=2 would be bright red.
And, for that matter, what were the stars like then? Astronomers very broadly group stars into three populations depending on their composition. The very earliest stars were made from the primordial elements forged during the Big Bang — almost entirely Hydrogen and Helium, nearly devoid of anything else (we call “anything else” a metal, including elements like Carbon and Oxygen). The next generation of stars had some metals, but the Universe has been around long enough that those stars (even the lower-mass ones that live for a long time) are past their prime and a new generation, one with compositions generally like our Sun, are now in their heyday.
Naturally, though, since the Sun is our First Star, we call its generation Population I. The slightly older stars, many of which are still around and living in our galaxy and others, are Population II; and the very massive rockstars of the early universe that have all died out are called Population III. So “Pop III” were the first stars — a slight reversal, but labels and names that seemed like a better idea at the time than with hindsight are nothing new in Astronomy. (Exhibit A: the magnitude system. Exhibit B: “planetary nebula“.)
Bonus: green peas, voorwerpjes, and planetary nebulae are just three of the phenomena that (at least in part) glow green to human eyes because of one particular frequency of light emitted by Oxygen at a certain temperature, an atomic transition seen only rarely on Earth but fairly often in the Universe.

This VLT image shows the planetary nebula IC 1295 in ghostly green. Image Credit: ESO
Also, did you know that dust grains are the singles bars of the atomic universe, allowing atoms to meet and combine into molecules and cooling the gas clouds they live in — which in turn helps new stars form? Heating and cooling, gravity and pressure, and the interplay between atoms, molecules, and radiation are all a part of what gives us this amazingly diverse Universe. We understand quite a lot of it given that we are such a tiny part of it, but what we know is dwarfed by what we don’t. And that’s just the way astronomers like it… we love a challenge and we’re glad to have as much help as possible sorting things out.
Here’s the hangout video:
Using Galaxy Zoo in the Classroom

Recently Jen Gupta, ICG Portsmouth’s Outreach Officer, wrote a very useful description of Navigator, a new tool for using Galaxy Zoo in the classroom (brought to you by Zooteach).
Jen’s excellent post shows many example screenshots of Navigator at work, and goes into much more detail about how to use it. Read Jen’s post here.
I’ve now used Navigator twice, once for an open evening in Oxford and once for a STEM festival at a school in Hampshire. The formats were very different: at the student open evening we gave 15-minute presentations that included classifying and then using Navigator to show and discuss the students’ classifications. The festival had about 1700 attendees in total, and Zooniverse was just one exhibit, so we had people wandering in and out in groups large and small. In Oxford we set up several computers for the students to use, and at the festival we had several iPads to go along with the desktop machine hooked up to the projector. But all were classifying in the group, and as the day went on we amassed more and more classifications to talk about.

So far I’ve found Navigator is really useful for two things in particular:
- Discussing classification difficulties and distributions: the My Galaxies tool will show you how the group’s classification of a particular galaxy compares to whatever other classifications exist for that object. Sometimes a galaxy has one clear classification that stands out, and other times it looks like nobody really agrees about whether it’s smooth versus featured. You can use that to talk about why it’s important to have so many people classify one galaxy, and how it relates to how confident you are in your own classification (and why it means you should still classify even if you aren’t sure).
- Making and testing predictions: The open night was for students about age 10, so many of them didn’t really even know what a galaxy was. The festival had students of all ages and plenty of adults as well. I showed some examples and explained that astronomers think elliptical (smooth) galaxies are made by merging two smaller galaxies together in a violent collision. From that you can predict that smooth galaxies should be bigger and brighter than featured galaxies on average, if you often make a smooth galaxy by crashing two featured galaxies together. You can use the Histogram tool to plot absolute brightness of smooth versus featured galaxies and see whether that prediction turns out to be true. (But remember that with magnitudes, more negative actually means brighter!)
I’m still pretty new to using Navigator, but I can already tell it’s a powerful educational tool and I can’t wait to see what people do with it!
More Hubble Features, and More Often!
Here at Zooniverse HQ we’ve been thinking a bit more about those “fuzzy blobs” we talked about during our last hangout. Many of those faint galaxies are among the most distant objects we’ve ever seen, so we really want to learn about how they’ve formed and what they look like, but in some cases they are just too faint to get a really detailed classification. We can probably learn what their overall shape is, and possibly tell whether they’re disturbed or interacting, but spiral arms? Bars? Bulge strength? Not likely. Read More…
Next GZ Hangout: Wednesday, 10th April, 19:00 GMT
We’re trying a new time for our hangouts to make it easier for those of our viewers in North America to tune in live. Our next live hangout will be on Wednesday the 10th of April at 7 pm GMT. That’s 9 pm in Europe, 8 pm in the UK, 3 pm EDT and 12 pm PDT. Even if you live in Hawaii you won’t have to skip your morning cuppa to hang out with us (9 am HST)!
Update: The video link and the summary post (also with a video link) are here.
If you have any questions you’d like the science team to answer live on the air, please feel free to leave a comment below, or tweet them directly @galaxyzoo. During the hangout, if we use a term you’re not familiar with, you can use the jargon gong by tweeting at us too. For example, “@galaxyzoo GONG laser guide star” would have been perfectly appropriate during the last hangout. Go on… gong us! We like it!
Blood Oranges are just like Hubble Galaxies

Astronomers always want better images. Sometimes it’s possible right away; other times doing better requires new technology and/or waiting for the next generation of telescopes. We have both kinds of “fuzzy blobs” in Galaxy Zoo, and during this hangout we showed several examples. For a couple of hangouts now we’ve been meaning to address some of the most frequently asked questions about the faintest, most distant galaxies we ask volunteers to classify:
- what are they?
- why are the images so fuzzy?
- can we get better images of them now or in the future?
Given the data we have, the short answer to the first question is that we don’t yet know for sure — and, perhaps most importantly, we don’t need to know all the details. We can learn quite a lot from classifying even faint, fuzzy objects. Some of the faint galaxies on Galaxy Zoo are among the most distant galaxies ever imaged by the Hubble Space Telescope, and we don’t necessarily expect them to look like galaxies we see more nearby, so classifications from our volunteers are helping us to understand them even when we don’t have all the information we might want.
And what would it take to give us the information we want? What’s the future of astronomy after Hubble? How can we get better data than we have right now? Do we need to go into space to do it? (And what else are we working on right now, anyway?) Answers given in the video:
This is a great time to be working on Galaxy Zoo: there’s plenty to classify and analyze, and — of course — plenty to discuss. So stay tuned for next time!
Note: for those who prefer audio only, here’s a link to the podcast version.
Next GZ Hangout: Friday, 22nd March, 15:30 GMT
Next Galaxy Zoo Hangout: Friday, the 22nd of March, 2013, 3:30 p.m. GMT (time zones are currently weird since the US has sprung forward but Europe has not, so that’s 4:30 p.m. Central European Time, 11:30 a.m. Eastern Daylight Time, 8:30 a.m. Pacific Daylight Time).
Want to contribute for our next hangout? Post your questions & comments below and/or feel free to tweet them @galaxyzoo or post them on Facebook.
During the chat, if we use a science term you aren’t familiar with, please use the Jargon Gong by tweeting us with a GONG (example: “@galaxyzoo GONG SPS template fitting“); we’ll be happy to explain!
Update: view the video here!
Jargon Alert: Your IMF Just Messed With My SPS!
I remember going to a lecture as an undergraduate wherein my professor compared what astronomers do to a hypothetical alien crew on a fast-moving ship that can only take one photo of the Earth as it passes by. We can assume they have a special camera that can see through buildings, but otherwise they just get one photo of, say, a major city, and from that they have to try and learn as much as they can about the human race. How hard would it be to discover that our species has two genders? Or that both of them are required to propagate the species, but only one gives birth? Would it be possible to figure out the whole human life cycle? To discover what disease is? To distinguish between genetics and culture (nature and nurture)? Just having one picture is limiting, but with careful study you can learn more than you think.

One of the most fundamental plots in astronomy.
The professor was drawing an analogy with the Hertzsprung-Russell diagram in particular, which we’ve talked about before on our hangouts: to make it, you record the color and the luminosity of all the stars you can and plot them up against each other, one point per star. The stars group together in interesting ways in particular areas of the diagram, and it turns out that from this diagram alone you can recover an enormous amount about the life cycles of a population of stars (for example, in a star cluster, a neighborhood of our own galaxy, or a nearby galaxy). You can learn even more if you couple the diagram with spectra of stars from different parts of it. Studying stellar populations has helped us understand the fundamentals of what kinds of stars exist, how they are born and die, and how many stars of any given mass are likely to develop in a galaxy in relation to stars of different masses. That last thing is called the Initial Mass Function (IMF for short). Essentially it says that, when stars form in groups, more low-mass stars form than high-mass stars. Put that together with what we know about how much brighter high-mass stars shine and how much faster they die than low-mass stars, and you can start to understand how whole populations of stars in galaxies form and evolve.
And we can apply our studies of nearby galaxies and groups of stars to galaxies we observe much farther away. It’s a good thing, too, since most galaxies are far enough away that our current telescopes can’t resolve individual stars. We just get the sum of the light from all the stars. That combined light is sometimes made up of multiple populations of stars that formed in groups at different times and now all live together in a particular galaxy. Taking that single picture combining the light from billions (often hundreds of billions) of stars and using it to learn about the stars’ masses, ages and histories is an important process, and there are several ways to do it: one way combines models of stellar populations made by forming and evolving many stars in a computer simulation. This is sometimes called Stellar Population Synthesis, or SPS.
On today’s live Hangout, we once again let your questions guide us as we talked about IMFs and what they have to do with SPS and measuring the stellar masses of galaxies. The work that laid the foundations for today’s study of galaxy stellar populations was done in large part by women (Bill mentioned Beatrice Tinsley, for example), which is fitting since today is International Women’s Day. We talked about that too, and about diversity in general in astronomy. Just as you can learn a lot from even one snapshot of a galaxy, you can do a lot with just a bit of mindfulness about being an ally for diversity (Kyle noted on Twitter that World Day for Cultural Diversity is May 21), be it equality for women or for any other minority groups in science, or indeed any field.
Here’s the audio-only version of the Hangout: click to listen to mp3 version.
And the video:
We’ll post about our next hangout soon; in the meantime, keep those questions coming!
Next GZ Hangout: Friday, 8th March, 15:30 GMT
Next Galaxy Zoo Hangout: Friday, the 8th of March, 2013, 3:30 p.m. GMT
Want to contribute for our next hangout? Post your questions & comments below and/or feel free to tweet them @galaxyzoo or post them on Facebook.
Shortly before the hangout starts, we’ll embed the video in this post so you can watch from here. And during the chat, if we use a science term you aren’t familiar with, please use the Jargon Gong by tweeting us with a GONG (example: “@galaxyzoo GONG forbidden [OIII] atomic transition” — not that I’m quoting the last hangout or anything); we’ll be happy to explain!
Update: video now available at the hangout summary post!
