
Welcome to #GZoo10 : Day 1
It’s the day before Galaxy Zoo’s tenth birthday, and the team have gathered in Oxford for three days of discussing science and our plans for the future. Because it’s Galaxy Zoo, we’re inviting any of you who are interested to follow along online.

Members of the Galaxy Zoo team relax before the start of their meeting in an Oxford pub.
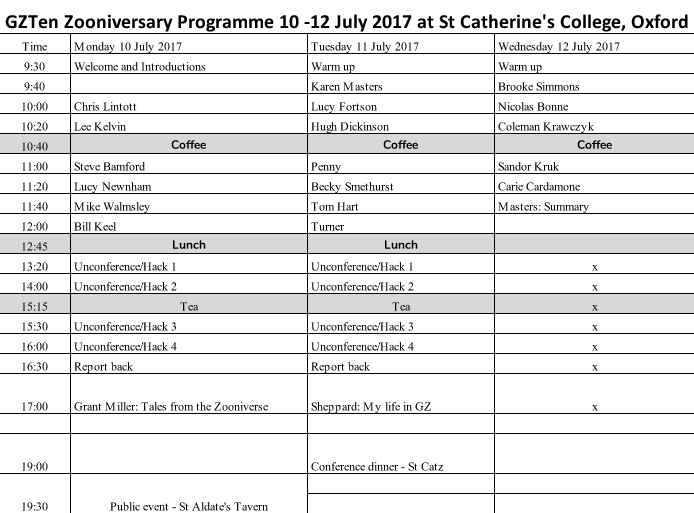
The mornings will be taken up with talks from team members. Today’s schedule is :
10am : Chris Lintott (Oxford)
10.20am: Lee Kelvin (Liverpool John Moores)
11am: Steven Bamford (Nottingham)
11.20am: Lucy Newnham (Portsmouth)
11.40am: Sandor Kruk (Oxford)
12 noon: Bill Keel (Alabama)
All the talks will be available via Oxford’ LiveStream account here. You can ask us questions using the #GZoo10 hashtag on Twitter – we will make sure someone in the audience at each session is watching so comments online make it into the room.
The afternoon will be an unconference and hack session, with the team debating the issues raised during the day and getting to work together. These sessions won’t be streamed, but we will blog about what’s going on.
It’s Becky Smethurst blogging from here on in folks…
So we’ve kicked off the day with our fearless leader of the Zooniverse, Chris Lintott, reminding us that on this day 10 years ago the team were having conversations about how it would be amazing if they could get 10,000 people to help classify. Chris is still amazed that we’re here 10 years later with over 400,000 of you.
I am genuinely astonished to be hosting the tenth anniversary workshop for @galaxyzoo. Less astonishing: meeting in a pub. #gzoo10
— chrislintott (@chrislintott) July 9, 2017
Chris is running through some of the modes in which we work with the Galaxy Zoo data. The first is looking at traditional morphologies, which the project was designed to do, like bars and spirals. The second is “distraction mode” where we’re all distracted by the serendipitous discoveries that the users make which we weren’t expecting, like the Voørwerpjes and the green peas. The final mode is the modelling mode, where we’re fitting models to the Galaxy Zoo data to explain something about the Universe. This mode also includes the amazing work with classifications of simulated galaxy images that are ongoing on the Galaxy Zoo site right now!
One of the questions from the audience for Chris is: “Why have the serendipitous discoveries dried up on Galaxy Zoo?” For one thing Chris thinks that one issue is that is takes so long to follow up on these discoveries – we’re still working on the Voørwerpjes! – but one thing we don’t have with the current images on the site (GAMA and KiDS etc.) is a link to the science survey site where the images come from. We had that with the original Sloan Digital Sky Survey (SDSS) images in Galaxy Zoo 1 & 2 which allowed the users to explore the data themselves and flag up something interesting.
Up next is one of the newest members to the Galaxy Zoo team: Lee Kelvin! He’s telling us about his work with the Galaxy Zoo classifications of the GAMA and KiDS survey images which have just been classified by users on the site. The special thing about GAMA is that it’s multi-wavelength; it takes images in various bands across the spectrum, from the ultra-violet to the infra-red. This is important because, as Lee points out, the morphology of a galaxy changes a lot across different wavelengths.
Galaxies look very different in infrared versus visible light …. #GZoo10 pic.twitter.com/eASGpPYiIh
— Alice Sheppard (@PenguinGalaxy) July 10, 2017
GAMA also has cross-over with the KiDS survey (the main role for which is to map the locations of gravitational lenses in the Universe, like those users hunted for in Space Warps!) which has much higher resolution than the SDSS images originally in GZ1 & GZ2. This means they’re perfect for classifying morphologies because more detailed features are resolved. These images are on the site right now – which means lots of pretty pictures for us to classify! These classifications give the team a wealth of information on the galaxies in these surveys – especially when users flag the interesting cases on Talk.
Most discussed galaxies from the @galaxyzoo GAMA sample – interesting difference from what team might pick #gzoo10 pic.twitter.com/hmUsq2KJZR
— galaxyzoo (@galaxyzoo) July 10, 2017
The early results from these classifications with the images from KiDS look very promising but Lee says there’s lots more work to be done! Including setting up a follow-up Zooniverse project trying to distinguish between true smooth elliptical shaped galaxies and disk galaxies that look smooth – so look out for that project going live in the next couple of months!
We’re back and caffeinated after a refreshing coffee break! Now Steven Bamford has taken the stand and is talking to us about the next steps for morphology studies with Galaxy Zoo.
.@thebamf talking about the next steps in galaxy morphology #gzoo10 pic.twitter.com/4wOqQXMKIC
— galaxyzoo (@galaxyzoo) July 10, 2017
He starts us off by reminding us that we can’t just split galaxies into spiral and elliptical galaxies anymore – it’s a lot more complicated than that with a whole evolutionary sequence of smooth disk galaxies between the pure elliptical and pure spiral galaxy sequences. It’s therefore really important to get both visual classifications from Galaxy Zoo but also quantitative morphologies. A quantitative approach is where you analyse an image to reduce the description of a galaxy down to a number – for example, how disturbed or asymmetric a galaxy is. Steven is explaining how you can do this by making a model of a galaxy’s light and subtracting off the original image and analysing what you’re left with. The problem is that the models are tidy but the galaxies are messy! Deciding which model to use is very difficult but that’s where the Galaxy Zoo classifications come in – they can be used as prior information to decide which model to use.
.@thebamf on using non-parametric fitting to model galaxies #gzoo10 pic.twitter.com/s6qne1yZR2
— galaxyzoo (@galaxyzoo) July 10, 2017
Steven explains the reason why we actually want to do all this model fitting is because we care about population statistics. Sometimes we don’t care about individual objects and we want to look at the big picture – to do that we need to reduce all that information down as much as we can.
Next up is one of the newest additions to the Galaxy Zoo team, Lucy Newnham a PhD Student at Portsmouth! She’s giving us a nice introduction to the big picture of galaxy evolution and how galaxies stop star forming as they evolve. She’s particularly focussing on barred galaxies and whether the bar can cause this shut down of star formation.
Next is @LucyNewnham1 on gas in barred galaxies and how can bars switch off starformation #gzoo10 pic.twitter.com/eIPpwF9PKW
— galaxyzoo (@galaxyzoo) July 10, 2017
She’s done some follow up observations of some barred galaxies picked out by Galaxy Zoo using radio telescopes! Ionised hydrogen gas emits a very specific wavelength of light in the radio part of the spectrum (21cm) – so if you can detect emission with radio telescopes at these wavelengths it means there is hydrogen gas there to fuel star formation. It took 115 hours total observing time with the VLA and GMRT to get data for just 7 galaxies! The first one she’s reduced the data for is UGC9362 and she’s found that there is a hole in the gas in the centre of the galaxy where the bar is. She thinks that means that since the bar is rotating with the galaxy, it has carved out a hole in the gas as it does so and used up all the gas needed for star formation.
The next question Lucy is trying to answer is if the strength of the spiral arms is affecting the star formation in a galaxy? To quantify the strength of the spiral arms, Lucy is using the Galaxy Zoo classifications – where more people agree that a galaxy has spiral arms the stronger the spiral arms will be! Lucy has now looked at trends in galaxy properties with the strength of the spiral arms showing us a plot that she even made this morning! LIVE SCIENCE EVERYBODY!
Taking the stand now is another PhD student, Sandor Kruk, who will be continuing this barred galaxy theme: “Dealing with bars… and other mess”. He clarifies that when he refers to “mess” he means other morphological features!
There really are a lot of bars in #gzoo10 pic.twitter.com/YsNTevRCaK
— Alice Sheppard (@PenguinGalaxy) July 10, 2017
Again, he’s focussing on this problem of what makes galaxies stop forming stars. Earlier results from Galaxy Zoo that Karen Masters worked on back in 2012 suggested that bars were a likely culprit. Sandor is now following up on this work to split the galaxy light into the separate components: bar, disk and bulge. Looking at the colour of this light will let us know if that part is star forming: red things are old, with little star formation and blue things are young, with recent star formation. To split this light he had to model the light of over 3500 galaxies! That’s a mammoth effort, but it’s paid off because he’s found that there is a difference between the colours of disks in galaxies with and without bars!
Whilst doing all this modelling, along the way he also made a serendipitous discovery: that some of the bars were offset from the centre of the disks. This is weird – it means that perhaps these galaxies have had an interaction with another galaxy which has shifted everything around. Turns out though that some of these objects had already been flagged in talk by the users! Makes us wonder what else is hiding in there that the team hasn’t yet seen!
Interesting @kruksandor‘s offset bars (https://t.co/5IGeHajUmf) were flagged in Talk years ago. What else is hiding? #gzoo10
— chrislintott (@chrislintott) July 10, 2017
Well Sandor reckons we should start with some of the questions of the Galaxy Zoo decision tree that the team haven’t yet had chance to look at. For example, what shape is the bulge of the galaxy – boxy or round? Does the galaxy have a ring? While Sandor has been fitting all of his 3500 galaxies (some barred and some unbarred as a control sample) for his bar study, he’s been getting some ideas for how we can tackle these questions – so watch this space!
So next up is one of the original science team members, Bill Keel! He’s sort of become the curator of the objects in Galaxy Zoo which don’t fit into any of the classifications we ask about on the site. He’ll be telling us specifically about the Voørwerpjes (i.e. ionization echos). The first one was flagged on August 13th 2007 (another 10 year anniversary coming up, mark it in your calendars!) by one of the volunteers who brought an unusual blue smudge below a galaxy to the team’s attention. Bill is now telling us how they figured out that the weird blue smudge near the galaxy turned out to be a gas cloud which had been ionised by emission from the active supermassive black hole in the centre of the nearby galaxy. We can tell this by looking at the spectrum of these objects – where we split the light into its component wavelengths to spot specific elements and molecules.
Few ‘Wow’ moments in my science (mostly hope for ‘Hmm…interesting’) but seeing the Voorwerp spectrum @NGC3314 is showing was one #GZoo10
— chrislintott (@chrislintott) July 10, 2017
After identifying what this first object was, the users then found more! Bill ended up doing follow up observations on 20 of these objects – including 8 followed up with the Hubble Space Telescope. Turns out NGC7252, a galaxy that astronomers have been studying for 30 years, even has one of these ionised clouds!
Lots to find out about astronomically objects like Hanny’s Voorwerp #GZoo10 Magnetic fields probably involved pic.twitter.com/AZ78twTcHU
— Alice Sheppard (@PenguinGalaxy) July 10, 2017
The search continues for more of these objects – including another one flagged by a user in February 2017 in the current data being classified on Galaxy Zoo. So keep a weather eye out people!
Thank you @NGC3314 for thanking the many volunteers (inc me, my one claim to fame) who found Voorwerpjes! #GZoo10
— Alice Sheppard (@PenguinGalaxy) July 10, 2017
We’re now going to open up the conference to discussion – between the team that are here and you following along online! If you’d like to ask a question or make a comment for discussion – either post it here on the blog or on Twitter with #GZoo10.
The discussion so far has covered how we consider more detailed features of a galaxy and how galaxy simulations will tie in with what we do in the future. We’re also starting the discussion of how the Galaxy Zoo site will be restructured in the future as we move to the new Zooniverse web platform – exciting!
Now we’re all off to lunch to fuel ourselves for a long afternoon of discussion and unconferencing! See you all in an hour – until then, keep tweeting!
At the high table #Gzoo10 pic.twitter.com/GbhSOUsrH2
— Carie Cardamone (@cariecardamone) July 10, 2017
Unconference session ideas at #GZoo10 pic.twitter.com/tszcYseWtS
— galaxyzoo (@galaxyzoo) July 10, 2017
We are back! After an afternoon of “un-conferencing” where we all suggest sessions for discussion and schedule them on the fly.
We first talked about what science we’re going to do with your classifications on the infrared images from the UKIDSS sample. We want to compare how the shape of galaxies changes from the optical to the infrared but it gets difficult because galaxies tend to be fainter and smaller in the infrared. A lot of us are keen to study how the number of bars changes from optical wavelengths to infrared wavelengths. There are some studies showing that bars disappear in the infrared, but there are also some that show that bars appear in the infrared where there are none in the optical. One of the Galaxy Zoo PhD students, Mel Galloway, has already had a quick look at this and we discussed where to take this work next! First thing first though – releasing the classifications as a data table to the public.
Our next discussion session was about the future of the Galaxy Zoo classification cite. How are we going to ask the users to classify the galaxies? The current mode is the classification tree that we get users to walk through and answer each question for every galaxy. This is very difficult to analyse at the end of the project though. So we discussed changing the interface to either (i) single binary questions about each galaxy, e.g. Bar or no bar? Smooth or featured? (ii) A survey project similar to the interface for Snapshot Serengeti which presents all the options for a galaxy at once, (iii) Lots of mini projects which are all offshoots of Galaxy Zoo focussing on one specific science question, or (iv) pairwise classification where we show two images of galaxies and ask which is more featured etc. There were many opinions about what the best way of doing this but we’d also love to hear your thoughts!
Later on we had an “alpha” test of a revamped Galaxy Zoo project which is survey style – it took people a while to get used to but people did seem to like it! There was also a lot of feedback but it was good to get the discussion flowing about what classifiers would like and what researchers would need.
There was also a discussion about how to study bars with the classifications from Galaxy Zoo. It’s a little difficult to pick stuff out, especially the weaker bars. One of the ways astronomers tend to find bars (e.g. when Galaxy Zoo classifications don’t exist for their sample!) is to fit light profiles to the disk of galaxies and take that model light off the original image. What you’re left with is called a “residual” – light that you didn’t account for, i.e. light from a bar. So there was a discussion about making an offshoot Zooniverse project classifying the residual light images to find weak bars.
Ross Hart then led a discussion about his new way of debiasing the Galaxy Zoo classifications to take into account the distance to galaxies and the fact that features get lost. He can recover lots more spirals with his new method. The table we link to on the Galaxy Zoo data page now has his debiased data table linked first.
We also had a discussion session about the outreach project Tactile Universe – which is a project engaging the blind community with astronomy. They’ve been 3D printing images of galaxies – the brightness being the third axis! We’d love to be able to make a tactile Galaxy Zoo but we have to wait for the tactile screen technology that we’d need to be able to do it! Looks like we’ve got our first session for our Galaxy Zoo Twentieth Anniversary Conference – watch this space #GZoo20.
#GZoo10 Learning about the Tactile Universe. Wonderful project https://t.co/LN5dAQtGnA pic.twitter.com/uJ4S8louYG
— Alice Sheppard (@PenguinGalaxy) July 10, 2017
Now we’ve finished up with the discussion all about the science, we get a treat at the end of the day! Our reward is that our very own Grant Miller has come to tell us all Tales From the Zooniverse! He’s telling us all about his first day on the job in the Zooniverse and how he realised it was going to be a great job when he went into his first meeting all about penguins with the Zooniverse’s Tom Hart! He is now showcasing how amazing the Zooniverse project builder is and is currently trying to build the original Galaxy Zoo project with it in under 3 minutes! And I can tell you: Reader, he managed it! He’s now telling us about his top picks for the Top 10 Zooniverse projects you’ve never heard of:
10) Monopole Quest
9) Expert Smooth/Not
8) Letters to Ryan
7) Bash The Bug
6) Faces of the World
5) The Planetary Response Network
4) Beluga Bits
3) Supernova Hunters
2) Family Certificates
1) Grant can’t name the top one! There’s so many on there now that Grant doesn’t know all of the projects on there (he used to know all the researchers of the projects but not anymore!) – 4700 new projects created since the project builder was launched. 47 of these have been fully launched as new projects, with 31 awaiting launch now.
His take home point: a LOT can happen in ten years!
Galaxy Zoo’s 10th Anniversary

Galaxy Zoo is celebrating ten years since launch next month, and as part of the festivities the science team are having a meeting in Oxford from 10th-12th July. Unfortunately we didn’t think it was feasible to invite the hundreds of thousands of you from all over the world who have contributed to the project over the last ten years, but the good news is that all of the talks from the meeting will be interactively live-streamed so that anyone can join in the discussion! See the schedule above for details on who is speaking at the meeting. Details of how to join the live stream will be released closer to the event.
There will also be an Oxford SciBar public event on the Monday night. All who are able to make it are welcome to join but don’t worry if you can’t, there will be a full podcast of the evening released shortly after the event!
Introducing the 100th Zooniverse Project: Galaxy Nurseries
It is my pleasure to announce the launch of a brand new Zooniverse project: Galaxy Nurseries. By taking part in this project, volunteers will help us measure the distances of thousands of galaxies, using their spectra. Before I tell you more about the new project and the fascinating science that you will be helping with, I have an announcement to make. Galaxy Nurseries is actually the 100th Zooniverse project, and we’re launching it in the year that Galaxy Zoo (the project that started the Zooniverse phenomenon) celebrates its 10 year anniversary. We can’t think of a better birthday present than a brand new galaxy project!
To celebrate these watersheds in the histories of the Zooniverse and Galaxy Zoo, we’re issuing a special challenge. Can you complete Galaxy Nurseries – the 100th Zooniverse project – in just 100 hours? We think you can do it. Prove us right!
Back to the science! What is Galaxy Nurseries? The main goal of this new project is to discover thousands of new baby galaxies in the distant Universe, using the light they emitted when the Universe was only half of its current age. Accurately measuring the distances to these galaxies is crucial, but this is not an easy task! To measure distances, images are not sufficient, and we need to analyze galaxy spectra. A spectrum is produced by decomposing the light that enters a telescope camera into its many different colors (or wavelengths). This is similar to the way that water droplets split white light into the beautiful colors of a rainbow after a storm.
The data that we use in this project come from the WISP survey. The “WISP” part stands for WFC3 IR Spectroscopic Parallel. This project uses the Wide Field Camera 3 carried by the Hubble Space Telescope to capture both images and spectra of hundreds of regions in the sky. These data allow us to find new galaxies (from the images) and simultaneously measure their distances (using the spectra).
This animation shows how a galaxy’s white light going through a prism gets decomposed into all its colors. Like the rainbow! The figure shows how the different colors end up in different positions. In this example violet/blue toward the bottom, orange/red toward the top. At each color, we have an image of the galaxy. When we sum the intensity at any given color, we obtained the spectrum to the right.
How do we do that? We need to identify features called “emission lines” in galaxy spectra. Emission lines appear as peaks in the spectrum and are produced when the presence of certain atomic elements in a galaxy (for example oxygen, or hydrogen), cause it to emit light much more strongly at a specific wavelength. The laws of physics tell us the exact wavelengths at which specific elements produce emission lines. We can use that information to tell how fast the galaxy is moving away from us by comparing the color of the emission line we actually measure with the color we know it had when it was produced. In the same way that the Doppler effect changes the apparent pitch of an ambulance’s siren as it approaches or recedes, the apparent color of an emission line depends on the speed of the galaxy that produced it. Then, we can relate the speed of the receding galaxy to how far it is from us through Edwin Hubble’s famous law.
The real trick is finding the emission line features in the galaxy spectra. Like many modern scientific experiments, we have written computer code that tries to identify these lines for us, but because our automatic line finder is only a machine, the code produces many bogus detections. It turns out that the visual processing power and critical thinking that human beings bring to bear is ideally suited for filtering out these bogus detections. By helping us to spot and eliminate the false positives, you will help us find galaxies that are some of the youngest and smallest that have ever been discovered. In addition, we can use your classifications to create a next-generation galaxy and line detection algorithm that is much less susceptible to being fooled and generating spurious detections. All your work will also be very valuable for the new NASA WFIRST telescope and for the ESA/NASA Euclid mission, which both will be launched in the coming decade.
Emission lines in a galaxy’s spectrum can tell us about much more than “just” its distance. For example, the presence of hydrogen and oxygen lines tells us that the galaxy contains very young, newborn stars. Only these stars are hot enough to warm the surrounding gas to sufficiently high temperatures that some of these lines appear. By examining emission lines we can also learn what kind of elements were already present and in what relative proportions. We too are “star-stuff”, and by looking at these young galaxies we are following the earliest formation of the elements that make all of us.

The horizontal rainbows show the spectra for the three objects on the left. The bottom, very compact object is a star in our own Milky Way. The other two objects are an interacting pair of young galaxies, observed as they were 7 billion years ago! We can say this because we see an emission line from hydrogen in both galaxies (indicated with arrows). This emission line allows us to measure the galaxies’ distances.
How do spiral arms affect star-formation?
Hi everyone! For those unaware, I am a PhD student at the University of Nottingham looking at spiral galaxies in Galaxy Zoo (for an overview, see this blog post). Following the release of my first refereed publication last year, my second refereed publication has now been accepted (woohoo!). As can be seen from my previous post (found here), we found remarkable differences between the spiral galaxies that we observe in the local Universe, simply by comparing galaxies with different numbers of spiral arms. Galaxies with two spiral arms are distinctly redder in colour than many-armed galaxies. However, the exact reasons for these differences was still up for debate. Red galaxies could have very low star-formation rates, or contain a significant amount of dust, blocking the escaping blue light.

The IRX-beta relation for galaxies with different numbers of spiral arms. A higher IRX value means more light is absorbed by dust: two-armed galaxies are more heavily dust-obscured.
With this in mind, we decided to follow-up that paper with panchromatic data from UV and infra-red wavelengths. UV wavelengths bluer than optical probe the very youngest stars, and infra-red wavelengths redder than optical measure dust emission directly. Combining these measurements allowed us to show the following things:
- Star-formation rate does not depend on spiral arm number: all spiral galaxies seem to be forming the same number of stars, regardless of what their spiral arms look like.
- The amount of blue light being absorbed by dust is significantly greater in two-armed spiral galaxies.
These two striking results have now shown us that spiral arms are not simply a visual pattern. They act to change the conditions of star-formation in local galaxies, making them much more sensitive to dust. Interested readers can find the full paper here.
See you in Hull
As part of the celebrations of Galaxy Zoo’s tenth birthday (!), we’ll be hosting sessions at the UK’s National Astronomy Meeting in Hull.

I’ll be giving a public talk on Monday 3rd July – ticket details coming shortly. Then on the 4th and 5th July there will be scientific sessions on the theme of Modern Morphologies: 10 years of Galaxy Zoo.
The session abstract is as follows:
As our community has developed increasingly sophisticated techniques to analyse the data in large galaxy surveys, we have seen a resurgence of interest in galaxy morphology. Clues to a galaxy’s formation and evolution are recorded in its morphology, and we are now seeing growing evidence that its evolution may also be affected by its internal structures. This session, marking the 10th anniversary of Galaxy Zoo, will discuss results from the use of morphological markers including the effects of bars, bulges and disks.
and researchers are welcome to submit via the abstract form. Though this is part of the formal scientific conference, we’ll make sure our worldwide community are included in what’s going on.
Watch this space for more Galaxy Zoo birthday news shortly.
Introducing Galaxy Zoo “3D”, aka “Why are SDSS galaxies back?”
I’m delighted to announce the launch of “Galaxy Zoo: 3D” today – this is a small project from a subset of the Galaxy Zoo team where we ask you to help us identify in detail the locations of internal structures seen in a sample of about 30,000 galaxies.
What’s special about these galaxies is that they have been selected to potentially be observed (or in some cases have already been observed) by the “MaNGA” project.
MaNGA (which stands for “Mapping Nearby Galaxies at Apache Point Observatory” – sorry about that!), is a spectroscopic mapping survey that I have been working with for the last several years. This one of the current surveys which form part of the 4th generation of Sloan Digital Sky Surveys.
SDSS retired its camera in 2012 (its in the basement of the Smithsonian Museum in Washington, D.C!), and is now focusing on measuring spectra of things in space. Instead of taking images of galaxies in just a couple of filters, MaNGA takes spectral images – each of up to hundreds of points in the galaxy has a full spectrum measured, which means we can decode the types of stars and gas found in that part of the galaxy. We can also recover the motions of the stars and gas in the galaxy making use of the Doppler shift (the redshift or blue shift we see in light which comes from moving sources).

An illustration of the type of data MaNGA is taking. You get an image of the galaxy at each wavelength slice (e.g. the green one shown), or a spectrum at any point. You can also combine all the light into a single image. The resolution (sharpness) is poorer than using a camera, but you get a lot more information. Illustration credit: CubeVisualisation
MaNGA will ultimately do this for about 10,000 of the total list (this is how many we can manage in 6 years of operations), and since 2015 has already measured these data for a bit more than 3000 galaxies. To help us interpret this vast quantity of data we’re asking you to draw on the galaxies to mark the locations of spiral arms and bars. We also want to double check the galaxy centres are recorded correctly, and that we have found all the foreground stars which might be getting in the way of the galaxy.
Now one thing you know all about as Galaxy Zoo volunteers is the benefit of human eyes on large samples of galaxies. When we first launched Galaxy Zoo we made use of the “Main Galaxy Sample” from the Sloan Digital Sky Survey as the input list of galaxies. This is a sample of 1 million galaxies automatically identified from the SDSS images, and which had their distances (redshifts) measured in SDSS-I/II. However (perhaps ironically) the algorithm which selected this sample wasn’t very good at finding the biggest most nearby galaxies. Specifically it tended to “shred” them into what it thought were multiple galaxies. My favourite demonstration of this is the Pinwheel galaxy (M101), which the first SDSS galaxy detection algorithm interpreted as a cluster of galaxies.

M101 as seen by the original SDSS galaxy finding algorithm – each red box was thought to be a separate galaxy. Image from Brichman et al. 2013.
(Don’t worry – ever resourceful, astronomers have made plenty of use of these galaxies which have multiple spectra measured – it turns out to be really useful).
By the time MaNGA came along this problem was well known, and instead of making use of the standard SDSS galaxy catalogues, MaNGA targeted nearby galaxies by making use of the “NASA Sloan Atlas“- a NASA funded project to make a more careful list of nearby bright galaxies in the SDSS images.
So what we discovered when putting together the sample for Galaxy Zoo: 3D is that not all MaNGA galaxies have Galaxy Zoo classifications. In fact about 10% are missing, and we also found some more galaxies we missed first time round. It turns out that by relying on automatic galaxy finding there were a quite a few galaxies which had been missed before.
So these are back in the main site right now.
In Galaxy Zoo: 3D we will only ask you to draw spiral arms on galaxies you have previously said have spiral arms, so we’ll be making use of the new classifications to sort out the last 10% of MaNGA galaxies. We’ll also create a complete Galaxy Zoo classification list for the MaNGA sample, which will be really useful for people working with that sample.
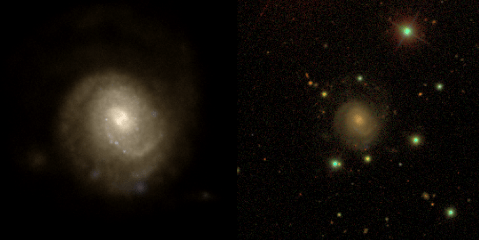
To tempt you to give it a go, here are some interesting and beautiful MaNGA galaxies being discussed in Talk by our beta testers (the purple hexagon indicates the part of the galaxy where MaNGA can measure spectra). More than half of all the galaxies in MaNGA them are nearby galaxies with lots of structure. I think you’re really going to enjoy exploring them, and at the same time really help us learn a lot about galaxies.


FERENGI complete + new Illustris images!
Hi everyone, it’s Mel and Hugh from Minnesota, and we (especially Mel) would like to give a big THANK YOU for all of your help classifying these last couple of months! When we originally launched the second Ferengi set , it was estimated that it would take four months for the data to be complete, based on the current classification rates. Thanks to your help, that time was cut in half, and Mel’s thesis is officially saved! (Stay tuned this Spring for updates on how Mel is using these classifications to study morphological transformations of Hubble galaxies from 6 billion years ago to today.)
Now that those are complete, we have another announcement…
Illustris is back!
This week Galaxy Zoo volunteers may notice the appearance of simulated galaxy images produced by the Illustris project.
Illustris is one of several large-scale cosmological simulations that play a key role in helping us to understand how galaxies formed and how the Universe and its contents have evolved throughout cosmic history.
To learn more about Illustris, check out this previous blog post or the main Illustris project website.
An Illustris galaxy – on the left is the original image from the simulation, on the right is the galaxy “Sloanified” with realistic colors and dropping it onto a real SDSS background.
New images for Galaxy Zoo from GAMA-KiDS!
Hello Zooniverse citizen scientists! We’re extremely excited to announce the release of a new dataset on Galaxy Zoo. For the past several months we’ve been working with scientific collaborators from the Galaxy And Mass Assembly Survey and the VST Kilo-Degree Survey. This blog post will give you a few details about these surveys, the new data set, and what we hope to achieve with Galaxy Zoo classifications.
![]()
The Galaxy And Mass Assembly (GAMA) Survey is an international project to exploit the latest generation of ground and space-based survey facilities. Its aim is to study cosmology and galaxy formation and evolution from scales of thousands up to millions of light years across. The science goals include furthering our understanding of how the mass of stars within galaxies builds up over time, how and when do galaxies form their stars, how are those previous questions related to a galaxy’s environment, and at what epoch did star-formation and mass-build-up dominate? Visual morphologies from Galaxy Zoo will allow us to explore if, how, when, and where galaxies transition from one type into another, what impact this has on the formation of stars, and to look for new types of unique and interesting galaxies.

The observations are from the Kilo-Degree Survey (KiDS) on the 2.6m VLT Survey Telescope (VST) located at the ESO Paranal Observatory in Chile. KiDS is a large optical imaging survey in the Southern sky designed to tackle some of the most fundamental questions of cosmology and galaxy formation of today. At the heart of KiDS lies the 300 million pixel camera OmegaCAM. Its instantaneous field of view is a full square degree and it was designed to provide extremely accurate measurements of the intrinsic shapes of faint, small galaxies.

The 2.6m VLT Survey Telescope (VST), located at the ESO Paranal Observatory in Chile, is carrying out observations for the Kilo-Degree Survey (KiDS).
The scientific teams behind GAMA and KiDS have been working closely to put together this new set of images. Galaxies have been selected from a catalogue produced by the GAMA Survey and images have been constructed based on observations from KiDS. While some of these galaxies have already been looked at by Galaxy Zoo citizen scientists before using their Sloan Digital Sky Survey (SDSS) images, the improvement in the resolution and depth of KiDS images over SDSS imaging is remarkable. With this new GAMA-KiDS data set we hope to be able to study the very faintest structures within galaxies, as well as more accurately classify features which may have been missed before. Take a look at the image below to see how much clearer the new images are!

This image compares SDSS images (on the left) with those from GAMA-KiDS (right) for three example galaxies: G107214, G298570 and G551505. Our new images reveal a lot more detail!
We’re really excited about getting classifications for these new images, and we hope you are too! We’re more than happy to talk about any interesting galaxies you may come across and to answer any questions you may have. Until then, enjoy, and thank you for your help!
– by Dr Lee Kelvin, on behalf of the GAMA and KiDS teams
RGZ Team Spotlight: James Ansell
Hi everyone! I’m James and I’ve joined the RGZ team as a Communication/Engagement intern. I’m a PhD Candidate at the Australian National Centre for the Public Awareness of Science (CPAS) which is part of the Australian National University (ANU). I’m also a Sessional Academic (read: Tutor and marker) for a couple undergraduate courses covering things from ‘the Public Awareness of Science’ to ‘Science, Risk and Ethics’. And to pay the bills I work for the ANU in an administration role at (essentially) the Business School as well as a few other odd jobs.
But I am at heart an errant astronomer – having double majored in Astronomy/Astrophysics and Science Communications at the ANU for my B.Sci, graduating with Honours in 2015. I grew up in Alice Springs in the middle of Australia and had a purely spectacular night sky to look at. Something I only appreciated when I lived Brazil after graduating high school.
As part of my undergraduate studies I did dabbled a bit in some astronomy research. Firstly I did a project with Dr Charley Lineweaver (if you don’t know Charley, you should!) looking at the (surprisingly fuzzy) distinctions we make between objects in space e.g. planet, dwarf-planet, asteroid, moon. Let’s just say the project didn’t go where I thought it would.
Secondly, as part of an Astronomy Winter School I did research looking for ‘intergalactic stellar bridges’. Essentially chains of stars going from one galaxy to another which may have played a role in stellar formation in galaxies. I think. It was several years ago and the weather was against us when we went to do observations, so it didn’t go anywhere and my memory is pretty fuzzy on the details.
Outside of academia, I was involved in the ANU Black Hole Society (the Astronomy Club), the ANU Physics Society and the Science Communication Society. Also I absolutely love the TV series Cosmos, both the Carl Sagan original which I saw as a teenager and then the Neil deGrasse Tyson remake from a few years ago.
Since my astronomy research didn’t turn out particularly well, I ended up going down the science communication route. I’ve since done research looking into the effects of fictional doctors on young people’s perceptions of healthcare, factors affecting the uptake of vaccinations in Australia and the relationship between people’s perceptions of ‘Superfoods’ and their health behaviours. But I do miss the Astronomy and Astrophysics side of things so I’m super excited to be able to combine my two interests as part of the Radio Galaxy Zoo team.
(Also for some random fun facts about me – I used to host a music program on a Canberra community radio station, I founded the Canberra pop-culture festival ‘GAMMA.CON’ which is basically our local Comic-Con and I fly Hot Air Balloons with the ACT branch of the Scout Association.)
I’ll be hanging around in the forums under the name ‘JRAnsell’ and am keen to hear from you – if you’ve got questions about RGZ specifically or astronomy more broadly let me know! You can also hit me up on Twitter @radiogalaxyzoo or at radiogalaxyzoo@gmail.com.
Galaxy Zoo relatives at AAS meeting – Hubble does overlapping galaxies
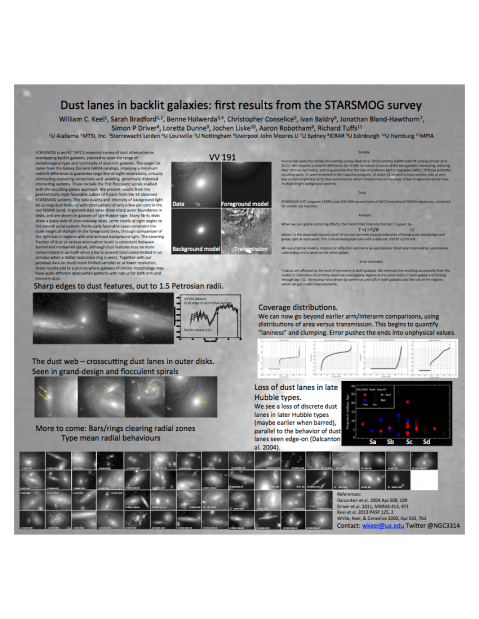
Among the results being presented at this week’s meeting of the American Astronomical Society in Texas (near Dallas) is this poster presentation on the status of the STARSMOG project. This program, a “snapshot” survey using the Hubble Space Telescope, selected targets from a list of overlapping galaxy pairs with spiral members and very different redshifts, so they are not interacting with each there and likely to be more symmetric. The source list includes pairs from Galaxy Zoo (about 60%) and the GAMA (Galaxy And Mass Assembly) survey. These data will allow very extensive analysis; this presentation reads more like a movie trailer in comparison, highlighting only a few results (primarily from the master’s thesis work by Sarah Bradford).
Among the highlights are:
Sharp outer edges to the location of dust lanes in spiral disks.
Distinct dust lanes disappearing for galaxies “late” in the Hubble sequence (Scd-Sd-Sdm-Sm, for those keeping track), maybe happening earlier in the sequence when there is a bar.
The dust web – in the outer disks of some spirals, we see not only dust lanes following the spiral pattern, but additional lanes cutting almost perpendicular to them. This is not completely new, but we can measure the dust more accurately with backlighting where the galaxy’s own light does not dilute its effects.
A first look at the fraction of area in the backlit regions with various levels of transmitted light. This goes beyond our earlier arm/interam distinction to provide a more rigorous description of the dust distributions.
Bars and rings sweeping adjacent disk regions nearly free of dust (didn’t have room for a separate image on that, although the whole sample is shown in tiny versions across the bottom)
Here is a PNG of the poster. It doesn’t do the images justice, but the text is (just) legible.
