
“Blue stuff” in the Illustris galaxy images
I think the most common question/comment we’ve been seeing for classifiers of the simulated Illustris galaxies is along the lines of: “What’s the blue stuff?”
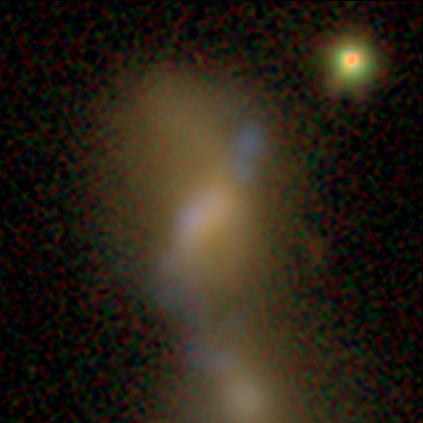
Image of a synthetic galaxy (AGZ00089n5) from the Illustris simulation, being classified in Galaxy Zoo. Blue-ish emission can be seen extending from the lower left to upper right of the center galaxy.
It’s a great question. Let’s talk about it in more detail.
The short answer is that the blue regions are the simulations’ method of reproducing the light emitted by young stars. A star’s lifetime generally scales as a function of its mass – the more massive the star is when it’s first formed, the hotter it is and the faster it burns fuel. Emission from hotter objects will tend to be bluer (ie, produce more photons at shorter wavelengths) compared to less massive stars. These are trends we see in optical images of stars in galaxies, including naked-eye views and composite color images. The exact color depends on the filters being used as well as processing of the images – that’s the difference between images you may have seen of star-forming regions being pink in some images and blue in others, such as those in Illustris.
A couple more specific questions that we’ve received:
What’s causing the blue colors in the galaxies? Are they caused by individual atomic or molecular lines that we can see in the spectra?
Volunteers who worked on the original GZ green peas project might be familiar with the term “nebular emission” – individual, narrow lines caused by ionized or hot gas surrounding stars, or whether they’re the result of the broadband colors of the stars themselves. The GZ-Illustris images use a stellar population model that only computes the broadband colors, due to some issues with unrealistic green images caused by the interaction of the codes that deal with both the emission lines and effects of dust. The model we’re using – based on work by Bruzual & Charlot (2003) – omits the emission lines for that reason. However, we’ve made extensive comparisons of the two sets of images and find that they agree very well for our scientific goals, including the morphology classifications.

A plot of the synthetic spectra for galaxies in the Illustris simulation; each thin horizontal line is the spectrum of an individual galaxy. The most massive galaxies are at the top, while the lowest mass galaxies are at the bottom. Wavelength increases from left to right, or going from bluer to redder colors. The lack of sharp features in this plot (which uses the BC03 model adopted by the Galaxy Zoo images) are a result of excluding the nebular line emission. Figure courtesy P. Torrey (MIT/Caltech).
How should visual morphology classifiers deal with the star-forming regions? Ignore them and look at the underlying stellar populations? Treat them as part of the galaxy? Something else?
This is a tough one. Many galaxies have the “blobby” star-forming regions but others have nicer looking disk or spiral distributions. Our analysis suggests is that this is a pretty tight function of the total star formation rate (higher SFR = more realistic looking features). We suggest that users treat them as part of the galaxy; it might lead to some odd results in lower mass galaxies, but we expect they should trace each other very well for the more massive galaxies. If you see geometry that’s distinctly different from a well-formed spiral disk or elliptical, don’t be hesitant to click the “Anything Odd” or “Other” buttons – that’s one of the simplest ways in which we can measure the unusual effects of the blue regions, given the constraints of our classification scheme.
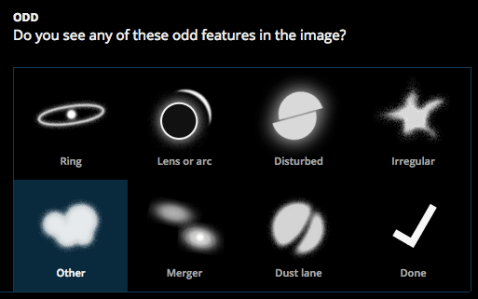
One option for measuring the effect of the blue blobs is to select “Other” under the “Anything Odd” question.
The distribution of the blue blobs is often disconnected and/or in unusual shapes compared to Sloan. What determines the spatial distribution of the star forming regions?
This results from the extremely discrete sampling of the density of stars in the images. Stars can only form in “chunks” of about 1 million solar masses, instead of the more typical small clusters and regions that we know exist in the real Universe. Moreover, these chunks have their light spread over a significant fraction of ~1 kpc (which is pretty big, compared to a typical galaxy radius of ~20 kpc), and so they often won’t look much like real star-forming regions. This, coupled with the lack of dust, leads to what you see in the GZ images.
Thanks as always to everyone for your help. Please post here or on Talk if you have more questions!
This post was written with the help of researchers Gregory Snyder (Space Telescope Science Institute) and Paul Torrey (MIT/Caltech), who worked extensively on the development of Illustris and the generation of the mock images for Galaxy Zoo.
Searching for “tidal debris” in DECaLS images
This post was written with the help of Sugata Kaviraj, senior lecturer at the University of Hertfordshire in the UK. Sugata has been a member of the GZ science team for several years and is leading our analysis of tidal debris in the DECaLS images.
One of the biggest changes to the questions we’re asking for the new DECaLS images asks users to help us classify galaxies that are either merging and/or exhibiting “tidal debris”. While mergers have been part of Galaxy Zoo since our very first classifications, tidal debris is looking for something more specific, which the new DECaLS data is particularly suited for.
In astronomy, “tides” are a type of force exerted on an object by the effect of gravity. Specifically, it refers to the gravitational force exerted by one body on another – since the force exerted by gravity depends on the distance to the object (specifically, it’s proportional to the inverse square of the distance), the nearer side of the object will feel a stronger force than the farther side of the object. On Earth, the differential force caused (mostly) by the gravity of our Moon acts on the liquid in the oceans, causing the rise and fall in sea levels each day.

Example of how a solid body can be deformed under tidal forces. (“Field tidal” by Krishnavedala. Licensed under CC BY-SA 3.0 via Commons.)
When the object is a solid body (like a planet or moon), tidal forces can strain and compress the body, resulting in internal heat and sometimes driving geological activity. A galaxy isn’t a solid body, but composed of individual stars/gas clouds/dark matter particles bound within its own gravitational field. When a galaxy is subjected to tidal forces, it pulls the galaxy apart, causing irregularities in shape that can take many forms depending on the magnitude and direction of the forces involved.
One of the main reasons we want to identify tidal features specifically is to make better measurements of the merger history of galaxies. A complication is that the event of merging with a galaxy isn’t an instantaneous event – depending on the relative masses, velocities, and orientations of the merging galaxies, tidal forces strip out long tails of stars and gas from the galactic centers.

The Mice (NGC 4676): colliding galaxies with tails of stars and gas distorted by tidal forces. Source: Hubblesite.org
Ultimately, the nuclei of the two galaxies will fully merge; if that happened sufficiently far in the past for the orbits of stars to relax, then it’s difficult for observers to determine if an elliptical galaxy today was the result of a merger.
Tidal debris features, however, are longer-lived signals of a merger sometime in a galaxy’s past. If we only asked about mergers, we’d be restricting the sample to galaxies that we’re lucky enough to observe “right in the act” of merging. By identifying the tidal debris as well, we can make a more complete census of galaxies that had a merger at some point in their past. One project that this is critical for is looking at the history of galaxy populations, and trying to figure out whether star formation and/or active black holes might be powered by merger events.
Since tidal debris features can be very faint (ie, having low surface brightnesses), the deeper DECaLS images that we’re currently classifying are much better at picking out these features than SDSS. That’s the main reason we’re focusing on trying to detect them in the current set of images.
Tidal debris can come in many different forms, including extended light, faint shells, dust lanes, or satellites in the process of being assimilated to clearly distorted galaxies which have presumably have had a recent interaction. The features can definitely be faint, but we’d like to ask that when you reach this question, please take a careful second look at the area around the main galaxy and see if you can spot anything. Examples are also available in the help text, and we hope that you’ll discuss features you’re not certain about with the moderators, scientists, and other volunteers in Talk.
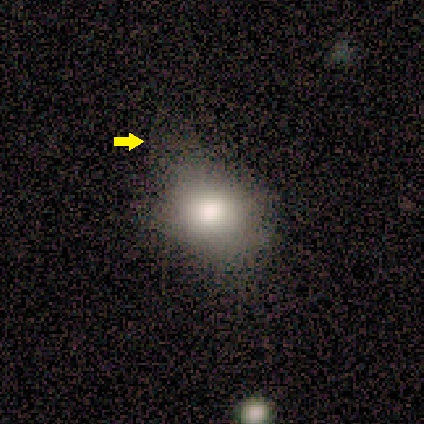
Example 1. Faint tidal debris extension is visible to the upper left of the main galaxy. Image courtesy DECaLS/Galaxy Zoo.
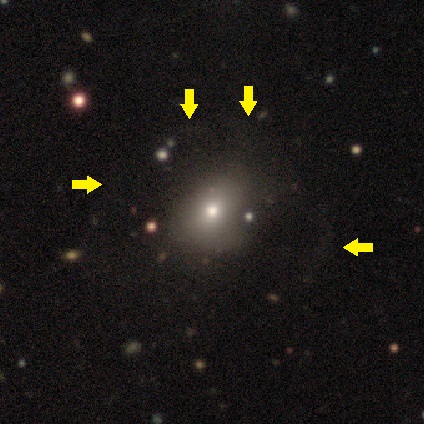
Example 2. Faint tidal debris is visible around the main galaxy in a shell-like shape (see arrows). Image courtesy DECaLS/Galaxy Zoo.
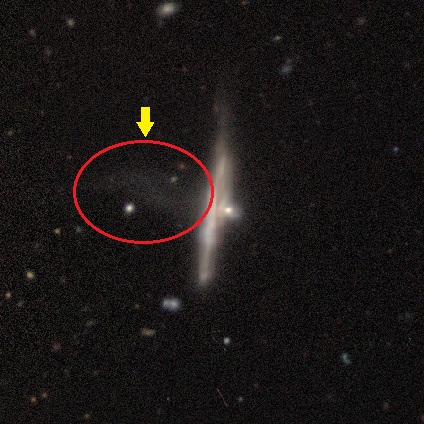
Example 3. Faint tidal debris extension is visible to the left of the main galaxy (within red ellipse). Image courtesy DECaLS/Galaxy Zoo.
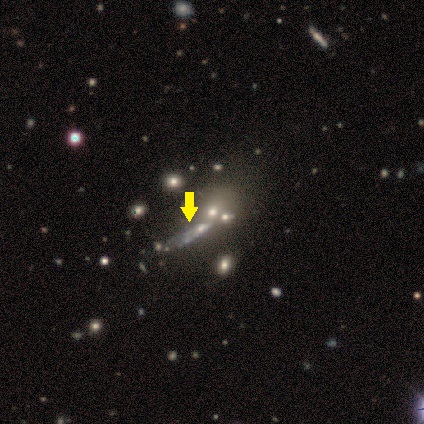
Example 4. A small satellite galaxy is merging into the larger one at the center, being ripped apart and causing tidal debris. Image courtesy DECaLS/Galaxy Zoo.

Example 5. Tidal debris (within the red outline) extending to the top and left of the main galaxy. Image courtesy DECaLS/Galaxy Zoo.

Example 6. Faint tidal debris in a “shell” structure, extending in several directions from the main galaxy (comparable to Example 3). Image courtesy DECaLS/Galaxy Zoo.
Please let us know, here or on Talk, what questions you have. Thanks for your help in tackling a new and interesting scientific problem.
