
Announcing: Jan 13 press conference on Galaxy Zoo: Clump Scout results
I’m Nico, a PhD student with the Galaxy Zoo team, and I have an exciting announcement. About a year ago I wrote that classifications on the Galaxy Zoo: Clump Scout project had just finished. Now, with the first results nearing publication, the American Astronomical Society (AAS) has chosen Clump Scout to present its findings at an official press conference on Thursday, January 13 from 4:15-5:15pm Eastern Time (or 9:15-10:15pm GMT for our UK visitors). We’re very excited to finally share these results with our volunteers!
The press conference is free and open to all, so if you took part in the project, we encourage you to tune in to learn more about where your efforts have gone. (Or, if you’ve never heard of the Clump Scout project before, now is a great chance to learn!) I’ll spend a few minutes explaining why we created the project, and describe a few clues we’ve found as to the last 10 billion years of galaxy evolution. There will also be 4 other speakers presenting about their own citizen science work, so it will be a thorough tour of what’s going on in people-powered astronomy today.
We hope you can join us!
How to join:
You watch via YouTube live stream on AAS’s YouTube channel: https://www.youtube.com/c/AASPressOffice
PS. For more galaxies at the AAS (although not Galaxy Zoo directly), also see our PI Karen Masters talking about the completion of the MaNGA Galaxy Survey, Tue 11th Jan in the 2.15pm ET Press Conference. MaNGA the survey Galaxy Zoo: 3D was designed to help analyse; and look out for more crowd-sourcing projects to come from this complex data now it’s all publicly available, as well as much more use of the Galaxy Zoo: 3D classifications.
Clump Scout wrap-up: What are we doing with your 2.7 million clicks?
Hi all. My name is Nico Adams from the Galaxy Zoo science team.
Writing my first scientific paper has been equal parts exhausting and exhilarating. On Thursday, February 11, I got to put a tally in the “exhilarating” column. The paper is on the first scientific results covering the Galaxy Zoo: Clump Scout project, and I was putting the final touches on my first draft when I saw that you all had submitted the project’s final classifications. The Clump Scout project had a lofty goal — to search for large star-forming regions in over 50,000 galaxies from the Sloan Digital Sky Survey — and the fact that the Clump Scout volunteers have managed to finish it is an incredible achievement.
We’re looking forward to sharing our results over the next few months. Clump Scout is not only the first citizen science project to search giant clumps in galaxies, but it’s the first large-scale project of any kind to look for clumps in the “local” universe (out to redshift ~0.1, or within a billion-or-so light-years of us). The data set presented by this project is incredibly unique, and we are nearly finished with our first round of analysis on it.
We’re currently preparing two papers that will cover the results directly. One is focused on the algorithm that turned volunteers’ clicks into “clump locations”, while the other — my first paper — is focused on the clump catalog and scientific results we derived from it. While these papers go through a few months of revision and review, we wanted to publish a few blog posts previewing the results. This blog post will focus on the first one: We’ll explain what happened to your clicks after you sent them to us. Clump Scout could not have happened without our volunteers, and we thank you immensely for your support.
When we designed Clump Scout, we knew from the outset that we wanted classifications to be as simple as possible. The original plan was to have volunteers click on any clumps they saw, then immediately move on. While the final design was a bit more complex (a few different types of marks were available) that basic design — mark the clumps, then move on — was still present.
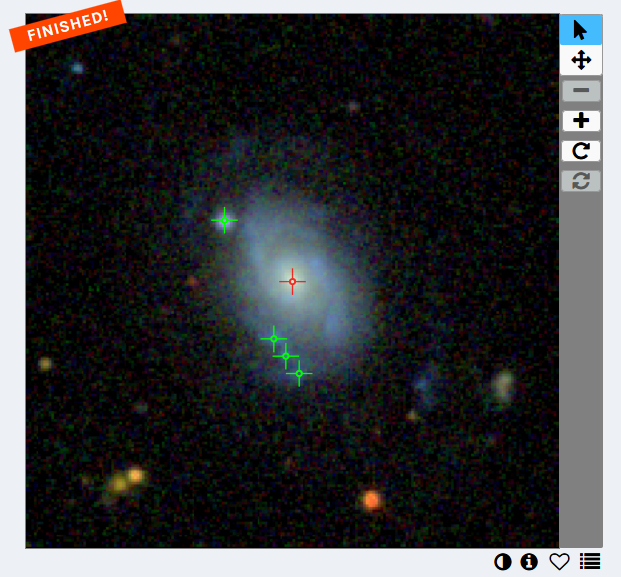
The classification interface after a volunteer submits their clump locations usually looks something like this:
By comparison, the “science dataset” — which consists of 20 volunteers’ classifications all laid on top of each other — looks more like this:
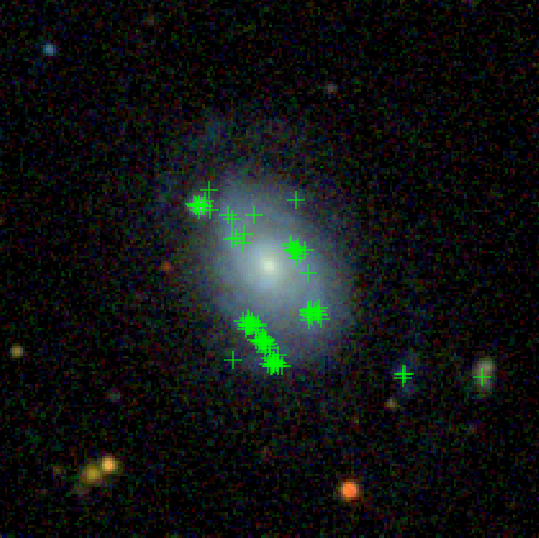
Just by glancing at this image, it’s clear that there are a few “hot spots” where clumps have been identified. However, correctly identifying these hot spots in every image can be EXTREMELY tricky to get right. The software that deals with this problem is called the “aggregator”, and it has to strike a balance between identifying as many clumps as possible and filtering out the isolated marks in the image.
The standard way of solving this problem in computer science is to use a “clustering algorithm”. Clustering algorithms are a very broad class of techniques used to identify clusters of points in space, and most of them are very simple to implement and run. Below, you can see the results of one clustering algorithm — called the “mean shift” algorithm — in practice.
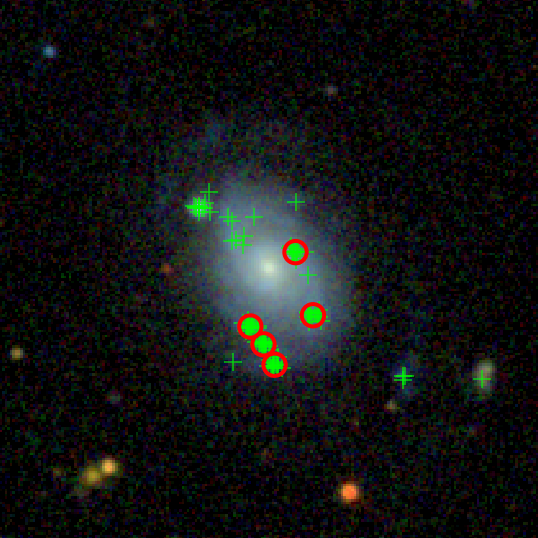
Most clumps have been spotted correctly, and the results look good! However, it took quite a bit of fine-tuning and filtering to get the results to look like this. In the image above, the “bandwidth” parameter — the approximate “size” of each cluster — is about equal to the resolution of the image. Increasing the bandwidth can make the algorithm identify more clumps by grouping together clusters of points that are more diffuse. Unfortunately, the larger bandwidth also increases the likelihood that two or more “real” clumps will mistakenly be grouped into one. Here are the clusters we get when the bandwidth is twice as large:
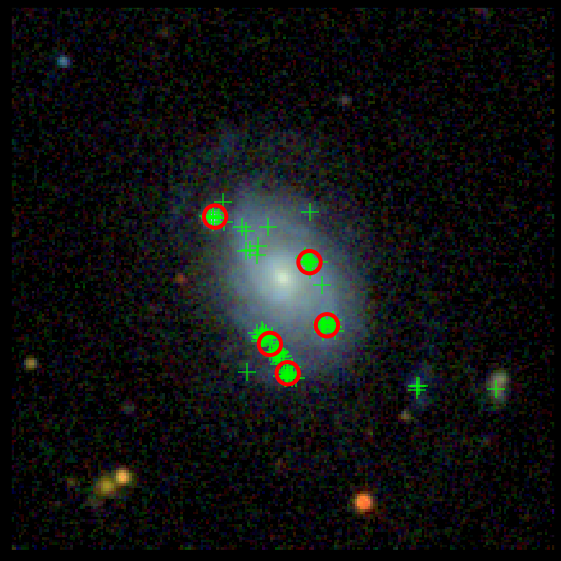
Now that we’ve allowed clusters to be more spread-out, we’ve picked up on the cluster in the upper left. But, the three distinct clumps at the bottom edge of this galaxy have melded into just two, which is not what we want! This is just one of the parameters that we needed to tune. Another is the number of marks required to call a cluster a “clump”. Require too many, and you ignore valuable objects that we’re interested in. Require too few, and the algorithm picks up on objects that are really just noise.
How do we solve this problem? One thing that we tried was to have three members of the science team to classify 1,000 galaxies, so that we could see how their classifications agreed with each other and with volunteers’ marks. We found that when 2 out of 3 members of the science team identified a clump, a majority of volunteers identified it as well. This was a good sign, and it told us about how many volunteer marks to expect per clump. In general, if 60% of volunteers leave a mark within a few pixels of the same spot, we consider that spot to be a clump.
Another technique that we used was more radical. While we started out using the simple clustering algorithm we’ve described so far, we found that it was much more effective to account for who was leaving each mark. Every volunteer is an individual person, with their own clump-classifying habits. Some volunteers are very conservative and only click on a clump when they’re completely certain; others are optimists who want to make sure that no faint clumps get missed. Sometimes volunteers make genuine mistakes and believe it or not we even get a few spammers who just click all over the image! We wanted to design an aggregation system that would make best use of all volunteers’ skills and talents (and if possible even the spammers!) to help us find as many real clumps as possible, without accidentally including any other objects that can masquerade as clumps.
To build our aggregation system, we started with an idea that was first proposed by Branson et al (2017). At its core, our system still uses a type of clustering algorithm, called a facility location algorithm. The facility location algorithm builds clusters of volunteer clicks that have a very specific connectivity pattern, which looks like this.
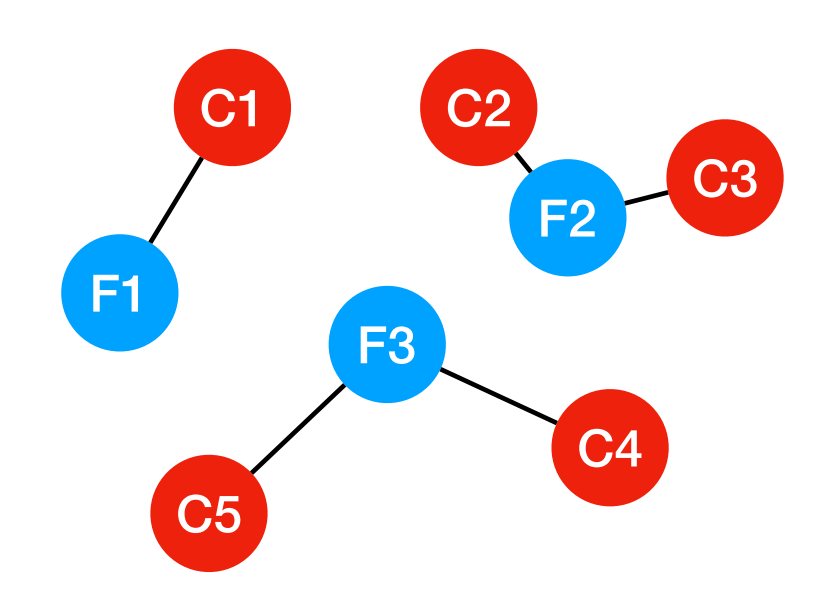
Each cluster contains a central node, referred to as a “facility”, which is connected to one or more other nodes, referred to as “cities”. Facility location algorithms get their name because they are often used to minimise the cost of distributing some essential commodity like electricity or water from a small number of producers (the facilities) to a larger number of consumers (the cities). Building a facility incurs a cost and so does connecting a city to a facility. When we use the algorithm in our aggregator, the volunteer clicks that we want to group into clusters become the facilities and cities. The trick to finding the right clusters is how we choose to define the costs for facility creation and facility-city connection.
The costs we use are based on a statistical model that tries to understand how different volunteers behave when they classify clumpy galaxies. For each volunteer, the model learns how likely that volunteer is to miss real clumps or accidentally click on other features in the subject images. The exact location of real clumps in an image can be ambiguous, so when the model thinks that a volunteer has clicked on a real clump, it also tries to predict how accurate their annotation is. But it isn’t just the volunteers that are unique – different subjects have different characteristics too, and it may be much more difficult to spot clumps in some galaxies than it is in others. For example, spotting bright, well separated clumps on a faint background is likely to be much easier than spotting faint closely packed clumps in a noisy image. Our aggregator model takes this into account as well by trying to understand just how difficult finding clumps is in different images.
How does the aggregator model work out how volunteers are behaving? Do we tell it the right answer for a handful of subjects and check the volunteers’ annotations against them? Actually no, because we don’t know exactly what the right answer is! One of the goals of Galaxy Zoo: Clump Scout was to let the volunteers decide together exactly what it takes for a feature to be a clump. So we don’t give our model any information except the clicks that the volunteers provide. Just by comparing how different volunteers respond to different images as the classifications arrive, and comparing their annotations with the clusters found by the facility location algorithm, our model slowly learns the combination of all volunteer behavioural traits and image difficulties that best explain the classification data it has seen.
Once our model provides its best description of the volunteers and images, we define the costs for the facility location algorithm. We specify that turning a volunteer’s click into a facility is more expensive for very optimistic volunteers, who might click on slightly more features that aren’t really clumps. This reduces the chance of accidentally contaminating the clump detections. Connecting clicks to an existing facility costs more if the volunteers that provided them seem optimistic. On the other hand, if it seems like a volunteer is more pessimistic or their clicks are slightly less accurate, then it becomes cheaper to connect their clicks into an existing cluster. This ensures that we don’t miss those hard-to-spot clumps with fewer clicks or more widely spread clicks.
But wait a minute! Were you reading carefully? Our model’s understanding of the volunteers and images is partly based on the clusters that were found, but the cost of creating the clusters depends on the volunteers’ behaviour! How does that work?! Good question. Whenever a new volunteer joins the project, we don’t know anything about them, so we make some reasonable assumptions about how they will behave. In a similar way, we assume that all subjects have roughly similar characteristics. We call these assumptions the “priors” of our model. These priors let us get started with a really rough set of clusters that our model can use to make an initial guess about the volunteers and subjects. Then we can use that guess to set some new costs and find some new, more refined clusters. With these clusters, our model can make another, better-informed prediction. Our algorithm keeps refining its guess and click-to-cluster assignments over and over again until the model predictions and the corresponding clusters don’t change any more.
Compared to our simplest aggregator, our best results from our more advanced method is better at picking up faint clumps and filtering out noise. It’s also the first time this sort of method has been used in the pipeline of a major citizen science project like this one. This aggregator will be the subject of one of our upcoming papers on Clump Scout, and we are very excited to share the results.
A special thanks on this post goes out to the other members of the Clump Scout team, who helped ensure that the details of our aggregation process were as accurate and simply explained as possible. In the next week or two we’ll publish a second post detailing some of the scientific findings we’ve gotten from our results. Thank you, and stay tuned!
