
A first Hubble look at UGC 7342
Overnight, Hubble got our first data on perhaps the most spectacular Voorwerpje host galaxy, the merging system UGC 7342. We have to wait until almost the end of the year for what we really wanted to see, the ionized gas. The telescope has particular time pressure in some parts of the sky (as if it doesn’t have extreme time pressure on everything people want to do with it), so we split the two sets of images to fit the schedule better. This time, we got data in WFC3 for two medium-width filters in the orange and deep red, selected to be essentially blind to emission from the gas. These will be used to subtract the contribution of starlight from the gas images, so we can analyze the gas properties cleanly. The emission-line images use the older ACS camera, which has a set of tunable filters which can isolate any optical wavelength we need. They come at year’s end, because we have to specify a particular range of orientation angle of the telescope to fit all the gas in their 40×80-arcsecond filter field. That, plus the requirement that the solar arrays can face the Sun directly, gives us a restricted time window.
As a reminder, here’s UGC 7342 from the SDSS data.
And here is a first look at the Hubble images, warts and all. With only the two filters in orange and deep red, the color information we get is pretty muted. Here’s the whole galaxy, shrunk 4 times from the original pixel scale to fit:

This show the companion and tidal streamers of stars. UGC 7342 itself shows shells of stars, which can be formed when a lower-mass disk galaxies merges with a more massive elliptical. With some additional velocity information, those might be able to give a time since the merger (with some tailored simulations). The elliptical reflections are from bright foreground stars outside this trimmed view; the emission-line images will at least have these in different places, using a different camera and different telescope orientation.
Zooming in 4 times to the nucleus shows that UGC 7342 has complex dust lanes crossing in front of the core. These are perpendicular to the directions where we see that distant gas is ionized by radiation from the nucleus, which is pretty common. The fact that the dust (and almost certainly associated gas) wraps at right angles to most of the structure in the galaxy is another indication that a merger took place recently enough that the situation hasn’t settled down into a long-lasting remnant.

Next up? The scheduling windows for SDSS 1510+07, NGC 5972, and the Teacup AGN all happen in overlapping spans from June to August. Bring on the bits!
Beautiful galaxy Messier 106
Inspired by today’s Astronomy Picture of the Day Image, here’s a quick post about the beautiful nearby spiral galaxy, Messier 106 (or NGC 4258).
 |
| M106 Close Up (from APOD) Credit: Composite Image Data – Hubble Legacy Archive; Adrian Zsilavec, Michelle Qualls, Adam Block / NOAO / AURA / NSF Processing – André van der Hoeven |
This is a composite Hubble Space Telescope and ground based (from NOAO) image. The ground based image was used to add colour to the high resolution single filter (ie. black and white) image from HST.
M106 has traditionally been classified as an unbarred Sb galaxies (although some astronomers claim a weak bar). In the 1960s it was discovered that if you look at M106 in radio and X-ray two additional “ghostly arms” appear, almost at right angles to the optical arms. These are explained as gas being shock heated by jets coming out of the central supermassive black hole (see Spitzer press release).
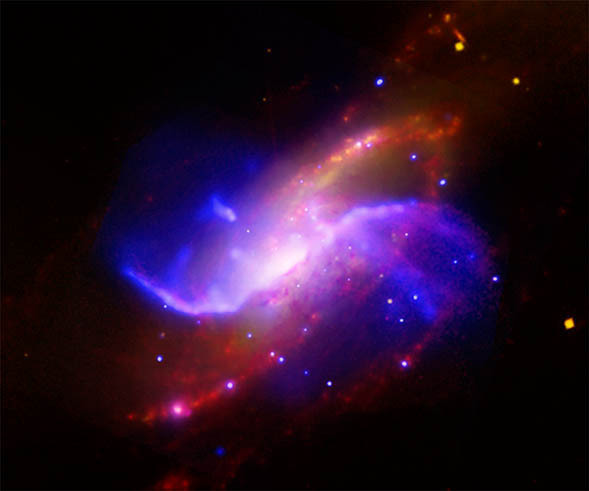 |
| In this composite image of spiral galaxy M106 (NGC 4258), optical data from the Digitized Sky Survey is shown as yellow, radio data from the Very Large Array appears as purple, X-ray data from Chandra is coded blue, and infrared data from the Spitzer Space Telescope appears red. Credit: X-ray: NASA/CXC/Univ. of Maryland/A.S. Wilson et al.; Optical: Palomar Observatory. DSS; IR:NASA/JPL-Caltech; VLA: NRAO/AUI/NSF |
Messier 106 (or NGC 4258) is an extremely important galaxy for astronomers, due to it’s role in tying down the extragalactic distance scale. A search in the NASA Extragalactic Database (NED) will reveal this galaxy has 55 separate estimates of its distance, using many of the classic methods on the Cosmic distance ladder. Most importantly, M106 was the first galaxy to have an geometric distance measure using a new method which tracked the orbits of clumps of gas moving around the supermassive black hole in its centre. This remains one of the most accurate extragalactic distances ever measured with only a 4% error (7.2+/-0.3 Mpc, or 22+/-1 million light years). The error can be so low, because the number of assumptions is small (it’s based on our knowledge of gravity), and as a geometrically estimated distance it leap frogs the lower rungs of the distance ladder.
This result was published in Nature in 1999: A geometric distance to the galaxy NGC4258 from orbital motions in a nuclear gas disk, Hernstein et al. 1999 (link includes an open access copy on the ArXiV).
Because M106 has so many different distances estimated using so many different methods, and is anchored by the extremely accurate geometric distance, it helps us to calibrate the distances to many other galaxies. Almost all cosmological results, and any result looking at the masses, or physical sizes of galaxies need a distance estimate.
So M106 is not only beautiful, it’s important.
New Dataset from Galaxy Zoo!
We’ve posted a new data set here: http://data.galaxyzoo.org/#agn
This sample is presented in the Galaxy Zoo 1 paper on AGN host galaxies (Schawinski et al., 2010, ApJ, 711, 284). It is a volume-limited sample of galaxies (0.02 < z < 0.05, M_z < -19.5 AB) with emission line classifications, stellar masses, velocity dispersions and GZ1 morphological classifications. When using this sample, please cite Schawinski et al. 2010 and Lintott et al. 2008, 2011.
Download here: http://galaxy-zoo-1.s3.amazonaws.com/schawinski_GZ_2010_catalogue.fits.gz
Column definitions are as follows:
- OBJID – SDSS object ID
- RA, DEC – RA and Dec in J2000
- REDSHIFT – SDSS spectroscopic redshift
- GZ1_MORPHOLOGY – Galaxy Zoo 1 morphology according to the Land et al. (2008) “clean” criterion. GZ_morphology is an integer where 1-early type, 4-late type, 0-indeterminate, 3-merger
- BPT_CLASS – 0-no emission lines, 1-SF, 2-Composite, 3-Seyfert and 4-LINER (see Schawinski et al. 2010 for details)
- U,G,R,I,Z -SDSS modelMag extinction corrected but not k-corrected
- SIGMA, SIGMA_ERR – Stellar velocity dispersion measured using GANDALF
- LOG_MSTELLAR – log of stellar mass
- L_O3 – Extinction-corrected [OIII] luminosity
The Finale of Merger Zoo
 Working toward Fitness –

Over the last year, we have been pretty quiet at the Merger Wars site. However, we have been extremely busy analyzing the data that you have created. So far, the Merger’s Applet has been used to view over 3 million simulations of interacting galaxies. We have estimated it actually simulated more than 100 million other systems that weren’t viewed by our users.
Of the 3 million simulations viewed, around 60 thousand were selected by the volunteers as interesting. Initially we thought the Evaluate activity within the applet would be sufficient to help us identify the top simulations for each pair of galaxies. However, with millions of simulations to sort through, across tens of thousands of sessions, we discovered that our initial plan was not sufficient. That’s when we decided to add the Merger Wars activity.
In Merger Wars volunteers judge a series of head-to-head competitions to determine which simulation is a better match to the target image of a galaxy merger. Over time, as the simulation competes multiple times, it earns a win/loss record. The percentage of times the simulation has won its competitions can be treated as a fitness value. A value of 1 is a perfect score, all wins, and a value of 0 is a terrible record of all losses. With over 800 thousand Merger Wars competitions judged, our volunteers were able to help us assign a fitness value to each of the 60 thousand selected simulations. These fitness values allowed us to further refine our models for each merger. In total, we identified 290 top simulations for the combined set of 54 pairs of galaxies. However, we need some final help finding the very best model for each system and finding out which collisions have the very best models.
One Orbit to Rule Them All-
Ideally, there would be a single set of orbit parameters to describe the paths the two galaxies take when flying past each other, and eventually towards their ultimate merging into one galaxy. It is difficult for researchers to know for sure if they have found the single best set of parameters. Is there a better set of orbit parameters? Are their multiple sets of equally good parameters? Are there no good sets? We can call this problem the issue of determining uniqueness. The volunteers for Merger Zoo have achieved an unprecedented level of study for each of these 54 systems. Typically researchers will look at a few dozen to a few hundred simulations of interacting galaxies and pick the best orbit from that sample. Together, we’ve reviewed on average over 50 thousand simulations for each pair and selected over 1000 simulations for further study. We’ve taken the multiple sets of orbit parameters identified for each system and examined them to see how well they’ve identified a single, best-fit orbit. When we look at the entire sample, we don’t see a single orbit. However, if we begin to exclude some of the sample by filtering out the low fitness simulations, we see the range of orbit parameters becomes smaller. If we increase the fitness value used in that filter, we continue to see smaller and smaller ranges of values. In this manner, we can say that we see convergence towards a small range of values for each of the orbit parameters. Arp 82, the image from the top of the post, is a good example of this convergence. For each population we show a box plot describing the distribution of the parameter. The box represents the range of data from 0.25 to 0.75 of the population. The horizontal line is the median, and the thin whiskers show the outliers. The populations shown are all states viewed by the users, all states selected by the users, and then several populations filtered by fitness to include the to top 50%, 25%, 10%, 5%, 2%, and finally the top 1% of simulations by fitness. The distribution of values describing the time of closest approach demonstrates some convergence. We see that the applet sampled a range of orbits that had times of closest approach ranging between 60 to 600 million years ago. By the time we filter to just the top 1%, we see the range is now only 100 to 250 million years ago with the likely range of 120 to 162 million years ago. Hancock et al find a time since closest approach of around 200 – 250 million years. The ratio of masses between the two galaxies converges in the same way.


Your Help is Needed-
The big thing we need help with is figuring out THE very best model of each system and comparing models of different systems. The Merger Wars site has a couple of new interfaces that are now posted. They include:
- Pick the Best: find the best model for each system
- Simulation Showdown: comparing the simulations from two different galaxies to find out which systems have the best models
- Merger Wars – HST : the last batch of Merger Wars results from non-Sloan images
- My Mergers: This is a new update that shows your contributions to the project. [Note: you need to be logged in for this link to work.]
After we get this final set of data, we will be archiving the site and writing a set of papers based on this work. However, your help is really needed with this final part of our analysis.
A Zoo of Mergers-
The image below is a combined image of 54 thumbnails showing all of the SDSS galaxy pairs studied in detailed by our Merger Zoo volunteers. Clicking on the image below will take you to our updated Gallery. From that page you can click on each individual thumbnail to see the top simulation results. You have done an amazing job with this project. Thanks so much for your help.

Galaxies Modeled in Merger Zoo
John and Anthony, The Merger Zoo guys
Hubble results on Hanny's Voorwerp – the whole story
We just submitted the journal paper describing the Hubble results on Hanny’s Voorwerp, to the Astronomical Journal. It’s not on arxiv.org yet – you can get a PDF here. Here’s a “brief” summary.
Data: In this paper we look at a whole collection of new data, obtained since the original discovery paper. These include:
Hubble, of course:
– WFC3 (Wide-Field camera 3) images in the near-ultraviolet, deep red, and near-infrared. These filters were designed to exclude most of the light from the gas, so we could look for star clusters, especially in Voorwerp and its surroundings, and with the IR image, look deeper into the dust around the nucleus of IC 2497.
– ACS (Advanced Camera for Surveys) images tuned to the wavelengths of [O III] and Hα emission. These were intended for fine structure in the gas and its ionization. As it turned out, we saw streamers, fine details, embedded star formation, and local interaction with a jet from IC 2497.
– STIS (Space Telescope Imaging Spectrograph) red and blue spectra across the galaxy nucleus. This let us isolate structure near the nucleus much better than from the ground, so we would look for any gas that has a line of sight to a brighter nucleus than we see directly (perhaps because of foreground dust).
GALEX (the Galaxy Evolution Explorer satellite): wide-field ultraviolet spectra and images, which help us put the Hubble UV data in context.
Kitt Peak 2.1m telescope – redshift of the companion galaxy, and the nature of star-forming regions just southwest of the nucleus of IC 2497
3.5m WIYN telescope BVI images – the best non-HST data, which we used to confirm techniques for reducing effects of cosmic-ray impacts in ACS images.
In no particular order, our major science results are:
1 – We found no evidence that the quasar in IC 2497 is still bright. The Hubble spectra show no highly-ionized gas near the center, as we might expect if it were bright but blocked by dust clouds from our point of view. In fact, with HST data we can refine our estimates of the radiation intensity seen by gas near the core and out in the Voorwerp, and these estimates only widen the shortfall. That is, we can constrain the quasar’s (former) brightness to have been brighter than our earlier lower limits from the ground-based data (because of the sharper Hubble images, we can tell better how close gas is to the nucleus of IC 2497 and how bright the brightest peaks are in the Voorwerp). To quote a famous 1960s television character, “It’s dead, Jim.”
2 – As we told everyone at the AAS, we found regions of star formation in the Voorwerp. This is part of a broader picture of a directed flow of gas out from IC 2497 in a fairly narrow jet or cone. The small radio jet seen with VLBI radio techniques (the Rampadarath et al. paper, using data from the UK MERLIN network at the European VBI network) points within about 10 degrees of the direction where we see a “small” area of star formation in Hanny’s Voorwerp (no more than 5000 light-years across), and this is precisely aligned with the one area where we see tendrils of gas pointed away from IC 2497 (the area I once called Kermit’s Fingers). We see these areas of star formation in two ways – in the images filtered to minimize the gas contribution, we see the light from young star clusters themselves, even into the ultraviolet. And in the images which isolate the ionized gas, we see its ionization state (and emission-line ratios) shift in local regions around the star clusters, to the ratios that we see when the gas is ionized by young stars and not AGN. In the color images, that shows up a a shift from green (where [O III] is much stronger) to red (where Hα is the stronger line). However, compared to some other active galaxies whose jets impact surrounding gas, the effects are modest in Hanny’s Voorwerp; the jet or outflow has compressed gas and triggered star formation, but at only a quarter the rate of the similarly-sized Minkowski’s Object, which sits right in the path of a more powerful jet from the radio galaxy NGC 541. The balance tells us something about the amount of material that can be in the outflow, in order not to have pulled any more gas out into filaments , and form any more stars, than we see. This also suggests something to look for in the future – star clusters in the middle of nowhere that were formed by outflows from now-faded active galactic nuclei.
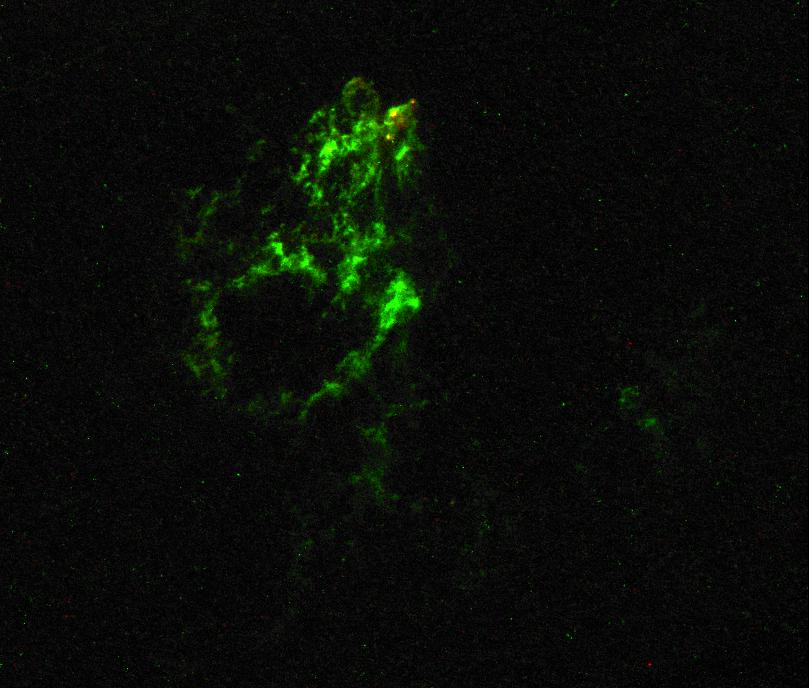
HST ACS image of Hanny's Voorwerp in oxygen III (green) and H-alpha (red)
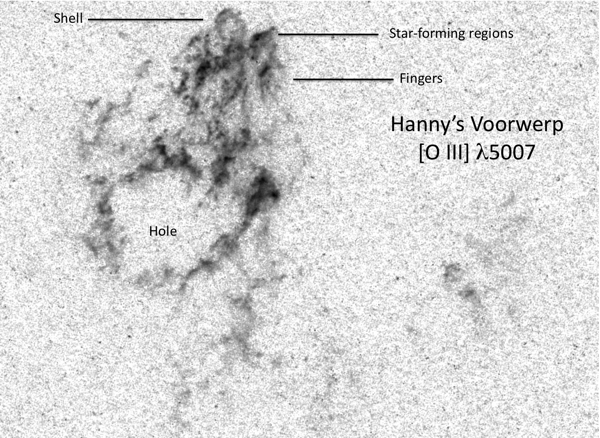
Features in Hanny's Voorwerp
The outflow of gas we see toward the Voorwerp may roughly match, in age, another find from the Hubble data – an expanding ring of gas, 1500 light-years in size, heading out from the core in the opposite direction. This is another sign that the AGN has begun to affect its environment through mass motions rather than radiation alone. This was a serendipitous find – only because the spectrograph slit happened to cut across it could we spot this region only a half arcsecond from the core where the Doppler shifts and emission-like properties were quite distinct. With some extra processing, it turned up in the emission-line images as well, which is how we know it forms a loop. We suspect that putting it all together may show that the black hole’s accretion in IC 2497 hasn’t completely shut down, but has shifted from producing radiation to pumping more energy into motions of surrounding gas (as it’s called in the jargon, switched from quasar mode to radio mode). The speed of such a switch would inform theoretical understanding of these accretion disks, happening not on the periods of days that we see for black holes in our neighborhood with a few times the Sun’s mass, to a million years (or now maybe rather less) in a galactic nucleus.
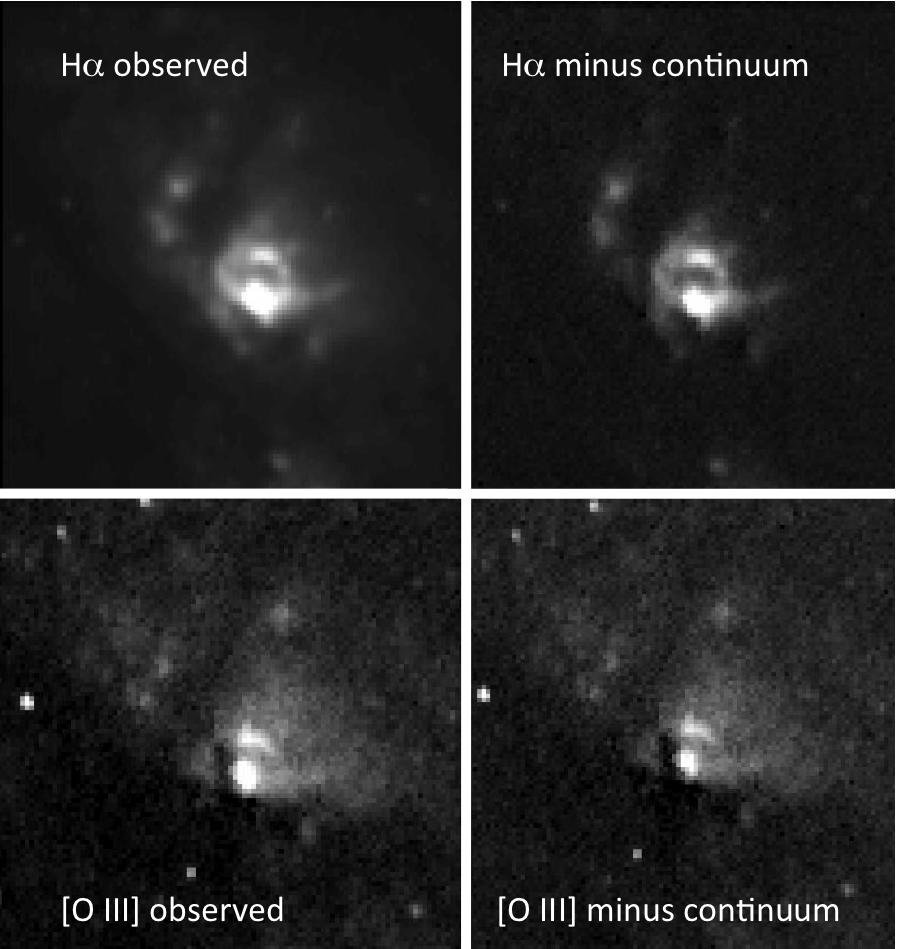
HST ACS images of the core of IC 2497
3 – As we could sort of see from the SDSS images, IC 2497 is disturbed. Its spiral arms are twisted out of a flat plane, with dust lanes cutting in front of the central region. This fits with the idea that a tidal collision pulled out the massive tail of neutral hydrogen. On the other hand, we now see that the companion galaxy just to its east is a beautifully symmetric, undisturbed spiral (which we now know to have a precisely matching redshift, so they are almost certainly close together). One picture that would fit these data would be that IC 2497 is the product of a merger something like a billion years ago (more precisely, before the time when we see it), a merger which was either quite unequal in galaxy masses or unusual in leaving the disk of the galaxy in place although warped. There is a suggestion that the patch of star-forming areas just to the southwest of the center of IC 2497 might be all that remains of the other galaxy.
4 – This result may be a bit of an acquired taste, delving into emission-line physics. From the lack of a correlation between level of ionization and intensity of Hα emission, we can tell that, despite the amazing level of detail of blobs and strings we can see in the Hubble images, that there is fine structure on still smaller scales. The areas that are brighter are not, by and large, any denser than average (which would be the most natural way to have brighter H-alpha emission), they have more small blobs and filaments with about the same density. This could be general – if the outflow from IC 2497 has not reshaped the gas in the Voorwerp, most of the neutral hydrogen that’s not ionized by the galaxy nucleus would have the same kind of structure. That in turn would suggest that the common giant hydrogen tails around interacting galaxies are composed of masses of narrow threads of gas (maybe held together by magnetic fields), which is not the first thing we would guess from the limited-resolution radio data that are the only way we can see these tails unless they are ionized by a nearby AGN.
Several of these are results we will also look for in the Hubble images of selected Voorwerpjes – do we see star formation indicating there is an outflow from the AGN, and do we see the same evidence for fine structure in the gas?
From the spectrum, we have a pretty good idea what the chemical mix of elements is – by mass, around 77% hydrogen, 23% helium, and 0.25% of everything else (what astronomers like to call “metals”, although that mostly means carbon, nitrogen, and oxygen). This tells us a bit about where the gas didn’t come from – it was not blown out from deep inside IC 2497, because gas near the centers of big galaxies gets progressively enriched in heavy elements produced inside massive stars (then blown out in supernova explosions or less violent planetary nebulae). If the gas in the 21-cm hydrogen tail was pulled out from the outer regions of IC 2497 during an interaction with another galaxy, this would fit, since gas far out in spirals has been less affected by material produced in stars.
This is the first technique that has been able to look across times of many thousands of years, rather than the few decades that astronomers have been able to watch AGN. Getting a better handle on this was a big part of the search for voorwerpjes (so we get a better since of how unusual IC 2497 and the Voorwerp might be). From our initial sample of 19, we could make a crude estimate that AGN stay bright for roughly 20,000-200,000 years at a time. This comes from comparing the numbers of galaxies with clouds whose AGN are bright enough to account for them with the number where the AGN is too faint to light up the clouds (where iC 2497 is the strongest example). I have a project slowly getting started to look for even fainter examples (too dim to be picked up by the SDSS) around bright galaxies, so we might be able to look back even longer (up to a million years if very lucky). Geeky it might be, but I couldn’t resist calling this the TELPERION survey. As an acronym it’s forced, but Middle-Earth aficionados will see how appropriate the connotation is.
All in all, quite an adventure beginning with “What’s the blue stuff?”
Star-formation, AGN and Ultra-luminous infrared galaxies
An update on mergers from Alfredo:
Star-formation, AGN and Ultra-luminous infrared galaxies (ULIRGs)
Looking at our galaxies in the infrared allows us to discover the overall star-formation rate of the system. Yet if we are interested in the fine details of what really fuel the energetic output of our mergers we need to have a closer look to the light we get from them.
Using a emission lines comparison technique called BPT (after Baldwin & Phillips & Terlevich 1981) we can tell what is really going on at the core of our galaxies.
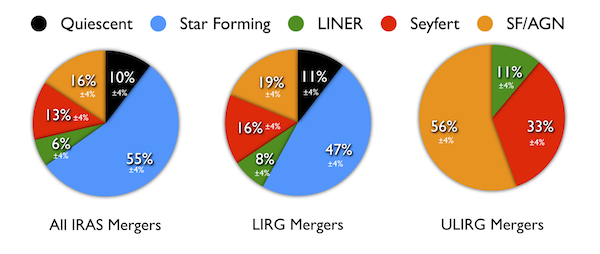
TV News says we don’t see any significant difference between the general IRAS-detected and the Luminous infrared galaxies. However, when we look at the most luminous infrared galaxies, the ULIRGs the fraction of AGN rises dramatically. This result is important because it conforms to many other studies on the role of AGN in ULIRGs.
We also explore the timescale for a LIRG to become a ULIRG. This is obviously an imperfect analysis for various reasons: firstly not all LIRGs turn into ULIRGs, secondly we use Newtonian mechanics in our calculations and lastly our constraints are quite approximate.
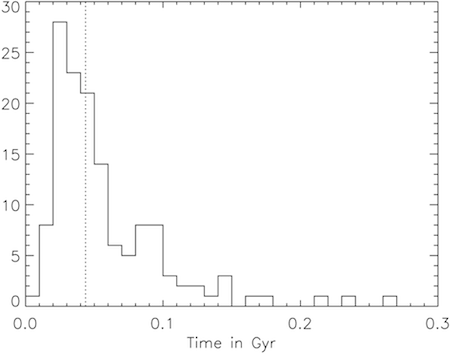
Gyr = gigayear = a billion years
We assume that the Infrared luminosity peaks when the two galaxies coalesce, so we discard all the post-merger LIRGs. Another requirement is that the total mass of the progenitor system is less than the mass of the ULIRGs. We calculate the distance between the two cores and we used a typical group velocity of 400km/s. Under those conditions we find a timescale of 50 million years.
Another Galactic Twin
It seems that finding our Milky Way’s twin has become a bit of an industry these days.
NASA/ESA have got in on the act today, releasing a press release about their favourite twin of the Milky Way, NGC 1073 and the below absolutely gorgeous Hubble Space Telescope image they’ve taken of it: Classic Portrait of a Barred Spiral.

Hubble image of NGC 1073: another possible Milky Way twin. Credit: NASA/ESA
And it does look a lot like what we think the Milky Way looks like – except perhaps for having slightly less tightly wound arms.

An artists impression of our Galaxy. Credit: NASA/JPL-Caltech/Robert Hurt (SSC-Caltech)
You might remember, back in September I posted a guest blog by Portsmouth A-level student, Tim Buckman, who spent his summer with us at Portsmouth finding the Galaxy Zoo galaxy we thought was most like the Milky Way: “A Summer Spent Finding our Galactic Twin “. His project in turn was inspired in part by an ESO press release about spiral galaxy NGC 6744 which was claimed to be a twin for the Milky Way (A Postcard from Extragalactic Space).

NGC 6744 – the previously proposed clone. Credit: ESO.
NGC 6744 is quite a lot more massive than our Milky Way however, so I thought we could do better with SDSS and Galaxy Zoo. Tim applied some mass cuts, then used your classifications to find a face-on 4 armed spiral which he thought matched the maps of the Milky Way (which has a bar, but perhaps a rather weak one which might not be obvious in the types of images we used for Galaxy Zoo).
Tim’s Milky Way clone based on your Galaxy Zoo classifications
I was interested to notice last month that one of the most popular press releases from the AAS this year was about finding a sample of galaxies like our Milky Way and using them to estimate what the colour of the Milky Way would be (BBC Article: Milky Way’s True Colours; AAS abstract it’s based on: What is the Color of the Milky Way?), especially interesting to me as it turns out the Milky Way might be on it’s way to being a red spiral (as has been suggested before, e.g. by Mutch, Croton, Poole (2011), or see New Scientist article about this paper: Milky Way Faces Midlife Crisis), which you might remember I’ve done a bit of work on! 😉
Today’s NASA/ESA release has already been picked up by the BBC: Hubble Snaps Stunning Barred Spiral Galaxy Image (they’d already used “Striking View of Milky Way Twin” on NGC 6744), and Space.com covers it as Hubble Telescope Spies Milky Way Galaxy Twin.
For Galaxy Zoo people, it should be of interest that the press release also says:
Some astronomers have suggested that the formation of a central bar-like structure might signal a spiral galaxy’s passage from intense star-formation into adulthood, as the bars turn up more often in galaxies full of older, red stars than younger, blue stars.
Well those astronomers are us – Galaxy Zoo results on bars, based on your classifications have shown that bars are more common in redder discs. Thanks again for the classifications which allowed us to do that work.
Meeting the Astronomy World
This guest post is from Anna Han, an undergrad working on the Hubble data from Galaxy Zoo:
I attended the AAS Conference in Austin, Texas with the Yale Astronomy and Physics Department to present the results from my research last summer. Many thanks to everyone in the department and Galaxy Zoo who gave me this opportunity and continue to support me through my work. It is because of their guidance that I was able to present a research poster at the conference this winter and enjoy a whole new experience.
The AAS Conference was fascinating, motivating, and overwhelming all at the same time. Starting from 9:00am every morning, I listened to various compact 10-minute talks given by various PhD candidates, post-docs, and researchers from around the world. Though I must admit some of the ideas presented went over my head, I learned more and more with each talk I heard.
The midday lunch breaks made up one of my favorite parts of the conference. Yes, the ribs in Texas are good. But no amount of delicious southern cuisine compares to how welcome and at ease I felt with fellow astronomers kind enough to invite me, a newbie sophomore undergraduate, to lunch. Lunch became my 2-hour my opportunity to talk one-on-one with other researchers and get informed on their work. When my questions ran out, I gladly took the chance to introduce my own research and use their feedback to better prepare for my poster presentation.
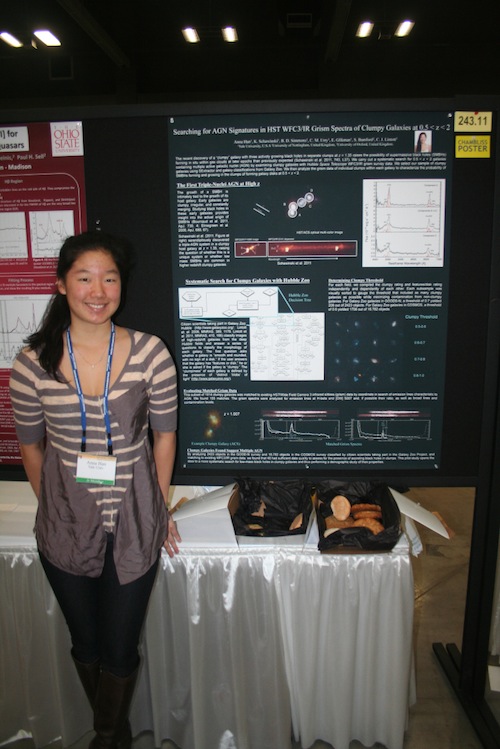
On Thursday morning, I tacked up my poster in the exhibit hall and stood guard, armed with organized details of my research and cookies as bait. Let me confess now that I have never been at or in a science fair, but I imagine it must be similar to what I experienced that day. Non-scientist citizens and experts in AGN alike perused my poster and asked questions. Every once in a while I recognized a familiar face: members from my research group, students I had befriended throughout the conference, and fellow researchers I had shared lunch with stopped by to see my poster. Explaining my research to someone who was interested (either in my work or the cookies) was an immensely rewarding experience. I felt proud of what I had accomplished and so thankful to the people who helped me do it. The encounters with other people also gave me ideas for future directions I could proceed in.
This semester, I plan to continue searching for multiple AGN signatures in grism spectra of clumpy galaxies. My experience at the AAS Conference has inspired me to develop a more systematic search for clumpy galaxies using Galaxy Zoo and explore in more detail the possibility of low redshift galaxies containing multiple AGN. To the citizens of Galaxy Zoo, thank you again, and I hope for your continued support!
The infrared properties of mergers
Another update from Alfredo Carpineti:
Following the previous post, we continue the analysis of galaxy mergers in the infrared.
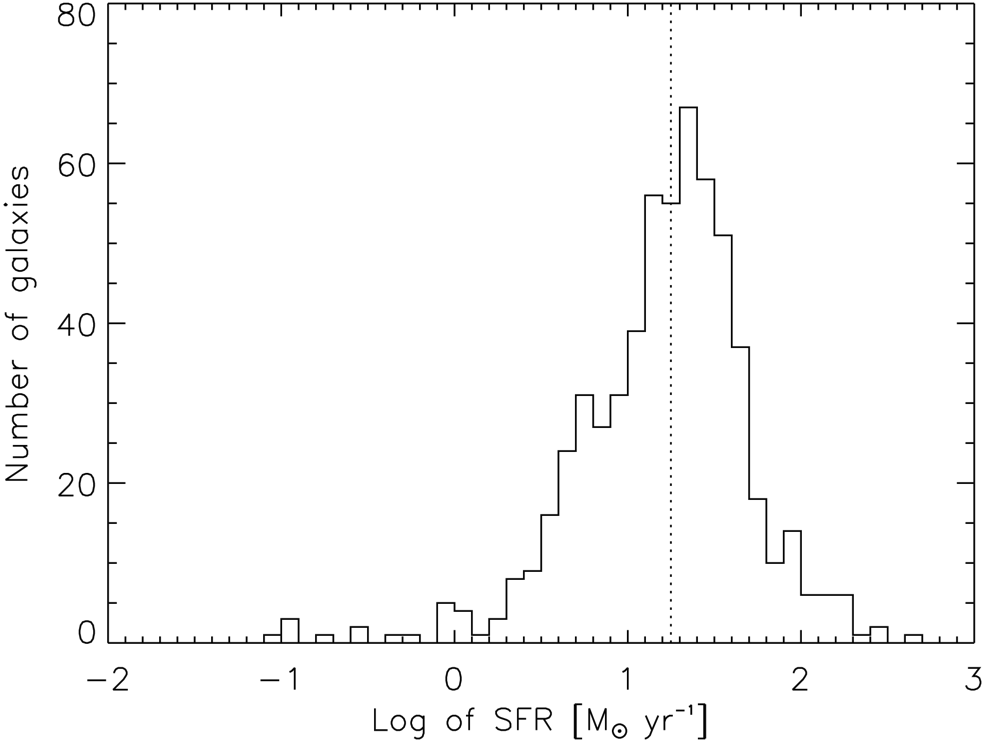
We want to understand where our galaxies stand with respect to other mergers and other infrared luminous galaxies. Using infrared radiation we can extrapolate the number of stars produced by a galaxy every year, namely the star formation rate(SFR). This number is really important since the star content of a galaxy modifies both its colours and its intrinsic properties. The average star formation rate is around 15 solar masses per year, which is high, considered that the SFR for a common galaxy is of 1-2 solar masses per year.
Let’s compare now the SFR with the mass. We can use two parameters to define the mass of a merger: the total mass and the mass ratio. The total mass is the sum of the masses of the two galaxies while the mass ratio is the ratio between the two masses. If a merger had a mass ratio between 1:1 and 1:3 is called a major merger, otherwise it’s a minor merger.
From the plot you can see that we don’t find any correlation between SFR and mass ratio, while we see a clear trend with the total mass.
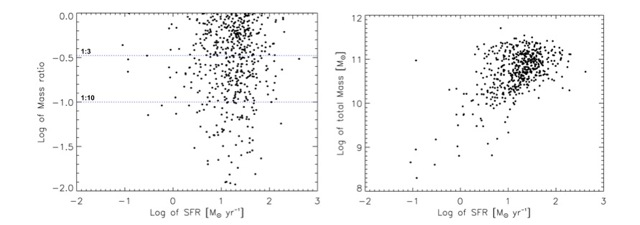
Another interesting parameter is the environment density. Density variations give way to difference in the tidal forces, approaching velocities and concentration of intergalactic gas and dust. These could lead to a dependence of the SFR on the environment. When we looked for it we found no such thing. The star formation rate seems independent of environment.

Galaxy overlaps at the AAS
Wednesday’s session at the Austin meeting of the American Astronomical Society will include new results from the Galaxy Zoo sample of overlapping galaxies. Extending the work in Anna Manning’s Master’s thesis, this marks an extension that helps us look ahead to comparison with the higher-redshift Hubble Zoo overlaps. Specifically, we compared visible-light data with ultraviolet data (from the GALEX satellite or a UV/optical monitor instrument on the European Space Agency’s XMM-Newton) to compare the amounts of optical and ultraviolet absorption in galaxies. This tells us, for example, how much we should correct Hubble measurements for high-redshift galaxies, where visible-light filters sample light which was emitted in the ultraviplet, to compare them with the rich SDSS data which see the visible range emitted by nearby galaxies. This is a key tool in trying to use backlit galaxies to search for changes in the dust content of galaxies over cosmic time, by comparing Hubble and Sloan results. Along the way, we see evidence that a common result – the flat so-called Calzetti extinction law in star-forming galaxies – results from the way dust clumps into regions of larger and smaller extinction that we usually see blurred together, since we see this in regions so far out in some galaxies that internal illumination by the galaxy’s own stars doesn’t matter. Here’s the poster presentation:

(That had to be shrunk to fit the blog size limits but should still be just legible – click for a bigger PNG). NGC 2207 is outside the SDSS footprint but had such good data that gave nice error bars that it wound up featuring a whole image series. Now to go back and apply that new set of analysis routines to more GZ pairs…
In other news, a Canadian astronomer working with NED found a new use for the overlap catalog including the “reject” list – to distinguish galaxies in pairs which are seen moving together or apart, since we often have both redshifts and from the dust we know which one is in front.
And to reiterate what it says at the end of the abstract – we thank all the Zooites who have contributed to the overlap sample and made this work possible!
