
Eight years and eight different types of galaxy images
One of the wonderful things we’ve been able to do with Galaxy Zoo over the years is to use the same site to classify many different types of images of the sky. These include surveys that come from a range of telescopes, both on the ground and in space, images at a range of wavelengths, and covering different areas of the sky. We need these different sets of images because they drive the wide variety of scientific questions that the science team studies using galaxy morphology. As part of our celebration of eight years of Galaxy Zoo, I wanted to highlight the different datasets we’ve been able to classify over the years.
Sloan Digital Sky Survey (Legacy Sample)
The bulk of the data used in both the original Galaxy Zoo and Galaxy Zoo 2 projects. These images were taken by the SDSS telescope, located in the mountains of New Mexico, and provided almost 900,000 individual galaxies that volunteers helped to classify.
Spiral galaxies from SDSS and Galaxy Zoo (Lintott et al. 2008)

COSMOS (Hubble Space Telescope)
The Cosmological Evolution Survey (COSMOS) was a dedicated campaign to image the same 2-square-degree field of the sky with more than a dozen telescopes, from radio through X-ray. 86,314 images of galaxies in the COSMOS field taken with Hubble were classified as part of the Galaxy Zoo: Hubble project.
Unbarred spiral galaxies from COSMOS and classified in GZ: Hubble. From Melvin et al. (2014).

CANDELS (Hubble Space Telescope)
The Cosmic Assembly Near-Infrared Deep Extragalactic Legacy Survey (CANDELS) was the largest project in the history of Hubble, with the equivalent of more than four straight months of observing time. Using the near-infrared WFC3 camera, Hubble image some of the earliest massive galaxies, formed only 2-3 billion years after the Big Bang. 49,555 images from CANDELS were classified in Galaxy Zoo from 2012-2013.
Disk galaxies in GZ:CANDELS, including those without bars (top row) and those with bars (bottom row). From Simmons et al. (2014).

UKIDSS (infrared images)
The United Kingdom Infrared Telescope, located near the summit of Mauna Kea in Hawai’i, carried out a large survey at infrared wavelengths, ranging from 1 to 3 microns. This survey (UKIDSS) allows us to compare morphologies of the same galaxies between optical and infrared, probing the effects of galactic dust and different stellar populations. 70,503 galaxies from UKIDSS have been classified by Galaxy Zoo volunteers.
A spiral galaxy with dust lanes, seen in both the optical (SDSS; left) and the infrared (UKIDSS; right).

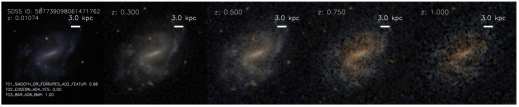
FERENGI (artificially-redshifted)
One of the critical issues with all Galaxy Zoo data has been calibration of the morphologies we measure, especially in distant galaxies where small and/or faint images can affect the accuracy of classifications. Using a piece of software called FERENGI, we artificially processed SDSS images to make them appear as if they were much further away, and we’re using those classifications to calibrate the data from Hubble. This included 6,624 images of galaxies at a range of distances and brightnesses.
An SDSS image of a barred spiral, artificially processed to appear as if it were at a variety of distances.

GOODS (Hubble Space Telescope)
The Great Observatories Origins Deep Survey (GOODS) is another multi-wavelength survey of the sky, focusing on data from NASA’s flagship space telescopes of Hubble, Chandra, and Spitzer (plus others). We not only study high-redshift galaxies using GOODS data in Galaxy Zoo, but also measure how increasing the sensitivity of the images can change the apparent morphology. 11,157 GOODS images have been classified in Galaxy Zoo at both shallow and deep imaging depths.
Comparison of the GOODS images classified in Galaxy Zoo. The left shows shallower images with only 2 sets of exposures; the right shows the deeper images with 5 sets of exposure.

Flipping spiral galaxies
One of the very first Galaxy Zoo papers addressed a fundamental question: are spiral galaxies in the Universe more likely to spin clockwise, counterclockwise, or equally likely in both directions? To measure this, we used images of spiral galaxies that were artificially flipped, which helped us correct for a psychological bias in the human brain that exhibits a slight preference for counterclockwise spins.
Images of four spiral galaxies, both as the originals (top) and horizontally flipped (bottom).

Single-band SDSS (ugriz)
The latest new set of data used SDSS galaxies again. Instead of making the “color” images that we’ve used before, however, Galaxy Zoo volunteers were asked to classify images from the five individual filters in SDSS, spanning light from the near-ultraviolet to the near-infrared. This will allow us to better measure how morphology can change as a function of observing wavelength, and determine which physical processes in the galaxy are responsible for the light that defines how we measure the shapes.
Single-band filter images of galaxies from the SDSS.
More to come soon. Thanks again for all your help with what we’ve done so far!!!
8 kpc – The approximate distance of the Sun from the centre of our Galaxy
Our sun is one of a hundred billion or so stars in the Milky Way, travelling in relative peace in the outskirts of our home galaxy. About 8 kiloparsec (26 thousand light years) from us in the constellation Sagittarius lies the center of the Milky Way. It can be difficult to see all the way to the center due to the enormous amounts of gas and dust in the way, but astronomers have managed to pierce this veil to study the heart of the Milky Way galaxy.
Two teams of astronomers, one based in Germany at the Max Planck Institute for extraterrestrial Physics (great name!) and the University of California Los Angeles tracked the motion of stars using state of the art infrared cameras in the very heart of the Milky Way and found something remarkable. The stars in the center of our galaxy all orbit the same empty spot.
(Source http://www.galacticcenter.astro.ucla.edu/animations.html)
It was as if there were some great mass in the center and the stars all orbited it. When they calculated the mass of this dark object, it came back as four *million* times the mass of the sun. The only object so small, yet so massive, is a black hole. So next time you see Sagittarius in the night sky, think of the monster lurking there.
We now know that almost all galaxies contain such a supermassive black hole in the center, and the true monsters can be much more massive: up to ten billion solar masses in the centers of the most massive galaxies. When these black holes feast on gas and dust, they can light up as active galactic nuclei or quasars.
The Galaxy Zoo team has been working hard to understand the connection between galaxies and their black holes for the last 8 years, and we’ve learned a lot! Hanny’s Voorwerp has told us much about what black holes are really up to, and your classifications for so many SDSS galaxies has really helped us to understand this “co-evolution” better!
In the case of the Milky Way, we can see the echoes of recent outbursts of feeding from our black hole, from light echoes travelling across molecular clouds in the center, to the enigmatic Fermi bubbles, which many astronomers suspect are the aftermath of a powerful burst of accretion by our black hole.

(Source http://apod.nasa.gov/apod/ap101110.html)
All this, just 8 kiloparsec from our home solar system…. it’s really not that far away!
Eight Years and the 8 Most Talked-About Galaxies in Galaxy Zoo

Continuing the countdown to Galaxy Zoo’s 8th birthday, below are 8 of the most-commented-on galaxies in the active Galaxy Zoo. They range near (in astronomical terms) and far, from gorgeous disks to space-warping groups, and some of them aren’t even galaxies at all!
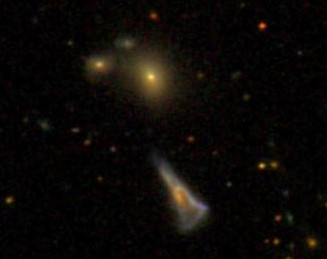
8. Galaxies Interacting (Arp 112)

#merger #arc #g-pair #bulge #tidaltails #ugc #wow #agn #ngc #ngc7806 #arp #markarian #dustlane #available_in_dr7 #spiral #gpair #awesome #tidal #lens #no_lens
A lovely example of the diversity of structures in the Universe. The central galaxy may have been a perfectly symmetric spiral before it was seriously disturbed by the elliptical galaxy on the left side of the shot, and what’s that wispy thing off to the right? Is it a former part of the central galaxy? And what is this all going to look like in a few billion years? Whatever happens, the volunteers made it clear this is a special one to classify and to look at.
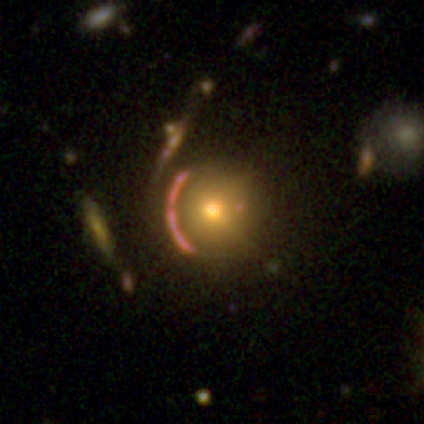
#lens #lensing #knownlens #arc #lense #interesting
This gorgeous gravitational lens was spotted almost immediately upon the launch of the new Galaxy Zoo within the high-redshift CANDELS data. It generated multiple lively discussions and scientists and volunteers alike weighed in with further information. It turned out in this case that this was one of very few lenses that were already known, but there are likely still unknown lenses buried in the data, waiting to be discovered!

#quasar #edge #lbg #star
Initially identified as a high-redshift star-forming galaxy by one of our seasoned volunteers, a number of people subsequently looked further into the existing scientific literature. There was a lot of debate about this particular point of light, but in the end the volunteers uncovered a later paper confirming that this green gem (which would actually be either very red or nearly invisible to the human eye, as it’s “green” because it only shows up in the infrared filters used for this image) is actually just a star in our galaxy. Bummer, maybe, but this process is also an important part of science.

#dustlane #polar #polarring #beautiful #polar-ring #elliptical #ring #edgeon #mothership #dust #polaring #question
This spectacular example of a polar ring galaxy couldn’t have been found in the original Galaxy Zoo or Galaxy Zoo 2, because it only made it into the Sloan Digital Sky Survey when the sky coverage was extended.

#merger #arp148 #arp #available_in_dr7 #lookalike #alphabet #ring
It takes a special kind of galaxy crash to make a collisional ring, and you can see this one in progress. It reminded our volunteers and scientists of the Cartwheel galaxy, another spectacular example of these snapshots of a brief moment in time.

#merger #odd #dark #needle #holycow #wow #doublenucleus #tidaldebris #disturbed #rocket #cluster #irregularshape #spaceship #rocketship
Well, this is odd. This galaxy looks like it’s on its own, but it has a rather unusual shape that would usually imply some sort of interaction or collision. Our volunteers discussed what could be causing it – until they viewed a zoomed-out image and it became clear that this galaxy has recently flown by a trio of galaxies, which would be more than enough to disrupt it into this lovely shape.
2. Hubble Resolves the Distant Universe

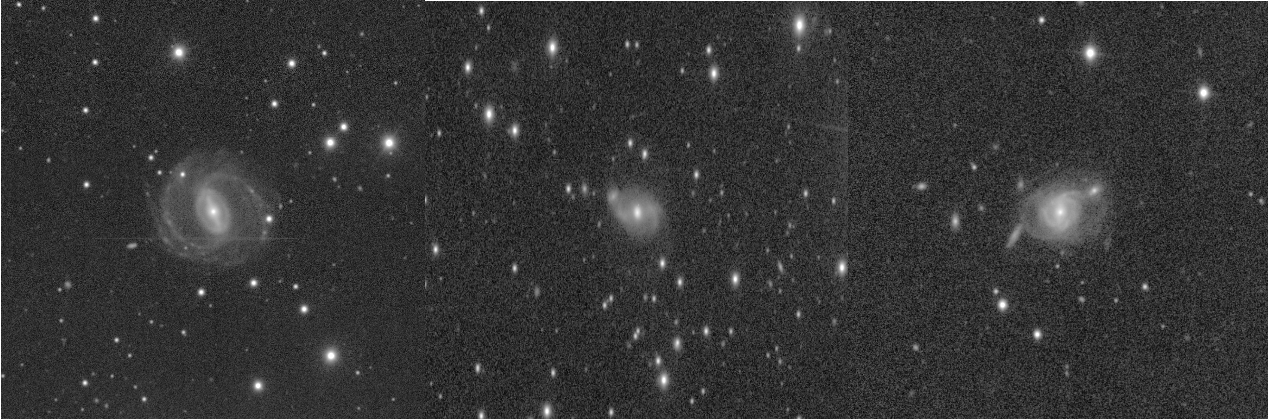
#spiral #overlap #dustlane #starburst #edge-on #edgeon
When a new batch of data taken by the Hubble Space Telescope appeared on the latest Galaxy Zoo, this was one of the first stunners remarked on by several people. Some of the parts of the sky covered by Hubble coincide with the Sloan Digital Sky Survey, and we linked the surveys up via Talk. Our tireless volunteers launched a thread collecting side-by-side images from SDSS and Hubble, showcasing the power of the world’s greatest space telescope. Hubble’s primary mirror is about the same size as that used by the SDSS, so the differences between the images of the same galaxy are due to the blurring effect of the atmosphere.

SDSS (on Earth) at left, HST (in space) at right.
And, the most talked about image in the latest Galaxy Zoo is…

It’s always the galaxies you least expect.
Okay, okay… If you saw this and said it looks like there isn’t a lot to talk about here, I wouldn’t blame you. And, indeed, there’s only one “short” comment from one of our volunteers, who used our Examine tools and discovered that this little blotch appears to be a very high-redshift galaxy.
However, that same volunteer also started a discussion with the question: just for fun, what’s the highest redshift you’ve found? Others responded, and thus began a quest to find the galaxy in Galaxy Zoo that is the farthest distance from us. This discussion is Galaxy Zoo at its finest, with new and experienced volunteers using the project as inspiration for their own investigations, scouring the scientific literature, and learning about the very early Universe.
It seems like the most likely known candidate so far is a quasar at a redshift of about 5.5 (at which point the Universe was about 1 billion years old), or, if you don’t think a quasar counts, an extended galaxy at z = 4 or so (1.5 billion years old). But there’s just so much science wonderfulness here, all of it from our fantastic volunteers, and it all started with a patchy blob and a sense of curiosity.
Galaxy Zoo started with a million blobs (ish) and a sense of adventure. I think that’s fitting.
A Galaxy Walks Into A Bar…

We are pleased to announce that a Galaxy Zoo project is one of the first projects built on the new Zooniverse! Several years ago we measured the lengths of galactic bars in relatively nearby galaxies in the Sloan Digital Sky Survey, and Ben Hoyle wrote an excellent paper presenting new an interesting results on how bars, which are a distinct feature caused by a change in the nature of the orbits of some of the stars in a galaxy, relate to other physical properties of the galaxy, such as color (indicative of recent star formation) and the nature of spiral arms or rings. That work showed the power of measurements like these, which are not always easy for computers to get right.
Today, we’re hoping you’ll help us extend that set of detailed galaxy measurements into the distant Universe, with measurements of bars in about 8,000 galaxies from our previous projects using Hubble Space Telescope data, including the AEGIS, CANDELS, COSMOS, GEMS and GOODS surveys.
We’ve deliberately been pretty broad in our selection of galaxies which may have a bar, so the first thing the project asks you is to confirm whether you think the galaxy does indeed have one. There are many examples of barred and not-barred galaxies (including examples of sort-of-looks-like-barred-but-actually-isn’t-and-here’s-why) included in the project, and you can access them anytime by clicking the “Need some help?” button.

We’ve also zoomed in on the central galaxy to make it easier to classify.
If the galaxy doesn’t have a bar, then you can move on to the next one. If it does, there are some follow-up questions about spiral arms and rings, and then we ask you to draw 2 lines on the image: one for the bar width and one for its length.
You can also join in the discussions after the classifications with our new Talk discussion tool, which is completely separate from the main Galaxy Zoo Talk (just like the rest of the project).
On a more personal note, this is a big step forward for the Zooniverse as a whole. The first draft version of this project came together in under 1 hour back in April. Afterward, we shared project links between science team members and iterated back and forth on the right questions to ask and the right data to use. This process would normally take at least 6 months and require a lot of one-on-one time with a Zooniverse developer. Instead, because the Zooniverse development team has done a brilliant job creating a Project Builder that’s flexible, powerful and also easy to use, we were able to create a new project in a way that’s analogous to, well, creating a blog.
In these early days of the new site’s release I’m sure there will be some bugs that need zapping, but even so the new capabilities of the Zooniverse are phenomenal. I suspect this is just the first of many new projects to be spun up in the New Zooniverse. (In fact, there are 3 more projects debuting alongside ours.)
Try it out here: Galaxy Zoo: Bar Lengths
Now back in Technicolor!
The science team and I want to thank to everyone who’s helped participate in the last month of classifications for the single-band Sloan Digital Sky Survey images in Galaxy Zoo, which were finished last night! The data will help us answer one of our key science questions (how does morphology change as a function of observed wavelength?), helping explore the role played by dust, stellar populations of different ages, and active regions of star formation. Researchers, particularly those at the University of Portsmouth, are eager to start looking at your classifications immediately.
“Look, Toto – Galaxy Zoo’s back in color!” (Image courtesy MGM/Ryan McCormick)
In the meantime, we’re returning to images that are likely more familiar to many volunteers: the SDSS gri color images from Data Release 8. These galaxies still need more data, especially for the disk/featured galaxies and detailed structures. However, we should have two new sets of data ready for classification very soon alongside the SDSS, including a brand-new telescope and something a little different than before.
Please let us know on Talk if you have any questions, particularly if you have feedback about the single-band images or the science we’re working on. Thanks again!!
Stellar Populations of Quiescent Barred Galaxies Paper Accepted!
A new paper using Galaxy Zoo 2 bar classification has recently been accepted!
In this paper (which can be found here: http://arxiv.org/abs/1505.02802), we use hundreds of SDSS spectra to study the types of stars, i.e., stellar populations, that make up barred and unbarred galaxies. The reason for this study is that simulations predict that bars should affect the stellar populations of their host galaxies. And while there have been numerous studies that have addressed this issue, there still is no consensus.
A graphic summary of this study is shown here:
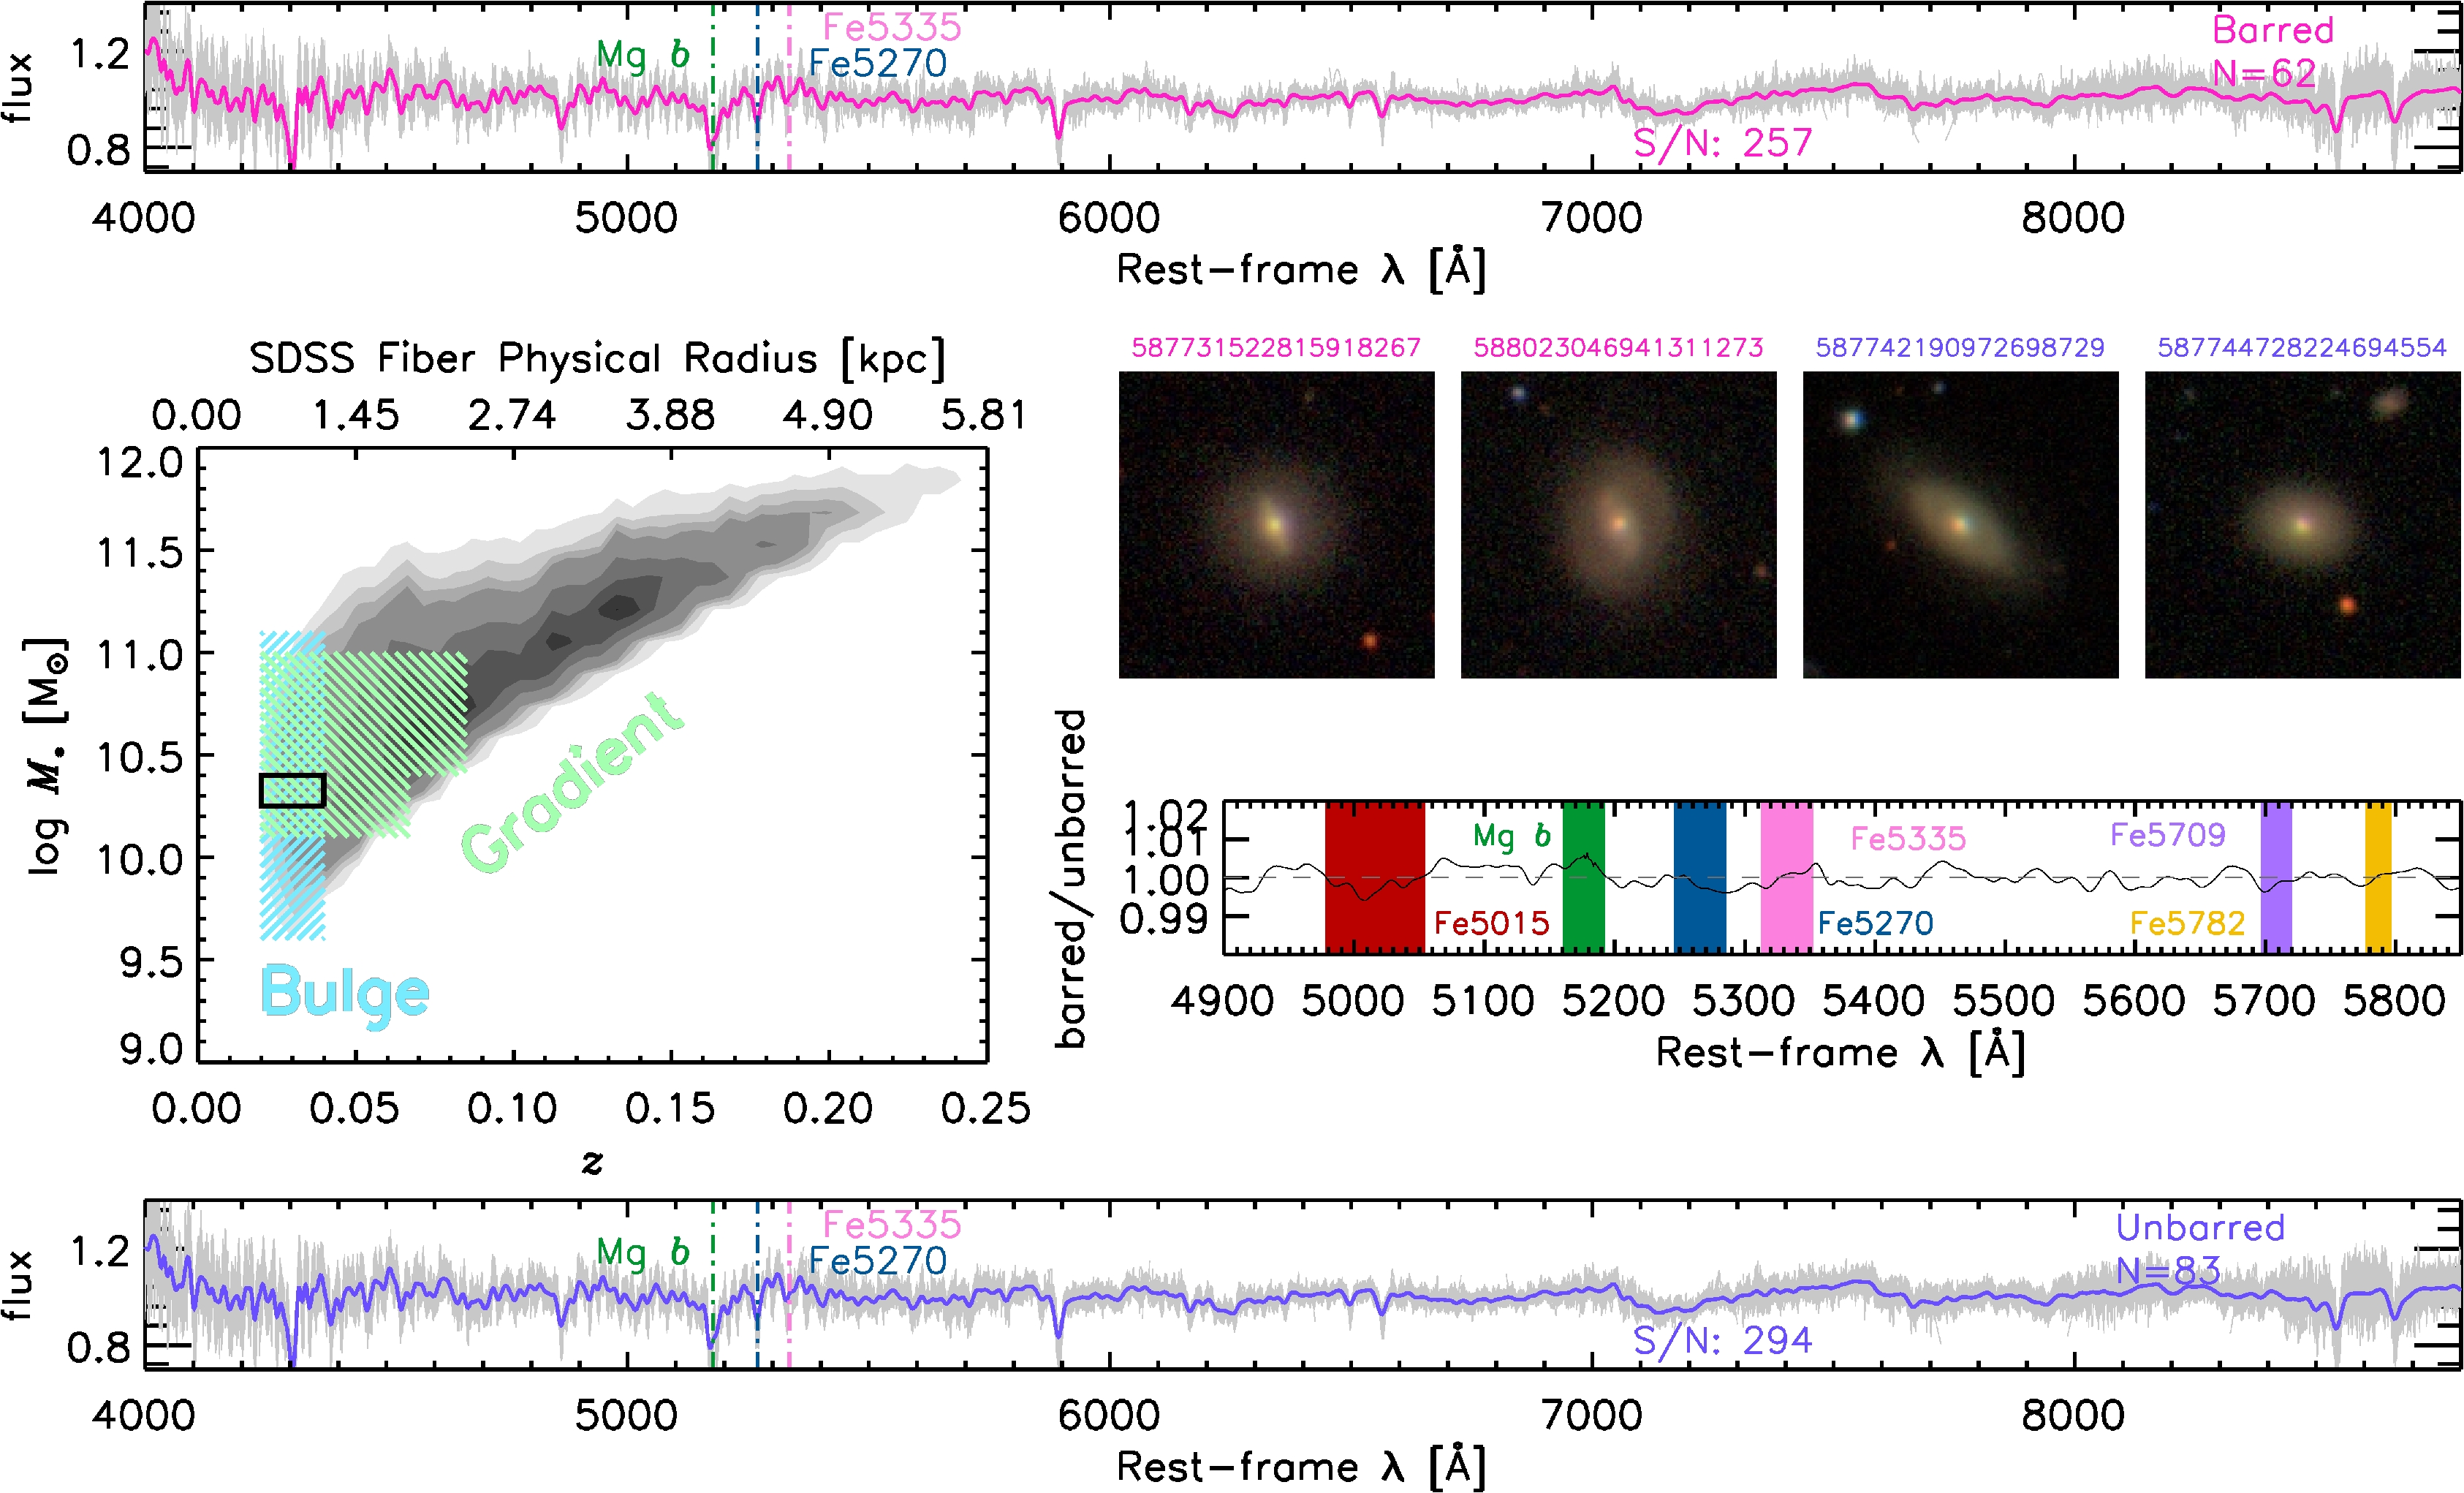
In this study, we stack hundreds of quiescent, i.e., non-star-forming, barred and unbarred galaxies in bins of redshift and stellar mass to produce extremely high-quality spectra. The center-left panel shows our parent sample in grey, and the cyan and green hash marks represent our galaxy selection for our bulge and gradient analysis. The black rectangle represents one of the bins we use. The upper and lower plots show the resultant stacked spectra of the barred and unbarred galaxies, respectively. We show images of barred and unbarred galaxies in the center, selected with the Galaxy Zoo 2 classifications. Finally, the center-right panel shows the ratio of these two stacked spectra at several wavelengths that reflect certain stellar population parameters.
Our main result is shown here:
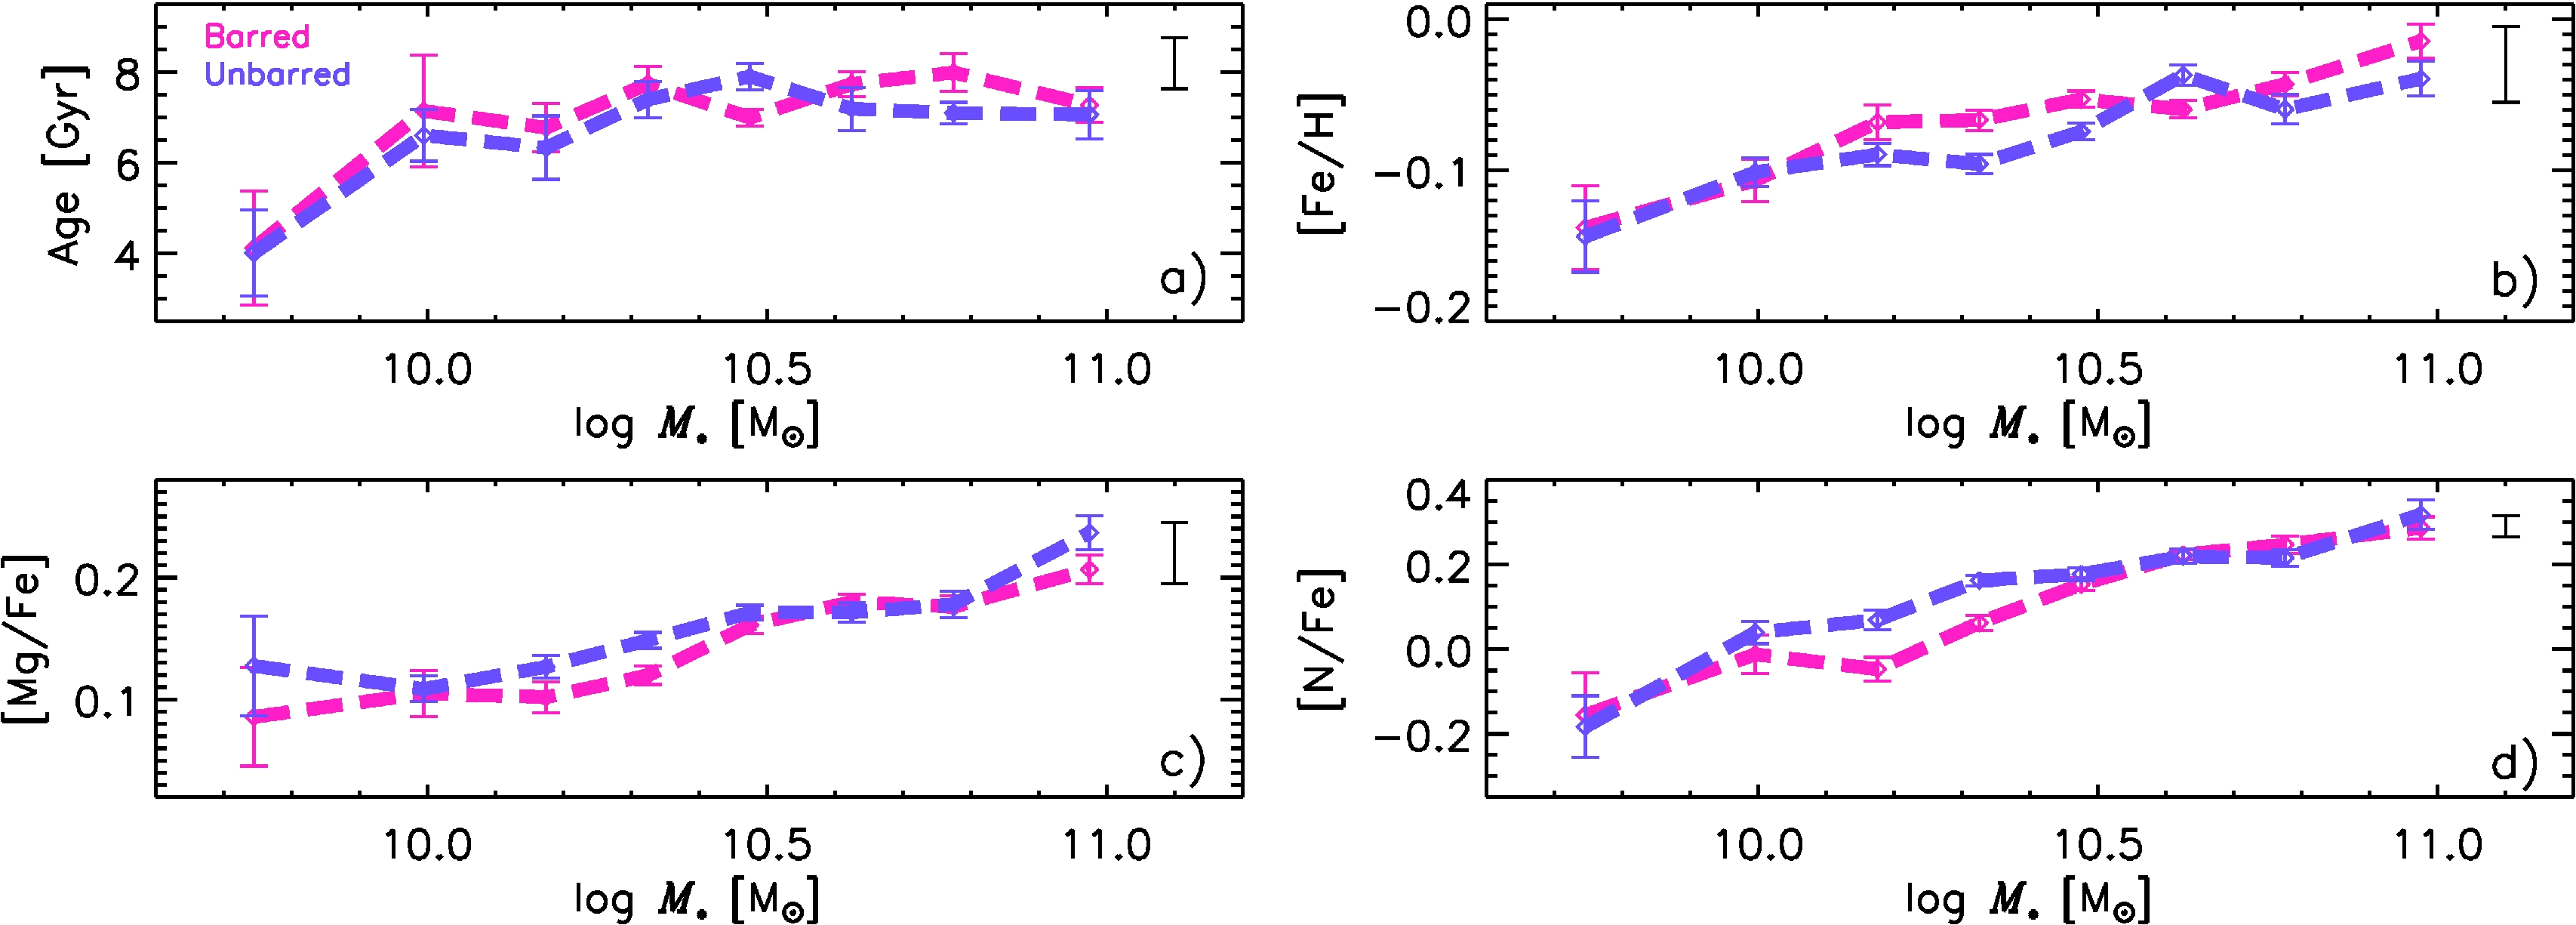
We plot several stellar population parameters as a function of stellar mass for barred and unbarred galaxies. Specifically, we plot the stellar age, which gives us an idea of the average age of a galaxy’s stars, stellar metallicity ([Fe/H]), which gives us an idea of the relative amount of elements heavier than hydrogen in a galaxy, alpha-abundance ([Mg/Fe]), which gives us an idea of the timescale it took to form a galaxy’s stars, and nitrogen abundance ([N/Fe]), which also gives us an idea of the timescale it took to form a galaxy’s stars.
The main result of our study is that there are no statistically significant differences in the stellar populations of quiescent barred and unbarred galaxies. Our results suggest that bars are not a strong influence on the chemical evolution of quiescent galaxies, which seems to be at odds with the predictions.
Finished with Hubble (for now), with new images going back to our “local” Universe
Thanks for everyone’s help on the recent push with the Hubble CANDELS and GOODS images. I’m happy to say that we’ve just completed the full set, and are working hard on analysis of how the new depths change the morphologies. In the meantime, we’re delighted to announce that we have even more new images on Galaxy Zoo!
The new set of images now active are slightly different for us, and so we wanted to explain here what they are and why we want to collect classifications for them.
In all phases of Galaxy Zoo so far we have shown you galaxy images which are in colour. The details of how these are created varies depending on which survey the images are from. With the SDSS images, we combine information from three of the five observational filters used by Sloan (g, r, i) to produce a single three-colour image for each galaxy. We’ve talked before in more detail about how those colour images are made. All five Sloan filters and their wavelengths and sensitivity are shown below. You can probably see why we’d pick gri for our standard colour images: these are the most sensitive filters, roughly in the “green”, “red” and “infrared” (or just about) parts of the spectrum.
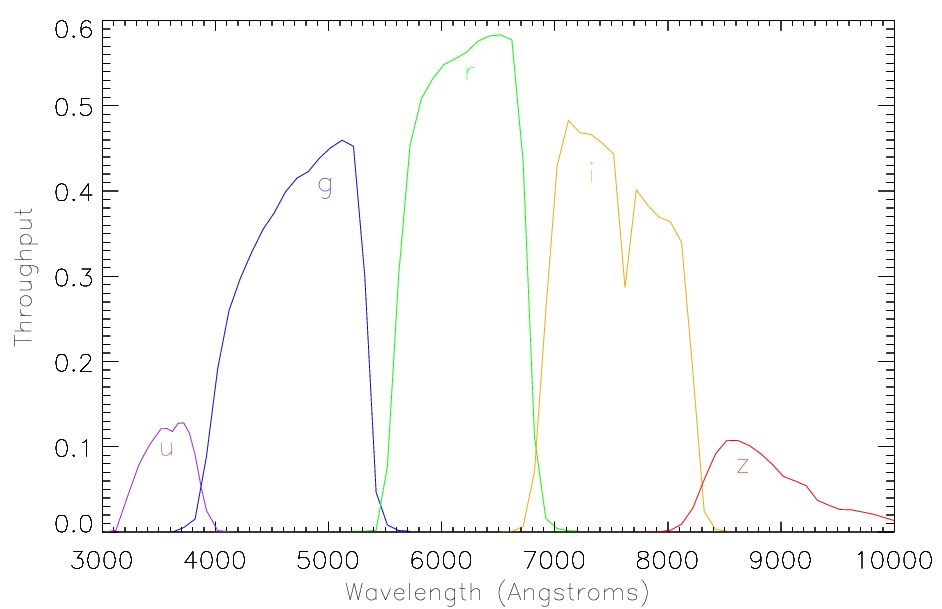
The five SDSS filters and the wavelengths they span.
Each of the SDSS filters is designed to observe the galaxy at a different part of the visible (or near visible) spectrum, with the bluest filter (the u-band; just into the UV part of the spectrum) and the reddest the z-band (which is into the infra-red). Different types of stars dominate the light from galaxies in different parts of the spectrum, for example hot massive young stars are very bright in the u-band, while dimmer lower mass stars are redder. Galaxies with older populations of stars will therefore look redder, as the massive blue stars will all have gone supernova already.
We are interested in measuring how a galaxy’s classification differs when it’s observed in each of the filters individually. To investigate this specific question, we have put together a selection of SDSS galaxies and instead of showing you a single three-colour image for each, we are showing you separately the original single filter images. We want you to classify them just as normal, and we will use these classifications to quantify how the classification changes from the blue to the red images.
Example postage stamp images of the monochromatic single filter images.
Astronomers have a good “rule of thumb” for what should happen to galaxy morphology as we move to redder (or bluer) filters, but it’s only ever been measured in very small samples of galaxies. With your help we’ll make a better measurement of this effect, which will be really useful in the interpretation of other trends we observe with galaxy colour.
(Hint: some users might want to use the “Invert” button on the Galaxy Zoo interface a little bit more for these images, as some galaxies are more clearly seen when you toggle it.)
Explore Galaxy Zoo Classifications

Screenshot of the Visualisation Tool
Visualizing the decision trees for Galaxy Zoo
Today we’ve added a new tool that visualizes the full decision tree for every Galaxy Zoo project from GZ2 onward (GZ1 only asked users one question, and would make for a boring visualization). Each tree shows all the possible paths Galaxy Zoo users can take when classifying a galaxy. Each “task” is color-coded by the minimum number of branches in the tree a classifier needs to take in order to reach that question. In other words, it indicates how deeply buried in the tree a particular question is, a property that is helpful when scientists are analyzing the classifications.
Galaxy Zoo has used two basic templates for its decision trees. The first template allowed users to classify galaxies into smooth, edge-on disks, or face on disks (with bars and/or spiral arms) and was used for Galaxy Zoo 2, the infrared UKIDSS images, and is currently being used for the SDSS data that is live on the site. The second template was designed for high-redshift galaxies, and allows users to classify galaxies into smooth, clumpy, edge on disks, or face on disks. This template was used for Galaxy Zoo: Hubble (GZ3), FERENGI (artificially redshifted images of galaxies), and is currently being used by the CANDELS and GOODS images in GZ4. Although these final three projects ask the same basic questions, there are some subtle differences between them in the questions we ask about the bulge dominance, “odd” features, mergers, spiral arms, and/or clumps.

Visualization of the decision tree for Galaxy Zoo 2 (GZ2), by C. Krawczyk. Colors indicate the depth of a particular question within the tree.
If you ever wanted to know all the questions Galaxy Zoo could possibly ask you, head on over to the new visualization and have a look!
New paper: Galaxy Zoo and machine learning
I’m really happy to announce a new paper based on Galaxy Zoo data has just been accepted for publication. This one is different than many of our previous works; it focuses on the science of machine learning, and how we’re improving the ability of computers to identify galaxy morphologies after being trained off the classifications you’ve provided in Galaxy Zoo. This paper was led by Sander Dieleman, a PhD student at Ghent University in Belgium.
This work was begun in early 2014, when we ran an online competition through the Kaggle data platform called “The Galaxy Challenge”. The premise was fairly simple – we used the classifications provided by citizen scientists for the Galaxy Zoo 2 project and challenged computer scientists to write an algorithm to match those classifications as closely as possible. We provided about 75,000 anonymized images + classifications as a training set for participants, and kept the same amount of data secret; solutions submitted by competitors were tested on this set. More than 300 teams participated, and we awarded prizes to the top three scores. You can see more details on the competition site.
Since completing the competition, Sander has been working on writing up his solution as an academic paper, which has just been accepted to Monthly Notices of the Royal Astronomical Society (MNRAS). The method he’s developed relies on a technique known as a neural network; these are sets of algorithms (or statistical models) in which the parameters being fit can change as they learn, and can model “non-linear” relationships between the inputs. The name and design of many neural networks are inspired by similarities to the way that neurons function in the brain.
One of the innovative techniques in Sander’s work has been to use a model that makes use of the symmetry in the galaxy images. Consider the pictures of the same galaxy below:

A galaxy from GZ2, shown both with no rotation (left) and rotated by 45 degrees (right).
From the classifications in GZ, we’d expect the answers for these two images to be identical; it’s the same galaxy, after all, no matter which way we look at it. For a computer program, however, these images would need to be separately analyzed and classified. Sander’s work exploits this in two ways:
- The size of the training data can be dramatically increased by including multiple, rotated versions of the different images. More training data typically results in a better-performing algorithm.
- Since the morphological classification for the two galaxies should be the same, we can apply the same feature detectors to the rotated images and thus share parameters in the model. This makes the model more general and improves the overall performance.
Once all of the training data is in, Sander’s model takes images and can provide very precise classifications of morphology. I think one of the neatest visualizations is this one: galaxies along the top vs bottom rows are considered “most dis-similar” by the maps in the model. You can see that it’s doing well by, for example, grouping all the loose spiral galaxies together and predicting that these are a distinct class from edge-on spirals.
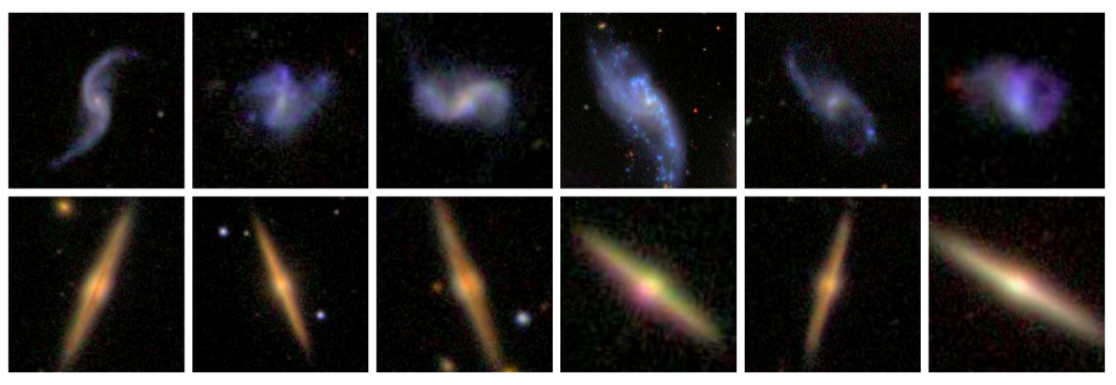
From Figure 13 in Dieleman et al. (2015). Example sets of images that are maximally distinct in the prediction model. The top row consists of loose winding spirals, while the bottom row are edge-on disks.
For more details on Sander’s work, he has an excellent blog post on his own site that goes into many of the details, a lot of which is accessible even to a non-expert.
While there are a lot of applications for these sorts of algorithms, we’re particularly interested in how this will help us select future datasets for Galaxy Zoo and similar projects. For future surveys like LSST, which will contain many millions of images, we want to efficiently select the images where citizen scientists can contribute the most – either for their unusualness or for the possibility of more serendipitous discoveries. Your data are what make innovations like this possible, and we’re looking forward to seeing how these can be applied to new scientific problems.
