
Galaxy Zoo: Literature Search – Initial Results
Thanks to everyone who has helped with the Galaxy Zoo Literature Search so far. It’s not too late to join in (for full details see the first blog post), but I thought I would write a followup summarising some of the findings so far. Hopefully it’ll help clarify what we’re looking for, and you won’t have to worry about repeating any of the papers we already have.
Academic life is full of lots of different tasks which occupy our time more or less at different parts of the year. It’s one of those things which I enjoy about it so much, but is is also basically my excuse for why work on the paper has ground to a halt in the last month. I have been occupied with teaching undergraduate Computational Physics, SDSS Spokesperson duties, and keeping on top of lots of remote observing with the Green Bank Radio Telescope. All good fun, but not paper writing! However this paper is making it back up to the top of my to do list now (hence this blog post!), so I hope to have more news for you on it soon.
Anyway here’s my summary of the new papers you have found for us in the different categories. We had no submissions yet of new papers defining early-types as E/S0/Sa, or late-types as being only types Sb/Sc/Sd yet, so keep looking for those.
Also as a reminder that when we’re talking about galaxies red = shorthand for not forming stars (or quenched), so sometimes astronomers use red and quenched (or passive) interchangeably. And spectra can also be used to find galaxies which are not forming stars, so spectral type and colour are highly related.
We also have a ton of different ways to talk about galaxy bulge size, from B/T (bulge-total ratio), to various model fits to light profiles (e.g. the Sersic profile, where Sersic n>2.5 is generally take to mean there’s a bulge, and n=1 means a pure disc). Concentration is also talked about – a more concentrated galaxy is more likely to have a bulge, than a less concentrated galaxy. And in SDSS there is a “fracDeV” parameter, which is the fraction of the model light curve made up from a “De Vaucouleur profile”, which is the same as a Sersic profile with n=4. We don’t like to make life too easy for newcomers in astronomy! 😉
The list of papers that:
- Claim that colour and morphology are equivalent
Strateva et al. 2001: https://ui.adsabs.harvard.edu/#abs/2001AJ….122.1861S/abstract
A classic here, and possibly the root of this idea: “We use visual morphology and spectral classification of subsamples of 287 and 500 galaxies, respectively, to show that the two peaks correspond roughly to early- (E, S0, and Sa) and late-type (Sb, Sc, and Irr) galaxies, as expected from their different stellar populations.”
Note that they are defining early- and late-types in the way I would like to find more examples of.
Fang et al. 2013: https://ui.adsabs.harvard.edu/#abs/2013ApJ…776…63F/abstract
This one is a bit complicated. They state in the Introduction that “galaxies above a Sersic value of n ≈ 2.5 tend to be quiescent. “ and go on to claim that having a large bulge is necessary but not sufficient to be quenched (ie. red). Which means they acknowledge the existence of blue ellipticals (or blue galaxies with large bulges), but not red spirals with small bulges.
In their conclusions they state: “our results imply that galaxy quenching requires the presence of a bulge, but that a bulge alone is not enough to ensure the complete cessation of SF. “
This was not exactly what we were looking for, but definitely related, and interesting.
Huerta-Company et al. 2011 http://adsabs.harvard.edu/abs/2011A%26A…525A.157H
Good try, but I’m not sure this quite counts in this category – they use colour as part of their classification scheme (which we would definitely not recommend), but it’s not the only part, so they’re not really saying it’s the same as morphology. “Three types of parameters used to estimate morphology probabilities; “we decided to include three types of parameters: (1) color (g − r, r − i) k-corrected with Blanton et al. (2005) code; (2) shape (isoB/isoA in the i-band and deVAB_i); and (3) light concentration (R90/R50 in the i-band). For color measurements we use modelmagnitudes corrected for galactic extinction. isoB and isoA are the isophotal minor and major axes respectively, and deVAB_i is the DeVaucouleurs fit b/a. R90 and R50 are the radii containing 90% and 50% of the petrosian flux, respectively”
Cooper et al. 2010: https://ui.adsabs.harvard.edu/#abs/2010MNRAS.402.1942C/abstract
In the introduction they say: “Various observational studies have investigated the formation of early-type or red-sequence galaxies “
They then go on to use colour to define their sample: sec. 2 p. 1943:”To isolate the red- sequence population, we use the following magnitude-dependent cut: g − r = −0.02667 · M r + 0.113”
Good find. This definitely just assumes that colour=morphology.
Tal & van Dokkum 2011: http://adsabs.harvard.edu/abs/2011ApJ…731…89T
In the words of our volunteer (Jean Tate):
“Throughout this paper, the authors conflate “massive red” with “elliptical”. This formally begins with the selection criteria (“We selected galaxy images for this study from the Sloan Digital Sky Survey (SDSS, Abazajian et al. 2009) including all objects classified as Luminous Red Galaxies (LRG) that have a spectroscopic redshift measurement. LRGs are intrinsically red and luminous objects that were identified as such from their central surface brightness and location on a rotated color-color diagram (for full details see Eisenstein et al. 2001). This selection is aimed at finding the most luminous red galaxies in the nearby Universe (L 3L⋆) out to a redshift of z = 0.5.”)”) which does not distinguish between red ellipticals and red spirals (nor red S0s). However, the first sentence in the Discussion section strongly implies that massive red S0s and massive red spirals are irrelevant (“The first and foremost result that arises from this study is that faint, gravitationally bound stellar light can be traced in massive elliptical galaxies out to a radius of 100 kpc.”), to take just one example.”
Another good find, and very common that LRG=elliptical is assumed.
2. Define “early-type” galaxy as any galaxy without visible spiral arms (e.g. our “smooth” category, which can include elliptical galaxies, and smooth disks), rather than as a galaxy that isn’t a disk.
So here I basically meant they were defining early-type as E and S0 only, and we got one submission like that:
Stanford et al. 1998: http://adsabs.harvard.edu/abs/1998ApJ…492..461S. “We present results from an optical-infrared photometric study of early-type (E+S0) galaxies in 19 galaxy clusters out to z = 0.9.”
“In this paper, we use the term ““early-type” galaxy to refer to those galaxies classified morphologically as having Hubble classes E, E/S0, or S0. “
3. Define “early-type” galaxy as including Sa spirals as well as lenticular and ellipticals.
No submissions yet – although note that Strateva et al. 2001 (above) do this.
4. Define “late-type” galaxy as only late-type spirals (e.g. excluding Sa spirals)
No submissions yet – although note that Strateva et al. 2001 (above) do this.
5. Use colour or spectral type to split galaxies into “early-“ or “late-“ types (or “elliptical” and “spiral”)
van den Bergh 2007: http://cdsads.u-strasbg.fr/cgi-bin/nph-bib_query?2007AJ….134.1508V&db_key=AST&nosetcookie=1 actually has a contrary view, claiming that “there appears to be no obvious dichotomy between the morphologies of galaxies that are situated on the broad blue and on the narrow red sequences in the galaxian color-magnitude diagram.”
Bell et al. 2004: http://adsabs.harvard.edu/abs/2004ApJ…608..752B
Exactly what we were looking for. They use colour to split their sample into “late” and “early” types, saying:
“”We find that the rest-frame color distribution of these galaxies is bimodal at all redshifts out to z ~ 1. This bimodality permits a model-independent definition of red early-type galaxies and blue late-type galaxies at any given redshift. ”
Cooper et al. 2010: https://ui.adsabs.harvard.edu/#abs/2010MNRAS.402.1942C/abstract
Another good example of using colour to define an early-type sample:
sec. 2 p. 1943:”To isolate the red- sequence population, we use the following magnitude-dependent cut:
g − r = −0.02667 · M r + 0.113”
In doing this they are assuming that red = early-type. In the introduction they say: “Various observational studies have investigated the formation of early-type or red-sequence galaxies “
Almedia et al. 2011: http://adsabs.harvard.edu/abs/2011ApJ…735..125S
Actually seem to be looking into how well the correlation between spectral type and morphology works, saying: “Given a spectral class, the morphological type wavers with a standard deviation between 2 and 3 T types, and the same large dispersion characterizes the variability of spectral classes given a morphological type.”
So this is actually evidence that morphology and spectral type are not completely equivalent.
Ascasibar & Almeida 2011: http://adsabs.harvard.edu/abs/2011MNRAS.415.2417A
But now in this one, the claim is that the correlation is good enough to use spectral classifications to place galaxies into a morphological sequence: “Considering galaxy spectra as multidimensional vectors, the majority of the spectral classes are distributed along a well-defined curve going from the earliest to the latest types, suggesting that the optical spectra of normal galaxies can be described in terms of a single affine parameter.”
6. Use the bulge-to-total ratio (or some proxy for it like concentration, or the SDSS “fracDeV” parameter) to place spiral galaxies in a sequence.
Goto et al. 2003: http://adsabs.harvard.edu/abs/2003MNRAS.346..601G
p. 604 : “Based on the Tauto parameter, we divide galaxies into four subsamples…”
Looking into this, “Tauto” is an attempt to parameters both the bulge size, and the amount of structure not captured in a smooth light profile (some form of clumpiness), so it does indeed neglect the degree of windiness of the spiral arm in placing them in a sequence by bulge size and clumsiness only. Nice find.
Drory & Fisher 2007: http://adsabs.harvard.edu/abs/2007ApJ…664..640D
This paper actually provides evidence that B/T is not enough to classify galaxies into a sequence, pointing out that there are different types of bulge (pseudobulges, which are thought to be build up slowly from discs, and classical bulges, general thought to form in mergers) which correlate with galaxy colour even at the same B/T.
“(1) the red-blue dichotomy is a function of bulge type: at the same B/T, pseudobulges are in globally blue galaxies and classical bulges are in globally red galaxies; “
In summary, I hope this was interesting, and there’s definitely some examples you hve found which will make it into the reference list for the paper. Thanks again for your help, and if you are now inspired to join in go read the instructions here. We’d love to have you along.
Galaxy Zoo Literature Search
Dear volunteers,
Here at Galaxy Zoo we know that some of you are looking for ways to be more involved in the entire process of making science from your clicks.
So we had an idea…..
The team are currently in the process of writing a paper which in its introduction discusses some of the current assumptions/errors/approximations common among our fellow astronomers when thinking about galaxy morphology and classification. As such we’d like to collect as many papers as possible which do the following things:
- Claim that colour and morphology are equivalent
- Define “early-type” galaxy as any galaxy without visible spiral arms (e.g. our “smooth” category, which can include elliptical galaxies, and smooth disks), rather than as a galaxy that isn’t a disk.
- Define “early-type” galaxy as including Sa spirals as well as lenticular and ellipticals.
- Define “late-type” galaxy as only late-type spirals (e.g. excluding Sa spirals)
- Use colour or spectral type to split galaxies into “early-“ or “late-“ types (or “elliptical” and “spiral”)
- Use the bulge-to-total ratio (or some proxy for it like concentration, or the SDSS “fracDeV” parameter) to place spiral galaxies in a sequence.
The current draft text in the paper which talks about these assumptions is:
“The morphology of a galaxy encodes information about its formation history and evolution through what it reveals about the orbits of the stars in the galaxy, and is known to correlate remarkably well with other physical properties (e.g. Roberts & Haynes 1994). These correlations, along with the ease of automated measurement of colour or spectral type, have resulted in a recent trend for classification on the basis of these properties rather than morphology per se (e.g. Weinmann et al. 2006, van den Bosch et al. 2008, Zehavi et al. 2011). Indeed the strength of the correlation has led some to authors to claim that the correspondance between colour and morphology is so good that that classification by colour alone can be used to replace morphology (e.g. Park & Choi 2005, Faber et al. 2007). Meanwhile the size of modern data sets (e.g. the Main Galaxy Sample of the Sloan Digital Sky Survey, SDSS, Strauss et al. 2002) made the traditional techniques of morphological classification by small numbers of experts implausible. This problem was solved making use of the technique of crowdsourcing by the Galaxy Zoo project (Lintott et al. 2008, 2011). One of the first results from the Galaxy Zoo morphological classifications was to demonstrate on a firm statistical basis that colour and morphology are not equivalent for all galaxies (Bamford et al. 2009, Schawinski et al. 2009, Masters et al. 2010) and that morphology provides complementary information on galaxy populations useful to understand the processes of galaxy evolution. “
and later when talking about the spiral sequence:
“Modern automatic galaxy classification has tended to conflate bulge size alone with spiral type (e.g. Laurikainen et al. 2007, Masters et al. 2010a), and automatic classification of galaxies into “early-” and “late-” types, referring to their location on the Hubble Sequence and based on bulge-total luminosity ratio (B/T ) or some proxy for this through a measure of central concentration, or light profile shape (e.g. Sersic index, as reviewed by Graham & Driver 2005) has become common (e.g. van der Wel et al. 2011). Indeed, Sandage (2005) says this is not new, claiming ”the Hubble system for disk galaxies had its roots in an arrange- ment of spirals in a continuous sequence of decreasing bulge size and increasing presence of condensations over the face of the image that had been devised by Reynolds in 1920.””
We’d like to ask for your help in searching for more examples of these behaviours. We have made a simple Google form, and we ask that you submit any examples you find in the next few weeks.
Some of the papers you find might end up cited in the Galaxy Zoo team paper (please be aware there are rules/guidelines about the appropriate number – we don’t want to have too few; it doesn’t make the point about how widespread this is, and we don’t want to single out specific astronomers, but the journal won’t accept too many either). If there are more papers found than we can use, they will be kept in a list on the Galaxy Zoo website (and we can continue to add to them if needed).
I want to reassure you that helping with this does not mean you have to read the entire extragalactic astronomy literature, or even the entirety of a paper! The best place to look for this information in a paper will be the “Sample Selection”, or “Data” sections. Modern online PDF papers also have excellent search facilities – so searching the text for key words (e.g. “spiral”, “early-type”, “colour/color-selected”) may work extremely well.
We’re happy for you to do this however you like (e.g. Google Scholar is fine), but we’d like you to return the NASA ADS (Astrophysics Data System) URL for the paper you find. You can search ADS here: http://adsabs.harvard.edu/abstract_service.html, and I give examples below of the URL I mean. This makes it easy for us to get the full bibliographic data to add the reference to the paper.
One tip – there are some papers in extragalactic astronomy which are cited by most/many results. A good place to start looking through recent papers would be the citation and reference lists of such papers, which can be found in ADS.
For example:
Strateva et al. 2001 “Color Separation of Galaxy Types in the Sloan Digital Sky Survey Imaging Data”
http://adsabs.harvard.edu/abs/2001AJ….122.1861S is cited by 926 papers, and references 25 – this would be an excellent starting place, and the more papers you read the more mentions you may find other other papers doing similar things.
Other good starting places:
Strauss et al. 2002: “Spectroscopic Target Selection in the Sloan Digital Sky Survey: The Main Galaxy Sample” http://adsabs.harvard.edu/abs/2002AJ….124.1810S
Ironically the papers which cite some of our Galaxy Zoo papers where we demonstrate there are galaxies which are not in the normal correlation between colour and morphology may also be good starting points (some citations to these are along the lines of saying things like: “most galaxies fall into blue=spiral; red=elliptical, a few don’t (cite Galaxy Zoo here), but we’re going to use this definition anyway”.
The initial papers on colour not being the same as morphology are:
Bamford et al. 2009 (281 citations): http://adsabs.harvard.edu/abs/2009MNRAS.393.1324B
Schawinski et al. 2009 (81 citations): http://adsabs.harvard.edu/abs/2009MNRAS.396..818S
Masters et al. 2010 (125 citations): http://adsabs.harvard.edu/abs/2010MNRAS.405..783M
We hope that if several of you take up the challenge, you’ll find different paths through the literature and find lots of different examples for us. Again here’s the link to our Galaxy Zoo Literature Survey.
Thanks for your help!
Karen Masters (Galaxy Zoo Project Scientist)
Can we reach 2 million classifications?

Radio Galaxy Zoo is halfway through its fourth year. We are going through all the classifications and finalizing our 1st data release. We could not have gotten this far without all of you. From the bottom of our hearts, we THANK YOU.
We have reached 71% completeness and sit just over 1,959,000 classifications. Can we reach 2 million?
As we did with our 1 million classification milestone, we invite you to classify our 2 million-th Radio Galaxy Zoo supermassive black hole. We have been working hard on Radio Galaxy Zoo merchandise (mugs, holographic bookmarks, and stickers). These are up for grabs for those who classify near or on number 2 million.
As always, make a note (click on discuss) if you have found something interesting, confusing, or if you have a question.
Start your hunt for active supermassive black holes at Radio Galaxy Zoo.
New papers investigate Galactic Rings in Galaxy Zoo
Hello Galaxy Zoo volunteers!
The fact that galaxies can host a multitude of different structures is no news to the volunteers: recent publications have looked at the spiral arms and bars in galaxies. There has now been some more recent work into a different, altogether rarer phenomenon that are called galactic rings. Galactic rings are objects that are commonly observed in the most strongly barred galaxies — it is theorised that these ring structures grow with the bars in galaxies. However, there are multiple theories that can explain these rare but significant features in galaxies, and the theories that claim to explain them remain purely theoretical.
To get an idea of exactly what is going on in ring galaxies requires a sample of galaxies which have galactic rings. Previous studies have relied on a handful of galaxies to study. However, Galaxy Zoo has proven to be the dataset of choice for any astronomer looking for the rarest of morphological phenomena, and Galaxy Zoo has once again provided the dataset for finding galactic rings in galaxies. Galaxy Zoo has always prided itself on not being just from the public but also for the public and for anyone the field of astronomy: all of the Galaxy Zoo data is available online for any astronomer to use. It is exactly the dataset that has allowed for the publication of two papers on galactic rings, by astronomer and long time friend of Galaxy Zoo, Ronald Buta, a Professor of Astrophysics at the University of Alabama. The first paper (here) used the public Galaxy Zoo 2 classifications to successfully define a sample of 3,962 ringed galaxies in Galaxy Zoo, and some examples are given in Fig.1.
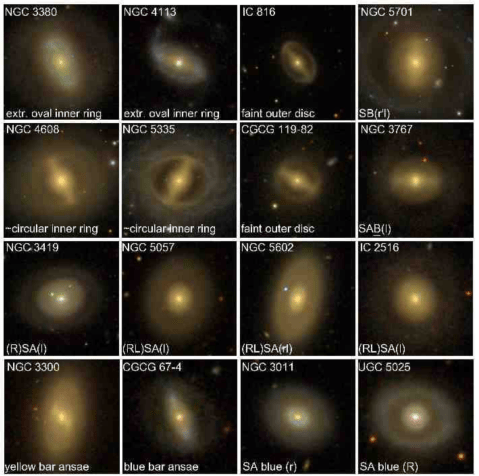
Figure 1: Examples of various ring morphologies identified with the help of Galaxy Zoo 2.
A direct follow-up paper investigating fifty of these ringed galaxies in more detail was then published, again by Ronald Buta. In the second paper of this Galactic Rings revisited series, the main aim was to check how the rings in galaxies are related to the dynamics of the disc: theory suggests that rings are the result of resonances between the motions of the various rotating materials in galaxy discs. A resonance is an amplification caused when two oscillations match at just the right frequency: think of pushing someone on a swing. If you give a push at the top of the swing, then the amplitude (how high up the swing goes) will increase. The work described in this paper shows that galactic rings are likely to be exactly that: resonances between the bar+spiral pattern and rotating stars, and that various ring morphologies can be caused by different resonances in the outer discs of galaxies.
This work really showcases one of the key strengths of Galaxy Zoo: finding rare classes of objects in samples impossible to be classified by professional astronomers. So once again we’d like to say thank you, on behalf of astronomers around the world in the Galaxy Zoo team and those who have gone on to use the data from your hard work in other ways.
#GZoo10 Day 3
We’re ready for the final day of the Galaxy Zoo 10 workshop at St Catherine’s College in Oxford; it’s been great to have so many people following along on the Livestream – yesterday’s talks are still up, and today’s schedule is:
09:30 Alice Sheppard (Forum Moderator 2007-2012)
10:00 Brooke Simmons (UCSD)
10:20 Nic Bonne (Portsmouth)
10:40 Coffee
11:00 Coleman Krawczyk (Portsmouth)
11:20 Mike Walmsley (Edinburgh)
11:40 Carie Cardamone (Wheelock)
12:00 Karen Masters: Summary (Portsmouth)
We’ll be blogging these talks as they happen here but you can also keep an eye on the twitter hashtag for updates too!
Our first speaker this morning is Alice Sheppard who was here from the beginning as a forum moderator on the original Galaxy Zoo site. She’s talking about the past 10 years and how she got involved with Galaxy Zoo site. She was very keen to get involved in the project and help classify galaxy images. After finding images that weren’t easily classifiable, users started to email members of the science team to ask them what to do. After this happened many times, the team realised that a place where users could talk together and interact with the team about classifications would be really useful. So the Galaxy Zoo forum was born! Alice was one of the first people to sign up and was asked to moderate the forum – she (along with other moderators) even started welcoming each new user who signed up with a friendly “Welcome to the Zoo!”
.@PenguinGalaxy: how the volunteers are welcomed to the Galaxy Zoo forum #GZoo10 pic.twitter.com/xxIviVO70e
— galaxyzoo (@galaxyzoo) July 12, 2017
Alice is now talking us through some of the findings made by the users. These discoveries including the Green Peas, which when first spotted by the users they immediately started investigating what they were using the links to the science survey site. In the original Galaxy Zoo there was also no button for an irregular galaxy, so users started collating their own collection of irregular galaxies! But what makes users keep coming back to the Galaxy Zoo forum time and time again? One success story was the Object of the Day – the moderators even crowd sourced the users to find good images!
.@PenguinGalaxy: Some of the volunteers started recognizing shapes in Galaxy Zoo #GZoo10 pic.twitter.com/eIlxpA0OxZ
— galaxyzoo (@galaxyzoo) July 12, 2017
Alice has discussed some suggestions for future engagement with users online – always give people room to chat; whether it’s about astronomy or not at all! Remember: as good as you think you citizen science system, tools, tutorials etc are – the volunteers will teach you how to do it better!
.@PenguinGalaxy's research questions #GZoo10 pic.twitter.com/BYQk8ju5Yw
— galaxyzoo (@galaxyzoo) July 12, 2017
Next up this morning is Brooke Simmons talking about what she’s calling probative outliers. The things that tend to break the mould and challenge our world (or Universe!) view. She starts with the bulgeless galaxies – those that look like pure disks – but are hosting growing super massive black holes in their centers. This is weird because the most accepted theory is that super massive black holes grow in mergers of galaxies BUT mergers also grow bulges – so how did these bulgeless things grow their black holes? Brooke is showing us some beautiful follow up observations of Galaxy Zoo SDSS images taken with the Hubble Space Telescope that will help to try and figure this out.
This galaxy hosts a luminous supermassive black hole. Hubble reveals rich substructure, including star-forming knots along the spiral arms. pic.twitter.com/SKufkF7IbV
— Brooke Simmons (@vrooje) May 22, 2017
Thing is, Brooke only has about 100 of these galaxies – but not for lack of trying! They just seem to be really rare. If we could actually cover the southern sky in the same way that SDSS covered the northern sky, Brooke would be very grateful! Could we also use trained machines to pick out the weird outliers as well? In which case, Brooke thinks we need to adapt the next iteration of Galaxy Zoo to be both machine as well as user friendly. This will mean leaving things behind but let’s not be afraid to make changes!
.@vrooje: let's actually let the machines do some of the work #GZoo10 pic.twitter.com/d8MIVp4Xgr
— galaxyzoo (@galaxyzoo) July 12, 2017
Next up, we have Nic Bonne from Portsmouth who’s going to tell us all about making luminosity functions using the data from Galaxy Zoo. So what’s a luminosity function? It’s basically a count of the number of galaxies at different luminosities (or brightness) which can give us clues about how the Universe formed and evolved.
Next is @coffee_samurai and Raffles, the awesome guide dog, on the luminosity function of GZ galaxies #GZoo10 pic.twitter.com/dvlrGATk5t
— galaxyzoo (@galaxyzoo) July 12, 2017
Luminosity functions are especially interesting if you start making them for different morphologies or colours of galaxies. This is what Nic has been doing using the Galaxy Zoo 2 classifications. He’s found something a bit weird though – that the galaxies classified as smooth seem to be more numerous than those classified as featured at the low luminosity (low mass) end. Bringing the colour of the galaxies into this picture as well shows you how similar red featured and red smooth luminosity functions are. Nic says there’s a lot more to do be done with this work though, including using Ross’s new debiased classifications to improve the sample completeness and investigating how the luminosity functions change shape for different kinematic morphologies.
@coffee_samurai's results on the luminosity functions: smooth galaxies are more numerous than featured ones at low masses #GZoo10 pic.twitter.com/mbqIyvageI
— galaxyzoo (@galaxyzoo) July 12, 2017
Next up is Coleman Krawczyk who’ll be showing us some of the initial results from the Galaxy Zoo 3D project. This project asked users to draw around the features of a galaxy on an image so that researchers could pick out the spectrum of that particular feature using MaNGA data. Users were asked to either mark the centre of the galaxy or draw around any bars or spiral arm features.
#gzoo10 some potential @galaxyzoo tasks are harder than others …. pic.twitter.com/hMd3qpAKHx
— Alice Sheppard (@PenguinGalaxy) July 12, 2017
Users could also choose which classification task they would prefer to help out with. This meant that the easy classification task of marking the centre of the galaxy was finished within a couple of days – whereas the spiral drawing task took 6 weeks for classifications to finish. Coleman has now reduced these classifications and has made “maps” for every galaxy marking which pixels are in which features. He’s now started making diagnostic plots to map the star formation rate in the different features of classified galaxies. Turns out we’re going to need more classifications in order to do the science we want to, so this project could have new data coming soon!
Next up is Mike Walmsley, who’ll be joining the research team as a PhD student in October.
Next is Mike Walmsley who will be joining the Galaxy Zoo team in 3 months' time #GZoo10 pic.twitter.com/agN3fmuOQH
— galaxyzoo (@galaxyzoo) July 12, 2017
He’s not yet done any work with Galaxy Zoo but as part of his Masters research he looked at doing automatic classification of tidal features in galaxies. His goal was to write a code that trained a machine, using a neural network, to detect these tidal features. He also figured out that masking the main galaxy light in the image makes it easier for the machine to spot tidal features. So does this method actually work? It identifies tidal features with ~80% accuracy – which is actually a much higher quality than other automated methods! He’s hoping to apply these methods to new and bigger surveys during his PhD.
Next up is Carie Cardamone from Wheelock College talking about her work building on the the discovery of the Green Peas by Galaxy Zoo volunteers.
AND IT'S THE PEAS 💚💚💚💚 #gzoo10 pic.twitter.com/TcWkBucD6H
— Alice Sheppard (@PenguinGalaxy) July 12, 2017
So what are the Green Peas? First up their name describes them pretty well because they’re small, round and green. Carie originally wanted to study them because she thought they might be growing super massive black holes, but it turned out instead they have extremely high star formation rate for their relatively small mass. There has been many further studies on these objects so we now know a lot more about them, but one thing we still don’t really know is what galaxy environment they live in. Carie is trying to quantify this but the first problem was that she didn’t have enough Peas! There’s only 80 in the original GZ2 sample but now with the better analysis tools Carie has been able to select 479 candidate Peas. Analysing this sample and comparing it to a sample of well studied luminous red galaxies, the results suggest that peas are less clustered. i.e. the Peas have fewer galaxy neighbours.
#GZoo10 Peas aren't quite so round in Hubble pic.twitter.com/t544m8I6KA
— Alice Sheppard (@PenguinGalaxy) July 12, 2017
We’re now coming towards the end of the meeting (sad times guys) and to remind us all why we’re here and what we talked about, Karen Masters is going to give us a summary of the past couple of days. She’s first pointing out how great we are as a team and the impact the research has had on the galaxy evolution community. Fitting for the 10 year anniversary is that we have 10 published papers with over 100 citations!
Finally. @KarenLMasters giving a summary of the #GZoo10 pic.twitter.com/l6ZzewUQaI
— galaxyzoo (@galaxyzoo) July 12, 2017
Karen has noticed a couple of themes from the past few days that she’s summarised for us. The first is that we have to keep engaging with the Galaxy Zoo community on Talk. The second is that we shouldn’t be afraid of change – let’s not get hung up on how it’s always been done and think about how best to do it now. The third is that galaxy’s are messy and we need to think carefully how we use the classifications. The fourth is that the users will always give you what you ask for – so be careful what you ask! But sometimes you get more than you asked for and end up with a wonderfully collaborative research team!
.@KarenLMasters: Happy 10th Birthday Galaxy Zoo! #GZoo10 pic.twitter.com/AqWrBWNMPW
— galaxyzoo (@galaxyzoo) July 12, 2017
Galaxy Zoo’s 10th Anniversary

Galaxy Zoo is celebrating ten years since launch next month, and as part of the festivities the science team are having a meeting in Oxford from 10th-12th July. Unfortunately we didn’t think it was feasible to invite the hundreds of thousands of you from all over the world who have contributed to the project over the last ten years, but the good news is that all of the talks from the meeting will be interactively live-streamed so that anyone can join in the discussion! See the schedule above for details on who is speaking at the meeting. Details of how to join the live stream will be released closer to the event.
There will also be an Oxford SciBar public event on the Monday night. All who are able to make it are welcome to join but don’t worry if you can’t, there will be a full podcast of the evening released shortly after the event!
Introducing the 100th Zooniverse Project: Galaxy Nurseries
It is my pleasure to announce the launch of a brand new Zooniverse project: Galaxy Nurseries. By taking part in this project, volunteers will help us measure the distances of thousands of galaxies, using their spectra. Before I tell you more about the new project and the fascinating science that you will be helping with, I have an announcement to make. Galaxy Nurseries is actually the 100th Zooniverse project, and we’re launching it in the year that Galaxy Zoo (the project that started the Zooniverse phenomenon) celebrates its 10 year anniversary. We can’t think of a better birthday present than a brand new galaxy project!
To celebrate these watersheds in the histories of the Zooniverse and Galaxy Zoo, we’re issuing a special challenge. Can you complete Galaxy Nurseries – the 100th Zooniverse project – in just 100 hours? We think you can do it. Prove us right!
Back to the science! What is Galaxy Nurseries? The main goal of this new project is to discover thousands of new baby galaxies in the distant Universe, using the light they emitted when the Universe was only half of its current age. Accurately measuring the distances to these galaxies is crucial, but this is not an easy task! To measure distances, images are not sufficient, and we need to analyze galaxy spectra. A spectrum is produced by decomposing the light that enters a telescope camera into its many different colors (or wavelengths). This is similar to the way that water droplets split white light into the beautiful colors of a rainbow after a storm.
The data that we use in this project come from the WISP survey. The “WISP” part stands for WFC3 IR Spectroscopic Parallel. This project uses the Wide Field Camera 3 carried by the Hubble Space Telescope to capture both images and spectra of hundreds of regions in the sky. These data allow us to find new galaxies (from the images) and simultaneously measure their distances (using the spectra).
This animation shows how a galaxy’s white light going through a prism gets decomposed into all its colors. Like the rainbow! The figure shows how the different colors end up in different positions. In this example violet/blue toward the bottom, orange/red toward the top. At each color, we have an image of the galaxy. When we sum the intensity at any given color, we obtained the spectrum to the right.
How do we do that? We need to identify features called “emission lines” in galaxy spectra. Emission lines appear as peaks in the spectrum and are produced when the presence of certain atomic elements in a galaxy (for example oxygen, or hydrogen), cause it to emit light much more strongly at a specific wavelength. The laws of physics tell us the exact wavelengths at which specific elements produce emission lines. We can use that information to tell how fast the galaxy is moving away from us by comparing the color of the emission line we actually measure with the color we know it had when it was produced. In the same way that the Doppler effect changes the apparent pitch of an ambulance’s siren as it approaches or recedes, the apparent color of an emission line depends on the speed of the galaxy that produced it. Then, we can relate the speed of the receding galaxy to how far it is from us through Edwin Hubble’s famous law.
The real trick is finding the emission line features in the galaxy spectra. Like many modern scientific experiments, we have written computer code that tries to identify these lines for us, but because our automatic line finder is only a machine, the code produces many bogus detections. It turns out that the visual processing power and critical thinking that human beings bring to bear is ideally suited for filtering out these bogus detections. By helping us to spot and eliminate the false positives, you will help us find galaxies that are some of the youngest and smallest that have ever been discovered. In addition, we can use your classifications to create a next-generation galaxy and line detection algorithm that is much less susceptible to being fooled and generating spurious detections. All your work will also be very valuable for the new NASA WFIRST telescope and for the ESA/NASA Euclid mission, which both will be launched in the coming decade.
Emission lines in a galaxy’s spectrum can tell us about much more than “just” its distance. For example, the presence of hydrogen and oxygen lines tells us that the galaxy contains very young, newborn stars. Only these stars are hot enough to warm the surrounding gas to sufficiently high temperatures that some of these lines appear. By examining emission lines we can also learn what kind of elements were already present and in what relative proportions. We too are “star-stuff”, and by looking at these young galaxies we are following the earliest formation of the elements that make all of us.

The horizontal rainbows show the spectra for the three objects on the left. The bottom, very compact object is a star in our own Milky Way. The other two objects are an interacting pair of young galaxies, observed as they were 7 billion years ago! We can say this because we see an emission line from hydrogen in both galaxies (indicated with arrows). This emission line allows us to measure the galaxies’ distances.
How do spiral arms affect star-formation?
Hi everyone! For those unaware, I am a PhD student at the University of Nottingham looking at spiral galaxies in Galaxy Zoo (for an overview, see this blog post). Following the release of my first refereed publication last year, my second refereed publication has now been accepted (woohoo!). As can be seen from my previous post (found here), we found remarkable differences between the spiral galaxies that we observe in the local Universe, simply by comparing galaxies with different numbers of spiral arms. Galaxies with two spiral arms are distinctly redder in colour than many-armed galaxies. However, the exact reasons for these differences was still up for debate. Red galaxies could have very low star-formation rates, or contain a significant amount of dust, blocking the escaping blue light.

The IRX-beta relation for galaxies with different numbers of spiral arms. A higher IRX value means more light is absorbed by dust: two-armed galaxies are more heavily dust-obscured.
With this in mind, we decided to follow-up that paper with panchromatic data from UV and infra-red wavelengths. UV wavelengths bluer than optical probe the very youngest stars, and infra-red wavelengths redder than optical measure dust emission directly. Combining these measurements allowed us to show the following things:
- Star-formation rate does not depend on spiral arm number: all spiral galaxies seem to be forming the same number of stars, regardless of what their spiral arms look like.
- The amount of blue light being absorbed by dust is significantly greater in two-armed spiral galaxies.
These two striking results have now shown us that spiral arms are not simply a visual pattern. They act to change the conditions of star-formation in local galaxies, making them much more sensitive to dust. Interested readers can find the full paper here.
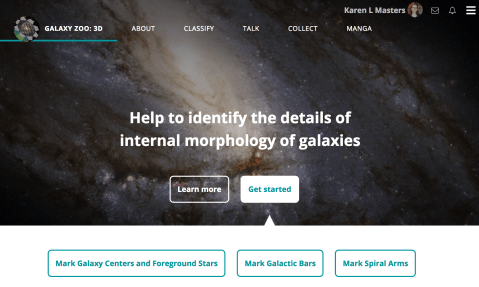
Introducing Galaxy Zoo “3D”, aka “Why are SDSS galaxies back?”
I’m delighted to announce the launch of “Galaxy Zoo: 3D” today – this is a small project from a subset of the Galaxy Zoo team where we ask you to help us identify in detail the locations of internal structures seen in a sample of about 30,000 galaxies.
What’s special about these galaxies is that they have been selected to potentially be observed (or in some cases have already been observed) by the “MaNGA” project.
MaNGA (which stands for “Mapping Nearby Galaxies at Apache Point Observatory” – sorry about that!), is a spectroscopic mapping survey that I have been working with for the last several years. This one of the current surveys which form part of the 4th generation of Sloan Digital Sky Surveys.
SDSS retired its camera in 2012 (its in the basement of the Smithsonian Museum in Washington, D.C!), and is now focusing on measuring spectra of things in space. Instead of taking images of galaxies in just a couple of filters, MaNGA takes spectral images – each of up to hundreds of points in the galaxy has a full spectrum measured, which means we can decode the types of stars and gas found in that part of the galaxy. We can also recover the motions of the stars and gas in the galaxy making use of the Doppler shift (the redshift or blue shift we see in light which comes from moving sources).

An illustration of the type of data MaNGA is taking. You get an image of the galaxy at each wavelength slice (e.g. the green one shown), or a spectrum at any point. You can also combine all the light into a single image. The resolution (sharpness) is poorer than using a camera, but you get a lot more information. Illustration credit: CubeVisualisation
MaNGA will ultimately do this for about 10,000 of the total list (this is how many we can manage in 6 years of operations), and since 2015 has already measured these data for a bit more than 3000 galaxies. To help us interpret this vast quantity of data we’re asking you to draw on the galaxies to mark the locations of spiral arms and bars. We also want to double check the galaxy centres are recorded correctly, and that we have found all the foreground stars which might be getting in the way of the galaxy.
Now one thing you know all about as Galaxy Zoo volunteers is the benefit of human eyes on large samples of galaxies. When we first launched Galaxy Zoo we made use of the “Main Galaxy Sample” from the Sloan Digital Sky Survey as the input list of galaxies. This is a sample of 1 million galaxies automatically identified from the SDSS images, and which had their distances (redshifts) measured in SDSS-I/II. However (perhaps ironically) the algorithm which selected this sample wasn’t very good at finding the biggest most nearby galaxies. Specifically it tended to “shred” them into what it thought were multiple galaxies. My favourite demonstration of this is the Pinwheel galaxy (M101), which the first SDSS galaxy detection algorithm interpreted as a cluster of galaxies.

M101 as seen by the original SDSS galaxy finding algorithm – each red box was thought to be a separate galaxy. Image from Brichman et al. 2013.
(Don’t worry – ever resourceful, astronomers have made plenty of use of these galaxies which have multiple spectra measured – it turns out to be really useful).
By the time MaNGA came along this problem was well known, and instead of making use of the standard SDSS galaxy catalogues, MaNGA targeted nearby galaxies by making use of the “NASA Sloan Atlas“- a NASA funded project to make a more careful list of nearby bright galaxies in the SDSS images.
So what we discovered when putting together the sample for Galaxy Zoo: 3D is that not all MaNGA galaxies have Galaxy Zoo classifications. In fact about 10% are missing, and we also found some more galaxies we missed first time round. It turns out that by relying on automatic galaxy finding there were a quite a few galaxies which had been missed before.
So these are back in the main site right now.
In Galaxy Zoo: 3D we will only ask you to draw spiral arms on galaxies you have previously said have spiral arms, so we’ll be making use of the new classifications to sort out the last 10% of MaNGA galaxies. We’ll also create a complete Galaxy Zoo classification list for the MaNGA sample, which will be really useful for people working with that sample.
To tempt you to give it a go, here are some interesting and beautiful MaNGA galaxies being discussed in Talk by our beta testers (the purple hexagon indicates the part of the galaxy where MaNGA can measure spectra). More than half of all the galaxies in MaNGA them are nearby galaxies with lots of structure. I think you’re really going to enjoy exploring them, and at the same time really help us learn a lot about galaxies.


FERENGI complete + new Illustris images!
Hi everyone, it’s Mel and Hugh from Minnesota, and we (especially Mel) would like to give a big THANK YOU for all of your help classifying these last couple of months! When we originally launched the second Ferengi set , it was estimated that it would take four months for the data to be complete, based on the current classification rates. Thanks to your help, that time was cut in half, and Mel’s thesis is officially saved! (Stay tuned this Spring for updates on how Mel is using these classifications to study morphological transformations of Hubble galaxies from 6 billion years ago to today.)
Now that those are complete, we have another announcement…
Illustris is back!
This week Galaxy Zoo volunteers may notice the appearance of simulated galaxy images produced by the Illustris project.
Illustris is one of several large-scale cosmological simulations that play a key role in helping us to understand how galaxies formed and how the Universe and its contents have evolved throughout cosmic history.
To learn more about Illustris, check out this previous blog post or the main Illustris project website.
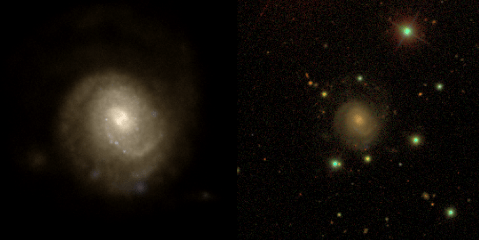
An Illustris galaxy – on the left is the original image from the simulation, on the right is the galaxy “Sloanified” with realistic colors and dropping it onto a real SDSS background.
