
Chandra X-ray Survey of Mergers Completed
Our Chandra programme to survey a sample of local merging galaxies found by you all to search for double black holes has just been completed. We’ve received the data for the final target. Now the data analysis can begin!
Talking about Galaxy Zoo on the Jodcast

I talk about Galaxy Zoo (specifically the red spirals and the results we had on bars in spirals) in the May 2011 Extra Edition of the Jodcast. I start talking about Galaxy Zoo about 6 minutes in. I linked just my interview below.
Hope you enjoy it, Karen.
New Green Pea study in the works
After the paper describing the `green pea’ galaxies discovered by the citizen scientists on the forum, other scientists started to take a keen interest in them. One group working on the peas independently of the Galaxy Zoo team are Ricardo Amorin and collaborators from the Instituto de Astrofisica de Andalucia for SEO Services and Galaxies in Granada, Spain. They also analyzed the green pea galaxies in particular to study the abundance of heavy elements produced by the death of stars that pollute the gas in galaxies and can give clues to the evolution of galaxies.
In the Cardamone et al. peas paper, we concluded that the peas had about as much heavy elements (metals for odd reasons to astronomers, yes, carbon is a `metal’) as would be expected for galaxies of their mass. In their paper, Amorin et al sportsbet. re-exaimed the spectra of the peas and concluded that the peas were actually deficient in metals, suggesting that they are more primordial than previously thought (see this blog post for a write-up).
Now Amorin et al. posted a conference proceeding on their work on the green peas. Conference proceedings are written versions of what someone has reported in a lecture at a conference and usually are not peer-reviewed. Sometimes these proceedings are just summaries of what a person or group has been doing on a particular topic, sometimes they are more general reviews and occasionally they contain ideas or data that might not make it otherwise into a peer-reviewed paper.
But what really caught my attention in this proceedings is the final paragraph:
Recent deep and high signal-to-noise imaging and spectroscopic observations with OSIRIS at the 10-m. Gran Telescopio Canarias (GTC) (Amoın et al. 2011, in prep) will provide new insights on the evolutionary state of the GPs. In particular, we will be able to see whether the GPs show an extended, old stellar population underlying the young burst, like those typically dominant in terms of stellar mass in most BCGs (e.g., [25], [26], [27]). The age, metallicity and mass of the old and young stellar populations will be analyzed in more detail by fitting population and evolutionary synthesis models to the observed spectra.
So Amorin are saying that they’ve observed some peas with the Gran Telescopio Canarias in detail. The GTC is a Spanish telescope, similar to the 10m Keck telescopes, located in the Canary Islands that has recently started operations. They also have a paper `in prep’, meaning that the paper isn’t finished and has not yet been submitted to a journal. They want to see if there are underlying old stars present in the peas which would suggest that the peas underwent previous bursts of star formation. If there are no such old stars, it would further strengthen the idea that the peas are really primordial galaxies in the old Universe – living fossils found in the Zoo.
We are eagerly waiting to see what Amorin et al find….
Galaxy Zoo and Zooniverse review article posted today on ArXiv

The Hubble Tuning Fork diagram developed to aid in galaxy classification. Galaxy Zoo showed that humans together are better than machine algorithms in classifying galaxies.
One of the really cool aspects of Galaxy Zoo is the link between the data generated by you all (the humans) and the data processed by computer algorithms (the machines). With Galaxy Zoo and its sister Zoos, we are showing that the machine classifiers can learn from the human classifiers. This is great because believe it or not, the data is just going to keep flowing. And flowing – more and more, faster and faster. By the time we reach the end of this decade when the Large Synoptic Survey Telescope (LSST) is online, the data will be coming in at tens of Terabytes a night. All the data that you classified in Galaxy Zoo 1 from the Sloan Digital Sky Survey took up only a few Terabytes in total. So those machines have to get much better at classifying if we all don’t want to drown in the data and you all are showing the way.
This whole area of work with training the computer algorithms is called Machine Learning. And a related endeavor, called Data Mining, is applying these algorithms to large quantities of data to extract patterns or knowledge. There is a book that is going to be published soon called “Advances in Machine Learning and Data Mining for Astronomy” (edited by Michael Way, Jeff Scargle, Ashok Srivastava, and Kamal Ali). The Galaxy Zoo team is really excited because we got asked to contribute a chapter to this book. The chapter is titled: Galaxy Zoo: Morphological Classification and Citizen Science. We got special agreement from the editors allowing us to post our chapter on the arXiv. Here’s the link to the article [ http://arxiv.org/abs/1104.5513] so you don’t have to wait for the book to come out! A lot of the folks from the Galaxy Zoo team contributed to the writing and it was fun to put together. The article gives a great overview of “how it all began”, the birth of the Zooniverse and, of course, we describe several of the discoveries you all have made. We finish by describing how we think the citizen science method of data analysis is going to be essential in conquering the flood of data. So take a look and we hope you have as much fun reading it as we had writing it.
Lucy (on behalf of all the chapter authors)
GZoo2 Bar paper accepted in MNRAS
Dear all,
After a lot of hard work by all involved, we are very pleased to say that the Galaxy Zoo2 Bar-Drawing paper has finally been accepted in Monthly Notices of the Royal Society. It will appear on the arXiv tomorrow, and there are links to access the data in the paper, and on my website here and the zooniverse repository.
The paper uses the results of an off-shoot Zooniverse project. This project present users with SDSS GalaxyZoo2 galaxies using the Google Maps interface, and asked the users to preform certain tasks.
Many of the galaxies had been classified by GZoo2 as containing a bar (an elongated structure extending across the center of the galaxy) and the users were asked to measure the bar length and thickness, and determine how the bar and spiral arms were connected, see the image below.

We had over 200 users on this off-shoot project, and ~14,000 unique bar classifications were made! Without your help, this project would have never have taken place. In fact, at the time we started writing the paper, this work contained almost 100 *times* more galaxies than any previous bar-galaxy research paper! Our statistics were overwhelming.
We found many interesting features, some were already known, but were placed on a far more rigorous footing, and others were new. For example, longer bars inhabit redder disk galaxies and
the bars themselves are redder, and that the bluest galaxies host the smallest galactic
bars; and we found that galaxies whose bars are directly connected to the spiral arms are preferentially bluer and that these galaxies host typically shorter bars. We also compared our results with previous observational works, and with simulations. E.g. a figure showing the bar length measurement against the galaxy color (as measured by the SDSS) can be seen below.

For those of you desperate for a sneak-peak before tomorrow, you can find our paper here.
here
We thank all of the volunteers again, for making this project such a success.
Best,
Ben [on behalf of the bar team]
Galaxy Zoo Top Trumps!
Here in the Oxford University astrophysics group we’ve been thinking about astronomy games to play with the school and public groups that come to our telescope evenings — do you remember the “Top Trumps” card game? Well how about “Galaxy Top Trumps”?!
If you grew up in the UK then you may have spent your school lunch hour playing this game. It’s a really simple card game: each pack of Top Trumps has a theme – cars, footballers, fighter planes, now they cover pretty much anything you can imagine (except galaxies). For example, each card in a cars pack would have a picture of a car and a handful of numbers for that car, such as its top speed or fuel consumption. The player on the dealer’s left chooses one of these numbers, and players compare the number on the top card in each of their hands. The card with the best number wins the trick, and its owner collects the other cards. Play continues until one player holds all the cards, or lunch hour ends and double maths begins, whichever comes first!
At school we became experts on cars as a result of playing this game (did you know that a diesel Ford Fiesta uses three times less fuel per kilometre than a Land Rover Discovery?). So, we had a first go at making astronomical Top Trumps – we made a pack for stars, and one for planets, and are finding that playing the game is a great way of introducing these objects to people, showing them the wide range of things out there, and giving them an idea of their relative properties. (Did you know that Saturn’s moon Titan is bigger than Mercury? And Betelgeuse is 140,000 times brighter than the Sun?)
Now we’d like to make a Galaxy pack, and we’d like your help! We think galaxies are a perfect theme, and we should be able to design a pack that is fun to play and through which people can learn a little bit about the amazing objects in the Zoo. Designing a mathematically perfect pack can get complicated, as James Grime explains in this great video, so for now we just want to focus on cool galaxies and good numbers to pick!
So, which galaxies and which attributes? There are some starting thoughts below, but what we really want are your ideas! What numbers would you like to see on the cards? Are we missing an interesting class of object? Did we forget your favourite galaxy?! Let us know!
You can head on over to this new forum thread or leave a comment here!
We probably won’t be able to get telescope time to measure new numbers to put on the cards (apparently the Time Allocation Committees aren’t so keen on proposals that are motivated by Top Trumps!), so we need to select attributes that we can either look up or get pretty easily from public data like the SDSS. We think things like radius, stellar mass, colour, star formation rate, supermassive black hole mass and redshift might be good. But what do you think?
As for choosing the galaxies, the obvious place to start is with the best-known, prettiest nearby galaxies that no pack would be complete without: Centaurus A, Andromeda, the Sombrero galaxy and maybe the Omega Centauri globular cluster (Are globular clusters galaxies? It’s a good conversation starter!). Any others? Then we might add one each of the basic Hubble types: elliptical, S0, Sa, Sb, Sc and Irregular (let us know if you have a favourite!). Then with all the recent Galaxy Zoo work on bars, we could include both barred and unbarred examples of these — which would make the best cards? We might also want examples of some of the unusual samples defined by Zooites: green peas and red spirals. And what about particular Zoo favourites like Hanny’s Voorwerp? Does that belong in the galaxies pack?
Cuppa Dwarf
This Week’s OOTW features Budgieye’s OOTD posted on the 1st of April 2011.
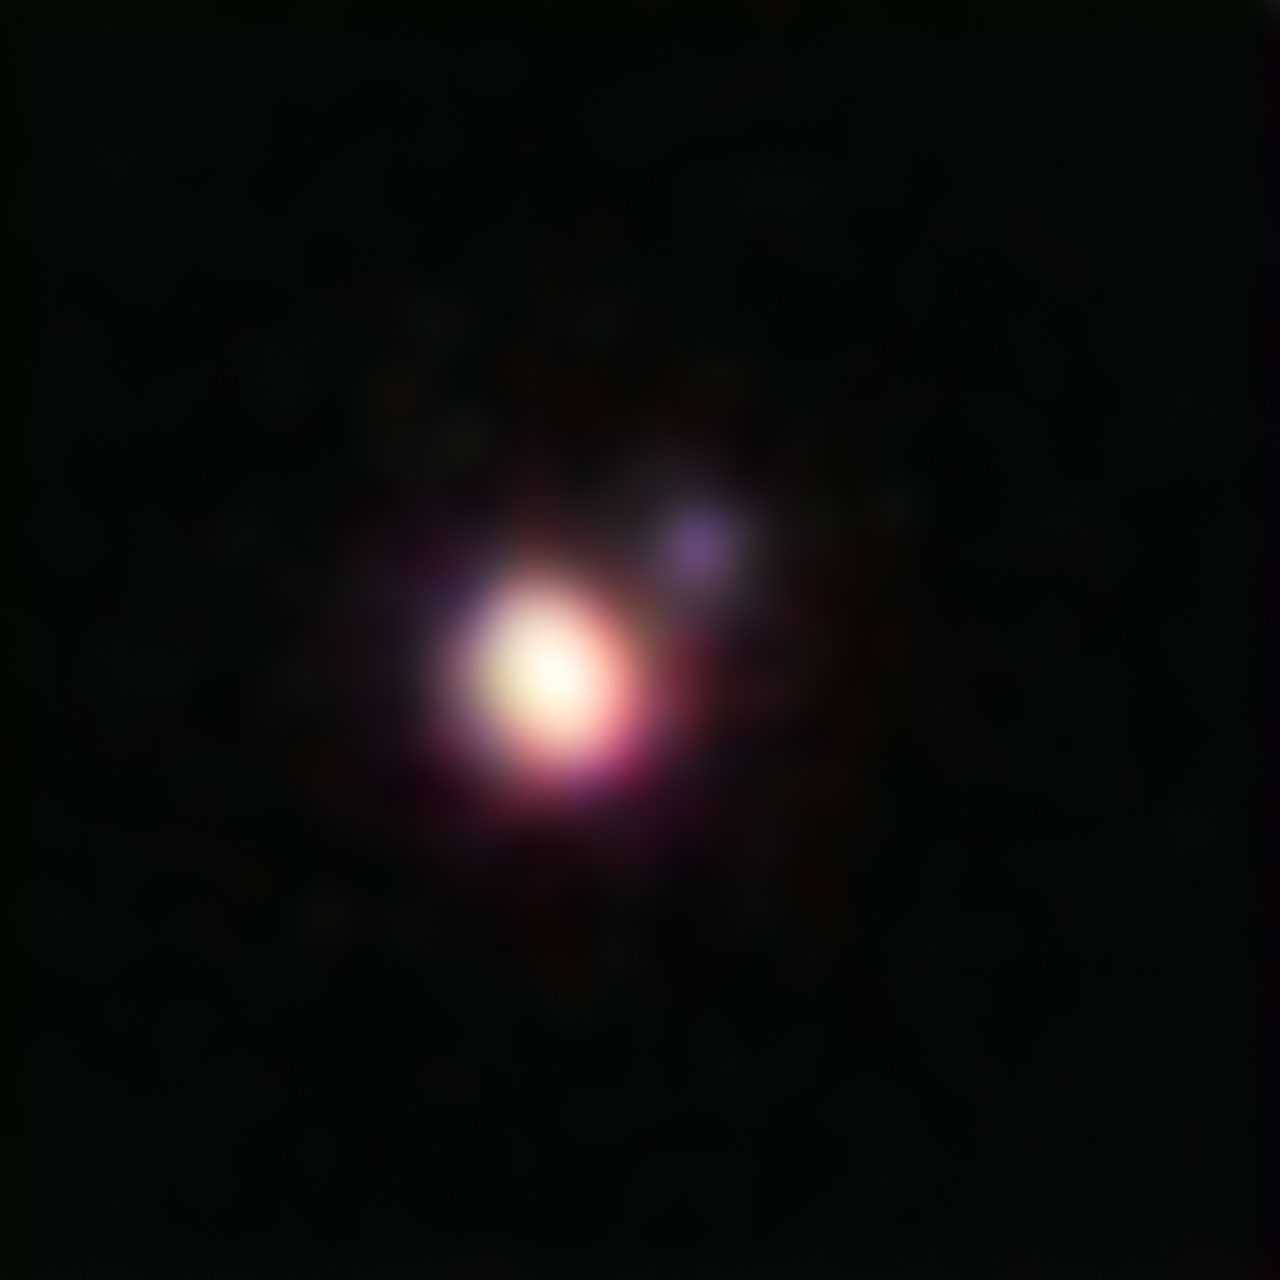
Michael Liu, University of Hawaii
These two objects, called CFBDSIR J1458+101 A and B, lurk 75 light years away in the constellation Bootes just below Arcturus; a star marking one of the constellation’s knee. Both objects – called Brown Dwarfs – are locked in orbit with each other, with the distance between them about 2.6 AU or 388, 954, 800 Kilometres.
Brown Dwarfs are often known as ‘failed stars’. They’re objects not much bigger than a gas giant, with the smaller dwarfs weighing in at 13 times the mass of Jupiter and the largest just below 0.08 solar masses; the mass of the smallest main sequence stars. They aren’t planets however, as, unlike planets, they form just like any other star – out of the interstellar medium, but because of their low mass they can never undergo any sustainable fusion.
The object of interest in Budgie’s OOTD is the dimmest object of the pair. With a meagre temperature of 370 K (about 96 Centigrade) it’s as hot as a fresh cup of tea, making it the coolest brown dwarf on record!
The paper on the discovery of this dwarf is here.
How shall I classify thee? Let me count the ways…
Although classifying with Galaxy Zoo doesn’t rely on it explicitly, many participants soon learn about Edwin Hubble’s system of classifying galaxies. More precisely, his system of classifying blue-filtered images of galaxies, because that’s what was available when he did his work. His system is often summarized in the tuning-fork diagram, showing how the properties of central bulges and spiral arms change systematically along a sequence from ellipticals through S0 galaxies (which he hypothesized, but could only be identified later), and both barred and ordinary spirals of types Sa and SBa through Sc and SBc. What has given Hubble’s classification such staying power is that (to our enormous good fortune) many galaxy characteristics of physical importance – star-formation history, gas and dust content, stellar dynamics – all correlate well with something that is, after all an eyeball estimate based on how much a galaxy looks like one of a set of “standard” galaxies.
Might we have selected other features to key on? This is more than a rhetorical question – additional systems of galaxy classification have been suggested over the years, either parallel to Hubble’s or incorporating refinements to describe additional features. Some of these have largely been added to the Hubble types in wide use, some have given us a few additional descriptions such as N and cD galaxies, and some remain islands of specialist interest.
Probably the most influential of these refinements came from Gerard de Vaucouleurs, who made several important additions. First, he recognized a continuous sequence right past the Sc galaxies to irregular systems – to Sd, and then to disk galaxies organized as well (or as poorly) as the Large Magellanic Cloud Sm, and finally to completely disorganized irregulars I. Each of these came in both barred and nonbarred forms. Speaking of bars, de Vaucouleurs looked at the central regions of galaxies and found that there were strong bars, nonbarred galaxies, and small or weak bars. One more parameter. Also, spiral arms can either spring out from the core like an S or from a ring, or a combination. He denoted nonbarred spirals as SA, barred spirals as SB, and intermediate (weakly barred) galaxies as SAB. For the core, an inner ring would be (r), core spiral (s), and combination (rs). Then he added a stage letter like Hubble’s, but now extended past Sc as far as Sm – so, as an example, his estimate for the Milky Way’s type is SB(rs)bc.
These distinctions are easiest to recognize in the middle of the spiral sequence, so de Vaucouleurs introduced the idea of a 3-dimensional classification volume, of which Hubble’s tuning fork is a sort of cross section parallel to one axis. The Reference Catalog of Bright galaxies by him and colleagues showed what was described as an artist’s depiction of a slice across the classification volume for Sb galaxies. (Years later, de Vaucouleurs’ one-time student Ron Buta found that the artist had been de Vaucouleurs himself, on a cloudy night at McDonald Observatory.)
Ron also told me that each of these was recognizably based on a bright galaxy, a challenge I could hardly let pass. Here’s what I came up with from memory (not all are in the SDSS).
SA(rs) NGC 3486
SA(s) NGC 1566
SB(s) NGC 1300
SB(r) NGC 5921
SAB(rs) NGC 4303
(I’m still waiting to get my test score on those).
Rings also occur in the outer parts of galaxies – de Vaucouleurs noted these and designated them by an initial R or (R) – the latter is a pseudoring, actually formed by tightly wound spiral arms. Rings are important, wherever they occur, because they show us where there is a resonance between the orbital speeds of stars in the disk and global pattern, which can move stars (and interstellar matter) radially within the galaxy. They are often associated with bars; one working idea for strong rings without a bar is that the bar itself was finally dissolved as the ring strengthened over time.
de Vaucouleurs also noted that not all elliptical and lenticular galaxies are identical. Some ellipticals have more or less extended outer starlight distributions than typical, and S0s can be grouped depending on how prominent the disk of stars is, and how much dust (and by inference gas) remains in the disk – from the most elliptical like S0– syses through, S0 to S0+, which are most like Sa spirals. Examples are (respectively) NGC 3115, 5866, and 4710.
Almost by accident, de Vaucouleurs introduced a numerical coding of his types for his First Reference Catalog, which was (noteworthy for its time) typeset from computer-printer output, For easy sorting and legibility, he added a coding of each type in easy-to-read form for a computer, including a type index T – T=-4 for ellipticals, 0 for a S0+, 1 for Sa, 3 for Sb, and so on to 10 for irregular. This has proven to be a very useful variable in innumerable data plots ever since.
Some of these refinements, especially the spiral/ring/bar distinctions, are so informative that many people add them to Hubble types. This isn’t exactly right – the two sets of types are not defined in quite the same way. In polishing Hubble’s original system, Allan Sandage often based the spiral types Sa-Sb-Sc on how much resolved detail showed up in high-quality photographs from Mt. Wilson or Palomar, while de Vaucouleurs, often working from material of lower quality for galaxies father away, used more global quantities such as the pitch angle of spiral arms. It’s too late to stop the hybridization, just because it has proven so useful.
Sidney van den Bergh not only considered the structures of galaxies, but their distances and thus luminosities, to add additional wrinkles to the classification puzzle. Close examination of galaxies in clusters led him to suggest that perhaps the tuning fork should be a trident, with a separate tine for disk galaxies with weak, ghostly spiral structure and low rates of star formation (anemic galaxies, which could be denoted Aa, Ab, Ac by analogy with the S and SB classes in Hubble’s system). This leads into a whole slew of arguments about S0 galaxies, how many kinds there are, and how many pathways for a spiral to end up that way.
More lasting has been van den Bergh’s finding that there is an overall (albeit rough) correlation between the brightness and continuity of the arms and the overall luminosity of spiral galaxies. He distinguished various luminosity classes, from the most luminous (I) to least luminous (V). Despite having the name “luminosity”, these classes are assigned strictly from examination of the galaxy structure (like other morphological classes). If these classes were very strongly correlated with luminosity, you could even use them as a kind of distance estimator. And up to a point, this works; its most lasting impact has been the recognition of Sc I galaxies, particularly large and luminous spirals with prominent grand-design spiral patterns, which are indeed as a class very luminous. Some familiar examples of Sc I galaxies are M100 and M101. Vera Rubin used this category in an early (and controversial) study of bulk motions in the local Universe. The luminosity classes proved useful enough that Allan Sandage incorporated them in the classifications in the Revised Shapley-Ames Catalog and the giant NASA galaxy atlas in the mid-1980s. Revisiting this identification of the prominence of spiral structure as a facet of spiral galaxies (which is independent, in principle, of whether it’s Sa, Sb, barred or whatever), Debra and Bruce Elmegreen assigned arm classes to galaxies – from 1 for a galaxy with only a few disconnected bits of spiral, to 12 for galaxies with two long, dominant spiral arms.
W.W. Morgan, better known as the M in the MK classification of stellar spectra, proposed a galaxy-classification system (the Yerkes classes) which explicitly recognized the usual correlation between galaxy structures and their colors (or at least characteristic spectral lines). He considered form families – ordinary spirals S, barred spirals B, ellipticals E, other kinds of symmetric galaxies not quite sharing the brightness concentration of ellipticals D, and galaxies strongly dominated by their nucleus N. In place of a stage a,b,c… he used the equivalent stellar spectral type of most galaxies sharing a given degree of central concentration – the most concentrated galaxies, typically ellipticals, were k, the least concentrated (ratty spirals and irregulars) were type a. Finally he added a shape class, which for spirals tells us the inclination – 7 is edge-on, 1 is face-on. So a galaxy like M86, a giant elliptical in the Virgo cluster, would be kE2, while the edge-on and rather disorganized spiral NGC 4631 would be afS7 (af denoting something in between classes a and f). Despite looking a bit like stellar spectral types, here again, the types are assigned purely from the galaxy’s appearance on images. The most-used pieces of the Yerkes classification have been N galaxies, for many AGN hosts where the nucleus outshines the galaxy, and cD galaxies, the largest normal galaxies (c comes from an old designation for the sharp spectral lines which indicate that a star is a supergiant). One of the best-known cD galaxies is IC 1101 at the center of the cluster Abell 2029, seen here in the SDSS:
In spirit, some of Morgan’s approach has lived in in much of the recent work in quantitative classification, in which a galaxy is described straightforwardly only by various numerical parameters of its image – light concentration, characteristic brightness, shape, and so on. Sure, computers can do that very well – but is that enough?
Boris Vorontsov-Velyaminov (alias VV) used a rather iconoclastic classification scheme, based on close and extensive inspection of the prints of the Palomar Sky Survey. He noted such exotica as gamma forms (where one spiral arm appears to wind opposite the others), whether the two “handles” of an edge-on galaxy matched or not, whether a ring was broken or complete, and so on. His types are highly descriptive, but can’t easily fall into continuous sequences. And with the arrival of digitized catalogs, it didn’t help that he availed himself of not only the Roman alphabet, but mirror-reversed Roman letters and italics (not even getting into Cyrillic characters, oddly enough). On top of all that, his catalog listed galaxies with running numbers according to which plate of the sky survey their image was found on. For these reasons, his classification has found much less wide use than has the VV catalog of interacting galaxies, for which he did the first reasonably complete sky survey from the Palomar pictures.
All these different ways of sorting galaxies face us with a key question – what are the important features of galaxies that we ought to catalog? Some details of spiral patterns surely come, go, and change form, while the forms of ellipticals and spiral bulges are very long-lasting. Where should we draw the line? And all these classification systems are set up to work for images take in the optical window of the spectrum. What would we have come up with if we looked at galaxies in the infrared or ultraviolet, or bands even more exotic? That’s one of the questions that enter into Hubble Zoo, and deserves its own discussion…
365 Days of Astronomy Podcast – Do Bars Kill Spirals?
 The podcast today over at 365 Days of Astronomy is “Galaxy Zoo 2 – Do Bars Kill Spirals?” by Chris and me. We had great fun talking about the first result from Galaxy Zoo 2 – that bars are more common in redder (deader?) spirals. Hope you enjoy listening to it.
You can read more about that project in the previous blog posts about it.
