
Cuppa Dwarf
This Week’s OOTW features Budgieye’s OOTD posted on the 1st of April 2011.
Michael Liu, University of Hawaii
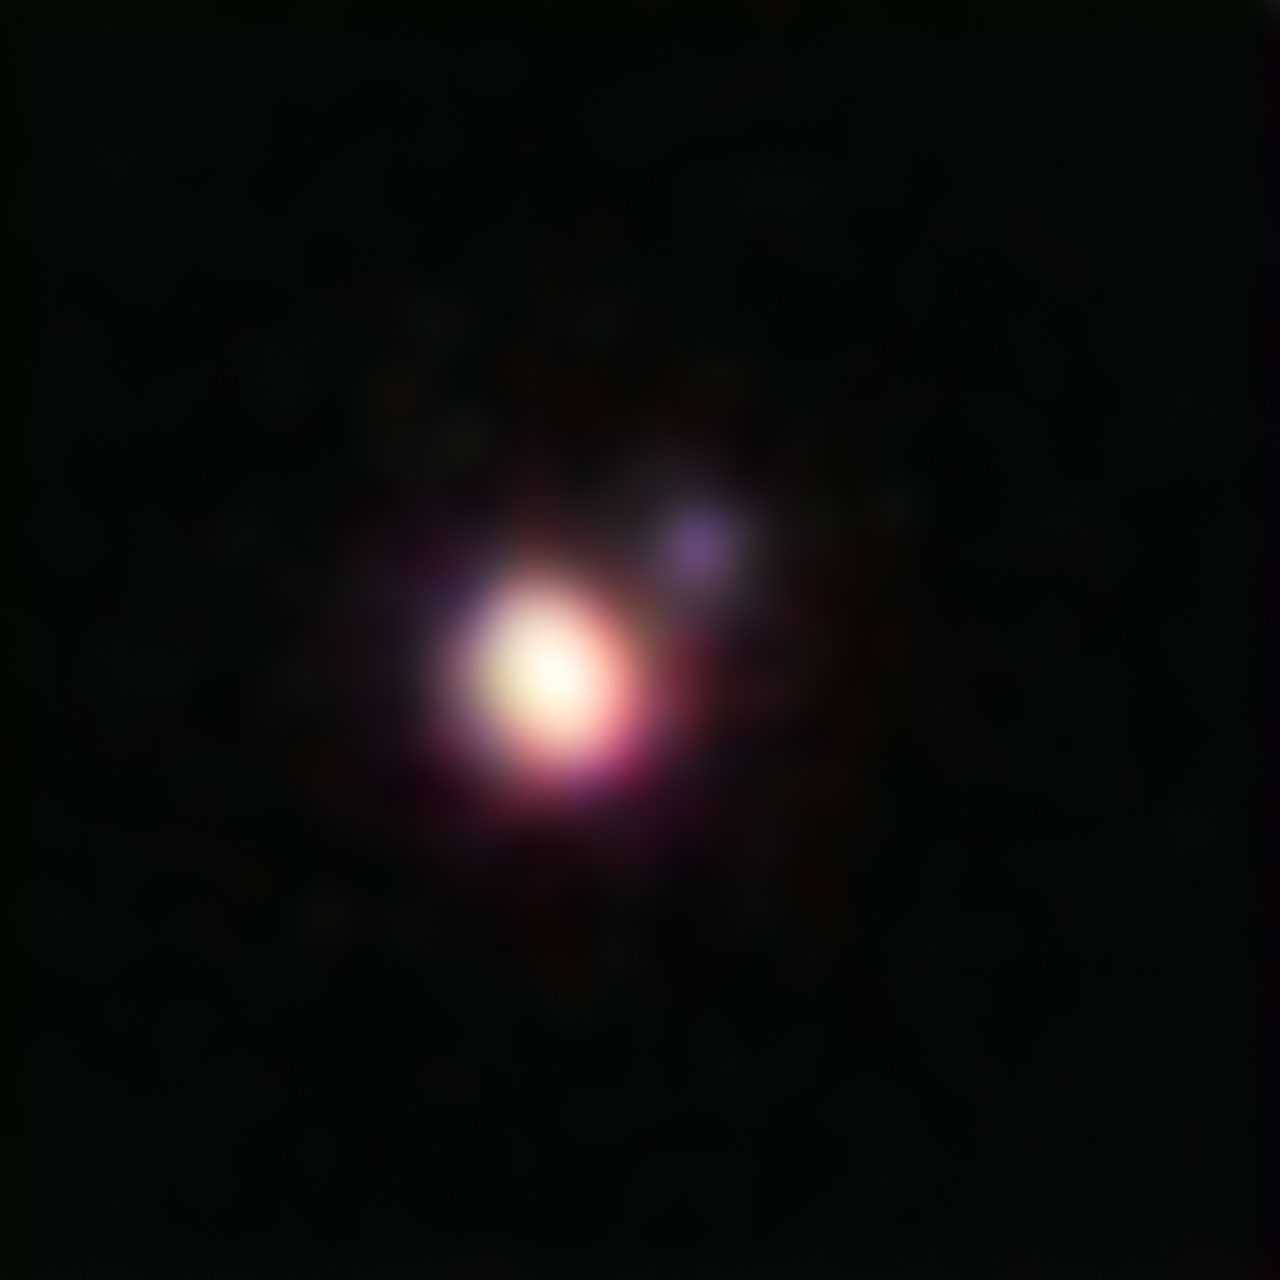
These two objects, called CFBDSIR J1458+101 A and B, lurk 75 light years away in the constellation Bootes just below Arcturus; a star marking one of the constellation’s knee. Both objects – called Brown Dwarfs – are locked in orbit with each other, with the distance between them about 2.6 AU or 388, 954, 800 Kilometres.
Brown Dwarfs are often known as ‘failed stars’. They’re objects not much bigger than a gas giant, with the smaller dwarfs weighing in at 13 times the mass of Jupiter and the largest just below 0.08 solar masses; the mass of the smallest main sequence stars. They aren’t planets however, as, unlike planets, they form just like any other star – out of the interstellar medium, but because of their low mass they can never undergo any sustainable fusion.
The object of interest in Budgie’s OOTD is the dimmest object of the pair. With a meagre temperature of 370 K (about 96 Centigrade) it’s as hot as a fresh cup of tea, making it the coolest brown dwarf on record!
The paper on the discovery of this dwarf is here.
How shall I classify thee? Let me count the ways…
Although classifying with Galaxy Zoo doesn’t rely on it explicitly, many participants soon learn about Edwin Hubble’s system of classifying galaxies. More precisely, his system of classifying blue-filtered images of galaxies, because that’s what was available when he did his work. His system is often summarized in the tuning-fork diagram, showing how the properties of central bulges and spiral arms change systematically along a sequence from ellipticals through S0 galaxies (which he hypothesized, but could only be identified later), and both barred and ordinary spirals of types Sa and SBa through Sc and SBc. What has given Hubble’s classification such staying power is that (to our enormous good fortune) many galaxy characteristics of physical importance – star-formation history, gas and dust content, stellar dynamics – all correlate well with something that is, after all an eyeball estimate based on how much a galaxy looks like one of a set of “standard” galaxies.
Might we have selected other features to key on? This is more than a rhetorical question – additional systems of galaxy classification have been suggested over the years, either parallel to Hubble’s or incorporating refinements to describe additional features. Some of these have largely been added to the Hubble types in wide use, some have given us a few additional descriptions such as N and cD galaxies, and some remain islands of specialist interest.
Probably the most influential of these refinements came from Gerard de Vaucouleurs, who made several important additions. First, he recognized a continuous sequence right past the Sc galaxies to irregular systems – to Sd, and then to disk galaxies organized as well (or as poorly) as the Large Magellanic Cloud Sm, and finally to completely disorganized irregulars I. Each of these came in both barred and nonbarred forms. Speaking of bars, de Vaucouleurs looked at the central regions of galaxies and found that there were strong bars, nonbarred galaxies, and small or weak bars. One more parameter. Also, spiral arms can either spring out from the core like an S or from a ring, or a combination. He denoted nonbarred spirals as SA, barred spirals as SB, and intermediate (weakly barred) galaxies as SAB. For the core, an inner ring would be (r), core spiral (s), and combination (rs). Then he added a stage letter like Hubble’s, but now extended past Sc as far as Sm – so, as an example, his estimate for the Milky Way’s type is SB(rs)bc.
These distinctions are easiest to recognize in the middle of the spiral sequence, so de Vaucouleurs introduced the idea of a 3-dimensional classification volume, of which Hubble’s tuning fork is a sort of cross section parallel to one axis. The Reference Catalog of Bright galaxies by him and colleagues showed what was described as an artist’s depiction of a slice across the classification volume for Sb galaxies. (Years later, de Vaucouleurs’ one-time student Ron Buta found that the artist had been de Vaucouleurs himself, on a cloudy night at McDonald Observatory.)
Ron also told me that each of these was recognizably based on a bright galaxy, a challenge I could hardly let pass. Here’s what I came up with from memory (not all are in the SDSS).
SA(rs) NGC 3486
SA(s) NGC 1566
SB(s) NGC 1300
SB(r) NGC 5921
SAB(rs) NGC 4303
(I’m still waiting to get my test score on those).
Rings also occur in the outer parts of galaxies – de Vaucouleurs noted these and designated them by an initial R or (R) – the latter is a pseudoring, actually formed by tightly wound spiral arms. Rings are important, wherever they occur, because they show us where there is a resonance between the orbital speeds of stars in the disk and global pattern, which can move stars (and interstellar matter) radially within the galaxy. They are often associated with bars; one working idea for strong rings without a bar is that the bar itself was finally dissolved as the ring strengthened over time.
de Vaucouleurs also noted that not all elliptical and lenticular galaxies are identical. Some ellipticals have more or less extended outer starlight distributions than typical, and S0s can be grouped depending on how prominent the disk of stars is, and how much dust (and by inference gas) remains in the disk – from the most elliptical like S0– syses through, S0 to S0+, which are most like Sa spirals. Examples are (respectively) NGC 3115, 5866, and 4710.
Almost by accident, de Vaucouleurs introduced a numerical coding of his types for his First Reference Catalog, which was (noteworthy for its time) typeset from computer-printer output, For easy sorting and legibility, he added a coding of each type in easy-to-read form for a computer, including a type index T – T=-4 for ellipticals, 0 for a S0+, 1 for Sa, 3 for Sb, and so on to 10 for irregular. This has proven to be a very useful variable in innumerable data plots ever since.
Some of these refinements, especially the spiral/ring/bar distinctions, are so informative that many people add them to Hubble types. This isn’t exactly right – the two sets of types are not defined in quite the same way. In polishing Hubble’s original system, Allan Sandage often based the spiral types Sa-Sb-Sc on how much resolved detail showed up in high-quality photographs from Mt. Wilson or Palomar, while de Vaucouleurs, often working from material of lower quality for galaxies father away, used more global quantities such as the pitch angle of spiral arms. It’s too late to stop the hybridization, just because it has proven so useful.
Sidney van den Bergh not only considered the structures of galaxies, but their distances and thus luminosities, to add additional wrinkles to the classification puzzle. Close examination of galaxies in clusters led him to suggest that perhaps the tuning fork should be a trident, with a separate tine for disk galaxies with weak, ghostly spiral structure and low rates of star formation (anemic galaxies, which could be denoted Aa, Ab, Ac by analogy with the S and SB classes in Hubble’s system). This leads into a whole slew of arguments about S0 galaxies, how many kinds there are, and how many pathways for a spiral to end up that way.
More lasting has been van den Bergh’s finding that there is an overall (albeit rough) correlation between the brightness and continuity of the arms and the overall luminosity of spiral galaxies. He distinguished various luminosity classes, from the most luminous (I) to least luminous (V). Despite having the name “luminosity”, these classes are assigned strictly from examination of the galaxy structure (like other morphological classes). If these classes were very strongly correlated with luminosity, you could even use them as a kind of distance estimator. And up to a point, this works; its most lasting impact has been the recognition of Sc I galaxies, particularly large and luminous spirals with prominent grand-design spiral patterns, which are indeed as a class very luminous. Some familiar examples of Sc I galaxies are M100 and M101. Vera Rubin used this category in an early (and controversial) study of bulk motions in the local Universe. The luminosity classes proved useful enough that Allan Sandage incorporated them in the classifications in the Revised Shapley-Ames Catalog and the giant NASA galaxy atlas in the mid-1980s. Revisiting this identification of the prominence of spiral structure as a facet of spiral galaxies (which is independent, in principle, of whether it’s Sa, Sb, barred or whatever), Debra and Bruce Elmegreen assigned arm classes to galaxies – from 1 for a galaxy with only a few disconnected bits of spiral, to 12 for galaxies with two long, dominant spiral arms.
W.W. Morgan, better known as the M in the MK classification of stellar spectra, proposed a galaxy-classification system (the Yerkes classes) which explicitly recognized the usual correlation between galaxy structures and their colors (or at least characteristic spectral lines). He considered form families – ordinary spirals S, barred spirals B, ellipticals E, other kinds of symmetric galaxies not quite sharing the brightness concentration of ellipticals D, and galaxies strongly dominated by their nucleus N. In place of a stage a,b,c… he used the equivalent stellar spectral type of most galaxies sharing a given degree of central concentration – the most concentrated galaxies, typically ellipticals, were k, the least concentrated (ratty spirals and irregulars) were type a. Finally he added a shape class, which for spirals tells us the inclination – 7 is edge-on, 1 is face-on. So a galaxy like M86, a giant elliptical in the Virgo cluster, would be kE2, while the edge-on and rather disorganized spiral NGC 4631 would be afS7 (af denoting something in between classes a and f). Despite looking a bit like stellar spectral types, here again, the types are assigned purely from the galaxy’s appearance on images. The most-used pieces of the Yerkes classification have been N galaxies, for many AGN hosts where the nucleus outshines the galaxy, and cD galaxies, the largest normal galaxies (c comes from an old designation for the sharp spectral lines which indicate that a star is a supergiant). One of the best-known cD galaxies is IC 1101 at the center of the cluster Abell 2029, seen here in the SDSS:
In spirit, some of Morgan’s approach has lived in in much of the recent work in quantitative classification, in which a galaxy is described straightforwardly only by various numerical parameters of its image – light concentration, characteristic brightness, shape, and so on. Sure, computers can do that very well – but is that enough?
Boris Vorontsov-Velyaminov (alias VV) used a rather iconoclastic classification scheme, based on close and extensive inspection of the prints of the Palomar Sky Survey. He noted such exotica as gamma forms (where one spiral arm appears to wind opposite the others), whether the two “handles” of an edge-on galaxy matched or not, whether a ring was broken or complete, and so on. His types are highly descriptive, but can’t easily fall into continuous sequences. And with the arrival of digitized catalogs, it didn’t help that he availed himself of not only the Roman alphabet, but mirror-reversed Roman letters and italics (not even getting into Cyrillic characters, oddly enough). On top of all that, his catalog listed galaxies with running numbers according to which plate of the sky survey their image was found on. For these reasons, his classification has found much less wide use than has the VV catalog of interacting galaxies, for which he did the first reasonably complete sky survey from the Palomar pictures.
All these different ways of sorting galaxies face us with a key question – what are the important features of galaxies that we ought to catalog? Some details of spiral patterns surely come, go, and change form, while the forms of ellipticals and spiral bulges are very long-lasting. Where should we draw the line? And all these classification systems are set up to work for images take in the optical window of the spectrum. What would we have come up with if we looked at galaxies in the infrared or ultraviolet, or bands even more exotic? That’s one of the questions that enter into Hubble Zoo, and deserves its own discussion…
365 Days of Astronomy Podcast – Do Bars Kill Spirals?
 The podcast today over at 365 Days of Astronomy is “Galaxy Zoo 2 – Do Bars Kill Spirals?” by Chris and me. We had great fun talking about the first result from Galaxy Zoo 2 – that bars are more common in redder (deader?) spirals. Hope you enjoy listening to it.
You can read more about that project in the previous blog posts about it.
Pretty galaxies on the BBC Big Screens
As part of National Science and Engineering Week, 11-20th March 2011 in the UK I was involved in the production of a series of 5 short videos called “From the Earth to the Edge of the Universe” which were made as a collaboration between Creative Technologies and the Institute of Cosmology and Gravitation at the University of Portsmouth. They are going on the BBC Big Screens, apparently right across the UK and continuing up until the 2012 Olympics.
Bear with me, this isn’t just an advert. The reason for the post is that my segment is all about galaxy morphologies. I talk (briefly) about Galaxy Zoo and show the HST image of Hanny’s Voorwerp. I also describe some of the main morphological features of galaxies, and what I like about them. So I thought you might like to watch it (sorry I can’t figure out how to embed it – the below is just a screen shot).
Karen – From Earth To The Edge Of The Universe from CCi Live on Vimeo.
You can watch all 5 videos here.
Cheers, Karen.
Simulated AGN: An Example
As a follow-up to my post describing the science behind simulating AGN for classification of their host galaxies, here is an example of one of the 116 galaxies that we used to create the 1740 simulated AGN in the sample.

Each galaxy was made into 15 different simulated AGN using 3 colors and 5 luminosity ratios.
If you’d like to see the full-size version, click on the image.
As some of you have pointed out, the cases where the simulated AGN is as bright as or brighter than the host galaxy do look a little like, well, simulations. But hopefully that doesn’t significantly affect the main science question: how does its presence affect the classification of the underlying galaxy (if at all)?
As Carie mentioned in her recent post on this topic, the results from the classification of these simulated AGN will be posted shortly.
Motivation to Simulate AGN
In order to understand the accuracy of studies of AGN host galaxies, extensive simulations of host galaxy morphology are required.
This is discussed in great more in two paper Pierce et al. 2010 (http://adsabs.harvard.edu/abs/2010MNRAS.408..139P) and Simmons & Urry 2008 (http://adsabs.harvard.edu/abs/2008ApJ…683..644S).
In the previous studies, the presence of a central brightness from an AGN does affect the measured properties of the AGN host galaxy, when that central point source becomes too bright. As Simmons and Urry wrote, “Results of these simulations are intended to inform data analysis of AGN host morphologies, to better infer intrinsic host galaxy shapes from fitted morphological parameters in the presence of a central point source”. In other words, by carefully modeling that effect we are able to use the information from the computer’s fits to study the host galaxy properties.
Stay tuned for more details about this from Brooke Simmons!
The Science Behind Classifying Simulated AGN
Hello Zooites,
This is a dual-purpose post: first, to introduce myself. My name is Brooke Simmons. I’m a graduate student in the final year of my PhD at Yale, and my scientific focus is on examining the co-evolution of supermassive black holes (SMBHs) and their host galaxies. My specialization is in the morphology of galaxies hosting active SMBHs, so naturally I’ve been very intrigued by the Galaxy Zoo project ever since it started. And I’m very impressed by the work that you all do. So when Chris and Carie asked me about simulating some AGN as part of the Galaxy Zoo project, I jumped at the chance. I have pretty extensive experience simulating AGN and host galaxies — more on that in a moment — and I was very excited to have the opportunity to extend that kind of science into the realm of Galaxy Zoo.
I heard later that there were some issues regarding the simulations, and that’s the other purpose of this post. I’d like to try and explain the reasons I think the simulations are important to the science being done in the Zooniverse, and clarify some of the details, if possible. I’m quite new here and I realize that there are many levels of experience reflected in the Zooite population, from newcomers to the field to those who are experienced at following up on objects of interest and searching the scientific literature. So I hope, in giving this science background, that those of you who have heard it before will bear with me, and those of you who haven’t (or, well, anyone really) will feel free to ask any questions that might come up.
In the field of galaxy evolution, it’s now clear there is some sort of mechanism that affects both the evolution of galaxies and the growth of their central black holes together, but we don’t really understand what it is (or what they are) — yet. In terms of scale, it’s rather incredible that they are connected at all. We may call them supermassive black holes, but they’re generally a small percentage of the total galaxy mass, and they’re absolutely tiny when compared to the size of the galaxy. I like to describe it in terms of a football match: the packed, somewhat chaotic crowd in the stands shouldn’t know or care what the ant right in the middle of the playing field is doing. Nor should the ant particularly be aware of how the cheering crowd is shifting and reacting. Yet it is well established that the crowd (the stars in the galaxy) and the ant (the central black hole) somehow know about each other.
How does this work? What forces (or combination of phenomena) act to influence both the single, massive point at the center of a galaxy and the billions of stars around it? Is it a one-sided influence, or is it a feedback mechanism that ends up causing them both to evolve in sync? The co-evolution of galaxies and black holes is one of the fundamental topics of galaxy evolution, and many questions remain unanswered. In order to try to answer these questions, we observe both central black holes and the galaxies that host them, at a variety of redshifts/lookback times, so that we can see how these two things evolve.
However, for all but very local galaxies, it’s very difficult to see a signal from a galaxy’s central SMBH amid all the stellar light from the galaxy. So, we turn to that subset of SMBHs that are actively accreting matter, which in turn heats up and discharges enormous amounts of energy as it falls into the gravitational potential of the black hole. Those, which we call active galactic nuclei (AGN), we can see much more easily, and out to very high redshift. They radiate across the whole of the electromagnetic spectrum, from radio to gamma rays. At optical wavelengths they are sometimes buried in dust and gas, which obscures their light and means they look identical to so-called “inactive” galaxies. But in other cases, the AGN are unobscured or only partially obscured, and then they are extremely bright — so much so that they can far outshine the rest of the galaxy.
So, looking at the central SMBHs of inactive galaxies is impossible for very distant galaxies, because the host galaxy swamps the dim signatures of the black hole. But looking at the hosts of active black holes (AGN) can be difficult too, because the AGN signal can swamp the host galaxy. It’s not impossible to disentangle the two in order to examine the host galaxy separately from the AGN, but it adds a level of complexity to the process. Morphological fitting programs executed by a computer do a reasonable job, but actually — as you all know — the human brain is excellent at this kind of pattern recognition. You all can clearly tell the difference between a host galaxy and its central AGN, to the point where many of you have been following up your classified objects and identifying spectral features of AGN. That is so impressive!
In fact, what you collectively do is new and different and in many ways a significant improvement over “parametric” methods that use automated computer codes to fit galaxy morphology models to images. Those have their uses, too, of course, but you all pick up nuances that parametric methods simply miss. And part of what that means is that the data we have on how the presence of an AGN (bright or faint) affects morphological classification may or may not apply to your work. Within the automatic fitting programs, there are subtle effects that can occur. For example, a small galaxy bulge may look the same to a parametric fitting routine as a central AGN, with the consequence that it may think it has found one when in fact it’s the other. Or, when both a small bulge and a central AGN are present, a computer code to fit the morphology might be more uncertain about how much luminosity goes with each component. I know all this because it has now been studied for automated/parametric morphology fitting codes:
- Sànchez et al. (2004) is mainly a data analysis paper on AGN host galaxies, but contains a subsection on simulations;
- Simmons & Urry (2008) is a paper describing two sets of AGN host simulations that combine for over 50,000 simulated galaxies (yes, that Simmons is me);
- Gabor et al. (2009) is another data analysis paper that contains AGN host simulations; and
- Pierce et al. (2010) is a dedicated simulations paper with a smaller sample than Simmons & Urry, but which also extends the analysis to host galaxy colors.
All of this analysis was undertaken with Hubble data, much like the images of simulated AGN that have been incorporated into Galaxy Zoo. These are small effects that only impact a fraction of classifications, but the simulations are crucial because they both let us know the limits of our classification methods and, just as importantly, enable us to quantify precisely how confident we are that the classifications are accurate. The parametric methods are very accurate, but it is absolutely essential that we find out just how the presence of an AGN affects classification in this setting, which is of course quite different.
It’s always exciting for a scientist to say “I don’t know the answer, but I know how we can find out.” And in this case, that means extending the simulations that we have done to the case of visual classification. There are a few ways to simulate AGN, but the key process is to create a situation where the analysis takes place on a known quantity so that you can compare what you know to what the analysis finds. In this case (which is similar in method to the first set of simulations in Simmons & Urry), that means:
- Start with a set of galaxies for which we know the initial “answer,” i.e., the morphology;
- Add a simulated signal from a central SMBH, using a wide range of luminosity ratios between galaxy and SMBH, and a range of AGN colors;
- Repeat the classification process in exactly the same way as for the initial set of galaxies, to see if the answers change.
Now, it may be that the answers change in some subtle way, as they do when the morphological analysis is done by a computer. If that’s the case, then the analysis quantifies that effect so that we can understand it and account for it. Or, it may be that you see right through it — and if so, that’s great! If you look at a galaxy with an AGN and say, “of course I can tell that that galaxy has an AGN in it, and I can still classify the galaxy in the same way,” fantastic. It potentially means you all are doing better science than a traditional parametric analysis in yet another way. Either way, the answer is very useful.
I know this post is already quite long, but I think it’s important to make one other point about the simulations. When you’re simulating something like this to understand the effects of a new feature on analysis you think you understand very well, it’s very important to try to push the limits of that analysis. In this case, that means simulating AGN that are both so faint that there’s pretty much no way you could possibly see them in their host galaxies, and so bright that they will be blindingly obvious to anyone paying attention.
And you all are most definitely paying attention. In reading comments on other blog posts, I saw that some Zooites were displeased with the way the very brightest simulated AGN looked strange, and even artificial. And I know there were some communication issues regarding the release of the simulations; for that I apologize. Actually, though, knowing which objects you found odd is a part of the science, too. Simulations like this can be used not only to understand the science of determining galaxy morphology, but also to understand the science of separating the AGN itself for later analysis — as I said earlier, both are needed to understand the co-evolution of black holes and galaxies. So questions like, “when does the AGN get lost in the galaxy?” and “when does the AGN totally overtake the galaxy?” are vital. It is also definitely the case that we were pushing the limits of not just the classification, but also of the software that is used to make the simulated AGN. That’s why the very brightest of them look a bit… weird. I do think the science is still possible even if it’s clear that it’s a simulation on first glance, and I really appreciate your patience with both me and the software on that issue.
By the way, I have a feeling you all are going to turn out to be considerably better at classifying galaxies with AGN in them than the computer is, but of course that’s just my hypothesis — it’s important to actually go through the process of classifying simulated galaxies. That way, when someone comes up to us and says, but how do you know all these citizen scientists are really that accurate? AGN can have a subtle effect on the fitted morphologies of galaxies, after all, we can say, “but we do know they’re that accurate — and here’s how we know.”
Thanks all for reading — if you got this far, that probably deserves an award in itself — and please feel free to ask any questions you might have. If you have a concern that you feel I didn’t address, please let me know that as well. I would very much appreciate your input!
Simulating AGN
Since there was so much interest our quest to understand how the presence of an AGN influences the classification of the host galaxy morphologies, I’m going to expand on that topic here.
AGN in nature come with a large variety of luminosities. Some are so bright that we cannot even tell they are inside of a large galaxy (so-called Quasars) and some are so faint that we have no way of detecting their presence in our data. The AGN that I have been studying are somewhere in between these two extreme cases. So we were wondering how much a bright-ish point source might alter our ability to determine the host galaxies classifications. (Note: this is not an issue of the ability of Zooites to classify galaxies, but a question of when the brightness of the central AGN begins to hide or distort the visible features of the galaxy.)
Here are a few of the actual AGN from the HST images: I would not be able to identify these as AGN just from the images and for some of them – not even the spectra reveal the presence of the AGN.
We teamed up with Brooke Simmons, a PhD student at Yale and an expert image analyzer to create these images. We selected 116 normal galaxies (with no AGN) and then added a central point source of varying brightness to each. We selected the brightness of point sources to cover the range of the types of AGN that are found in the deep Hubble surveys. All together using the 116 normal galaxies with the sampled range of AGN luminosities, we ended up with 1740 total simulated AGN galaxies.
Stay tuned: we’ll be posting the results from these classifications shortly.
Taffy Bridges
This week’s OOTW features an OOTD posted by Lightbulb500 on the 22nd of February 2011.

Lurking in the constellation Pegasus is this beautiful pair of active galaxies. Their catalogue names are UGC 12914 and UGC 12915, and their more imaginative name is the Taffy Galaxies.
In the words of Lightbulb:
The galaxies are located around 60 megaparsecs from Earth (or 196 million light years).
Both were once normal spiral galaxies, but are now in the midst of a high speed collision that has already stripped them of most of their hydrogen gas.
The pair will likely merge together at some point in the future.
What earns this pair their ‘Taffy’ designation is quite unusual. There is a bridge of hydrogen gas linking the two galaxies that is emitting large quantities of radio waves and is also producing at least a few stars. It is the presence of this intergalatic gas bridge that makes these Taffy galaxies.
While searching around for info I came across an interesting paper on this galaxy pair by J Braine et al (PDF here); it’s well worth a read. According to the paper, the galaxies collided more or less head on 20 million years ago, creating that widening bridge composed of anything between 2-9 x 10^9 solar masses of interstellar gas! The green tint in between the galaxies would be from H-alpha emissions, showing where the bridge is churning out newborn stars, or, where the collision sent out shockwaves, ionizing parts of the bridge.
The Hubble Tuning Fork
The gold standard for galaxy classification among professional astronomers is of course the Hubble classification. With a few minor modifications, this classification has stood in place for almost 90 years. A description of the scheme which Hubble calls “a detailed formulation of a preliminary classification presented in an earlier paper” (an observatory circular published in 1922) can be found in his 1926 paper “Extragalactic Nebulae” which is pretty fun to have a look at.
Hubble’s classification is often depicted in a diagram – something which is probably familiar to everyone who has taken an introductory astronomy course. Astronomers call this diagram the “Hubble Tuning Fork”. I have been meaning for a while to make a new version of the Hubble tuning fork based on the type of images which were used in Galaxy Zoo 1 and 2 (OK the prettiest ones I could find – these are not typical at all). Anyway here it is. The Hubble Tuning Fork as seen in colour by the Sloan Digital Sky Survey:

I should say that my choice of galaxies for the sequence owes a lot of credit to an excellent Figure illustrating galaxy morphologies in colour SDSS images which can be found in this article on Galaxy Morphology (arXiV link) written by Ron Buta from Alabama (Figure 48). I strongly recommend that article if you’re looking for a thorough history of galaxy morphology.
Inspired by the “Create a Hubble Tuning Fork Diagram” activity provided by the Las Cumbres Observatory, I also provide below a blank version which you can fill in with your favourite Galaxy Zoo galaxies should you want to. I have to say though, the Las Cumbres version of the activity looks even more fun as they also talk you through how to make your own colour images of the galaxies to put on the diagram.

Anyway I hope you like my new version of the diagram as much as I do. Thanks for reading, Karen.
