
Announcing the Galaxy Zoo JWST project!
We are thrilled to announce the launch of the Galaxy Zoo JWST project, with ~300,000 galaxy images from the COSMOS-Web survey taken with NASA’s James Webb Space Telescope (JWST)! We now need your help identifying the shapes of these galaxies by classifying them on Galaxy Zoo. These classifications will help scientists answer questions about how the shapes of galaxies have changed over time, and what caused these changes and why.
As we look at more distant objects in the Universe, we see them as they were billions of years ago because light takes time to travel to us. With JWST able to spot galaxies at greater distances than ever before, we’re seeing what galaxies looked like early in the Universe for the first time. The shape of the galaxies we see then tells us about what a galaxy has been through in its lifetime: how it was born, how and when it has formed stars, and how it has interacted with its neighbours. By looking at how galaxy shapes change with distance away from us, we can work out which processes were more common at different times in the Universe’s history.
Image credit: COSMOS-Web / Kartaltepe / Casey / Franco / Larson / RIT / UT Austin / CANDIDE.
Now, with data from JWST, we’re able to look deeper into the cosmos and further back in cosmic time than ever before, investigating the wild and wonderful ancestors of the Milky Way and the galaxies which surround us in today’s Universe. Thanks to the light collecting power of JWST, there are now over 300,000 images of galaxies on the Galaxy Zoo website that need your help to classify their shapes. If you’re quick, you may even be the first person to see the distant galaxies you’re asked to classify. You will be asked several questions, such as ‘Is the galaxy round?’, or ‘Are there signs of spiral arms?’. These classifications are not only useful for the scientific questions we want to answer now, but also as a training set for Artificial Intelligence (AI) algorithms. Without being taught what to look for by humans, AI algorithms struggle to classify galaxies. But together, humans and AI can accurately classify limitless numbers of galaxies.
We here at Galaxy Zoo have developed our own AI algorithm called ZooBot (see this previous blog post for more detail), which will sift through the JWST images first and label the ‘easier ones’ where there are many examples that already exist in previous images from the Hubble Space Telescope. When ZooBot is not confident on the classification of a galaxy, perhaps due to complex or faint structures, it will show it to users on Galaxy Zoo to get their human classifications, which will then help ZooBot to learn more.

You might also notice a slight difference to the classification interface for this project. Each image has two main colour versions available to help you see different features in the galaxy. Both of these colours images are built from the four COSMOSweb filters (F115W, F150W, F277W, and F444W) but with two different scalings. On the right the scaling is set to reveal bright central features more clearly, while the lefthand version should reveal fainter outskirts. You can also see the original four single filter images if you’d like in the flip book (see the two circles below the centre of the two images). By providing all of these images we’re hoping that it’ll be easier for volunteers to classify the images, and allow us to extract the most information about a galaxy from each image.
We’re really excited about this project on the team, not least because it’s been in the pipeline for a long time! We have had two team meetings at the International Space Science Institute (ISSI) in Bern, Switzerland over the past year in preparation for this launch, so it’s great to be finally at this point. We’re particularly excited though because of the science that will be made possible thanks to this project. Given JWST’s incredible sensitivity to light (thanks to that beautifully large mirror!), we’ll be able to classify the shapes of galaxies out to much greater distances than ever before. This means we can see further back in time in the Universe’s history to trace how the shapes of galaxies have changed earlier in cosmic time. We’ve already taken a look at your classifications from the pilot JWST project we ran on ~9000 galaxy images from the CEERS survey (another JWST galaxies survey, that’s smaller then COSMOS-Web that’s launching today) and with your help we found disk galaxies and galaxies with bars out to greater distances than ever before. So with even more JWST galaxies now on the site, all of us on the team are buzzing with excitement thinking of all the new discoveries coming our way soon.
If you do decide to take part: THANK YOU! We appreciate every single click. Join us and classify now.
Bayesian View of Galaxy Evolution
The Universe is pretty huge, and to understand it we need to collect vast amounts of data. The Hubble Telescope is just one of many telescopes collecting data from the Universe. Hubble alone produces 17.5 GB of raw science data each week. That means since its launch to low earth orbit in April 1990, it’s collected roughly a block of data equivalent in size to 6 million mp3 songs! With the launch of NASA’s James Webb Telescope just around the corner – (a tennis court sized space telescope!), the amount of raw data we can collect from the Universe is going to escalate dramatically. In order to decipher what this data is telling us about the Universe we need to use sophisticated statistical techniques. In this post I want to talk a bit about a particular technique I’ve been using called a Markov-Chain-Monte-Carlo (MCMC) simulation to learn about galaxy evolution.
Before we dive in into the statistics let me try and explain what I’m trying to figure out. We can model galaxy evolution by looking at a galaxy’s star formation rate (SFR) over time. Basically we want know to how fast a particular galaxy is making stars at any given time. Typically, a galaxy has an initial constant high SFR then at a time called t quench (tq) it’s SFR decreases exponentially which is characterised by a number called tau. Small tau means the galaxy stops forming stars, or is quenched, more rapidly. So overall for each galaxy we need to determine two numbers tq and tau to figure out how it evolved. Figure 1 shows what this model looks like.
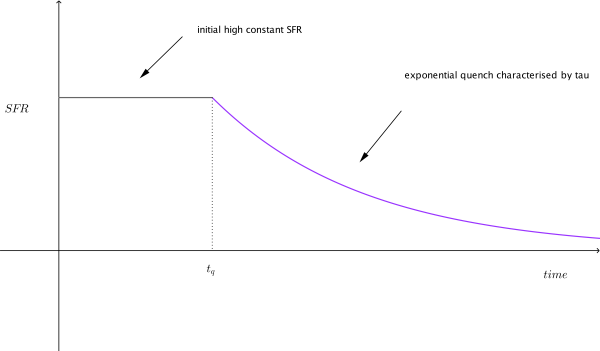
Figure 1: Model of a single galaxy’s SFR over time. Showing an initial high constant SFR, follow by a exponential quench at tq.
To calculate these two numbers, tq and tau, we look at the colour of the galaxy, specifically the UVJ colour I mentioned in my last post. We then compare this to a predicted colour of a galaxy for a specific value of tq and tau. The problem is that there are many different combinations of tq and tau, how to we find the best match for a galaxy? We use a MCMC simulation to do this.
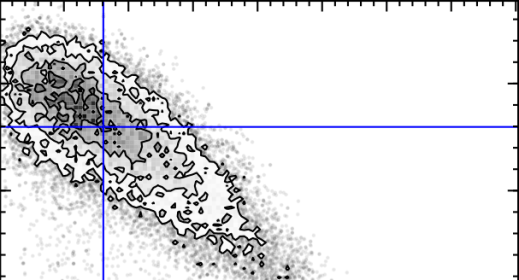
The first MC – Markov-Chain – just means an efficient random walk. We send “walkers” to have a look around for a good tq and tau, but the direction we send them to walk at each step depends on how good the tq and tau they are currently at is. The upshot of this is we quickly home in on a good value of tq and tau. The second MC – Monte Carlo – just picks out random values of tq and tau and tests how good they are by comparing the UVJ colours and our SFR model. Figure 2 shows a gif of a MCMC simulation of a single galaxy. The histograms shows the positions of the walkers searching the tq and tau space, and the blue crosshair shows the best fit value of tq and tau at every step. You can see the walkers homing in and settling down on the best value of tq and tau. I ran this simulation by running a modified version of the starpy code.
Figure 2: MCMC simulation for a single galaxy, pictured in the top right corner. Main plot shows density of walkers. Marginal histograms show 1D projections of walker densities. Blue crosshair shows best fit values of tq and tau at each step.
The maths that underpins this simulation is called Bayesian Statistics, and it’s quite a novel way of thinking about parameters and data. The main difference is that instead of treating unknown parameters as fixed quantities with associated error, they are treated as random variables described by probability distributions. It’s quite a powerful way of looking at the Universe! I’ve left all of the gory maths detail about MCMC out but if you’re interested an article by a DPhil student here at Oxford does are really good job of explaining it here.
So how does this all relate to galaxy morphology, and Galaxy Zoo classifications? I’m currently running the MCMC simulation showing in Figure 2 over the all the galaxies in the COSMOS survey. This is really cool because apart from getting to play with the University of Oxford’s super computer (544 cores!), I can use galaxy zoo morphology to see if the SFR of a galaxy over time is dependent on the galaxy’s shape, and overall learn what the vast amount of data I have says about galaxy evolution.
