
Classifying Galaxies from Another Universe!

We’re excited to announce the publication of another scientific study. that wouldn’t have been possible without the hard work of the Galaxy Zoo volunteers. The paper:
“Galaxy Zoo: Morphological classification of galaxy images from the Illustris simulation”
is the first Galaxy Zoo publication that examines visual morphological classifications of computer-generated galaxy images. The images were produced in collaboration with the international team of scientists who implemented and analyzed the highly sophisticated Illustris cosmological simulation (you can find many more details about Illustris on the main Illustris project website and about the Galaxy Zoo: Illustris project in this previous blog post). Illustris is designed to accurately model the evolution of our Universe from a time shortly after its birth until the present day. In the process, simulated particles of dark matter, gas, and stars aggregate and condense to form galaxy clusters that contain seemingly realistic galaxies. In our paper we wanted to test the realism of those simulated galaxies by inviting Galaxy Zoo volunteers to evaluate their morphological appearance. We wanted to know whether Illustris galaxies look like real galaxies.
But where to start looking? Well, if you’ve ever classified a galaxy on Galaxy Zoo then you must have answered a question worded something like:
Is the galaxy simply smooth and rounded, or does it have features?
This question represents one of the simplest ways to distinguish between different groups of galaxies, but its answer can reveal a lot of information about a galaxy’s history, as well as its current activity. Visible features and substructure like discs, spiral arms and bars in galaxy images often indicate sites of ongoing star formation and can provide evidence for complex dynamical processes within a galaxy. On the other hand, apparently featureless galaxies may have formed in dense environments where galaxy-galaxy interactions are more common and might act to destroy features or even prevent them from forming in the first place.
In our paper, we compared the prevalence of visible features in galaxy images that were produced using Illustris against an equivalent sample of real galaxy images that were derived from Sloan Digital Sky Survey (SDSS) observations. Some of the differences we found were surprising but quite illuminating!
Each image in Galaxy Zoo is classified by about forty volunteers and their votes for each question are aggregated to obtain a consensus. The level of agreement between volunteers can be quantified using the vote fraction for a particular response. For a particular image and question the vote fraction for a possible response is just the number of volunteers who voted for that response, divided by the total number of votes cast for that question, for that image. A concrete example that applies here is the “featured” vote fraction: the number of volunteers who classified a galaxy image as exhibiting visible features divided by the total number of votes cast for the simple question that was quoted above. Vote fractions close to zero indicate that most volunteers thought the galaxy was smooth and rounded, while vote fractions around one imply almost unanimous consensus that a galaxy has visible features.
The filled green bars in Figure 1 illustrate the distribution of this “featured” vote fraction for real galaxy images. The distribution is dominated by a peak close to zero, which means that most volunteers thought that most galaxies looked smooth and featureless. There is also a smaller peak close to one, corresponding to a population of obviously featured galaxies. In contrast, the blue line shows the “featured” vote fraction for Illustris galaxy images. The bulk of the distribution is now peaked around 0.6, which means that Illustris galaxies were generally perceived to be predominantly featured. However, there are very few Illustris galaxies that were unanimously labeled as exhibiting visible features and a substantial population of visibly smooth galaxies is also present. Overall, the Illustris galaxy images seem more feature rich, but perhaps slightly more ambiguous than their SDSS counterparts.

Figure 1: The distributions of the “featured” vote fraction for real (SDSS; Green, filled bars) and simulated (Illustris; Blue, hollow bars) galaxy images. There is an obvious mismatch between the distributions for the simulated and real galaxy images.
To try to understand the origin of the mismatch between Illustris galaxies and those in the real Universe, we separated both of the image samples into three sub-groups based on the total mass of the stars that the galaxies contain (more succinctly described as their “stellar mass”). Each of the panels in Figure 2 can be interpreted in the same way as Figure 1, except that they correspond only to the galaxies for each of the three stellar mass sub-groups. The two panels to the left are for galaxies with stellar masses less than the mass of 1000 billion suns. They look remarkably similar to Figure 1 with the SDSS and Illustris distributions matching very poorly. However, the situation changes markedly in the right-hand panel. For these extremely massive galaxies, it appears that the Illustris simulation reproduces the observed proportion of visibly featured galaxies much better, although the population of unambiguously featured galaxies is still absent.

Figure 2: The distributions of the “featured” vote fraction for real (SDSS; Green, filled bars) and simulated (Illustris; Blue, hollow bars) galaxy images. The distributions are shown for sub-groups of galaxies that are subdivided according to stellar mass. The distributions for the most massive galaxies, with stellar masses greater than the mass of 1000 billion suns, are shown in the right-hand panel. It is only for these very massive galaxies that the vote fraction distributions for simulated and real galaxies begin to look similar.
The change in behavior with stellar-mass that we have identified might simply be an artifact of the finite resolution at which Illustris is able to simulate the Universe. Computational power is limited, so Illustris cannot accurately model the positions, interactions and evolution of every star in its simulation volume (and of course tracking individual gas atoms or dark matter particles is completely impossible!). Instead, Illustris models large groups of stars, and large accumulations of gas and dark matter as single “particles” and models the way that they interact with each other. The features that volunteers perceive in Illustris galaxy images manifest substructures formed by groups of many such particles. Simulated galaxies with larger stellar masses contain more stellar particles that enable the simulation to model finer structural details which may be necessary to emulate the appearance of real galaxies.
Studies involving automatic morphological classification of Illustris galaxy images (e.g. Bottrell et al 2017, Snyder et al 2015) have also identified a marked divergence with galaxies in the real Universe below the same 1000 billion solar mass limit that we have found. Confirmation that the visual appearance of galaxies also changes perceptibly complements a growing body of knowledge on this subject.
Dust is another constituent of galaxies that can substantially modify their appearance by absorbing bluer light that typically indicates star formation and re-emitting it at redder wavelengths. This dust reddening effect is not accounted for by the Illustris simulations and could obscure the visibility of features that are actually present in real galaxies. This means that Illustris might be modeling real galaxies better than it seems, and coupling of a dust reddening model to the simulation output might improve the correspondence between the mismatched vote fraction distributions at lower stellar masses.
As is often the case in scientific research, an unanticipated result has provided valuable insight. The results from Galaxy Zoo: Illustris will help cosmologists to improve their models as they develop the next generation of large-scale simulations of our Universe. The results also underline the ongoing potential utility for visual morphological classification of simulated galaxies. The most recent cosmological simulations, including a next-generation Illustris Simulation, address many of the shortcomings that this and other studies have revealed. Comparing their outputs with SDSS galaxy images, as well as observational data produced by other surveys, will undoubtedly yield more insights into the processes that govern the formation and evolution of galaxies. Watch this space!
A preprint of the new paper, which has been accepted by the Astrophysical Journal, can be downloaded from the arXiv.
Radio Galaxy Zoo finds rare HyMoRS!
The following blogpost is from Anna Kapinska about the Radio Galaxy Zoo paper that she published recently with Radio Galaxy Zooite, Ivan Terentev on the first sample of candidate Hybrid Morphology Radio Sources (HyMoRS) from the 1st year of Radio Galaxy Zoo results.
Radio Galaxy Zoo scores another scientific publication! The paper ‘Radio Galaxy Zoo: A search for hybrid morphology radio galaxies’ has been published today in the Astronomical Journal. First of all congratulations to everyone, and what wonderful work from all our citizen scientists and the science team! Special thanks go to Ivan Terentev, one of our very active citizen scientists, whose persistent work on finding and collecting HyMoRS in a discussion thread on RadioTalk (link) without doubt earned the second place in the author list of this paper. But of course the publication wouldn’t be possible without all our volunteers, and special thanks are noted in the paper (check out the Acknowledgements on page 14):
“This publication has been made possible by the participation of more than 11,000 volunteers in the Radio Galaxy Zoo Project. Their contributions are acknowledged at http:// rgzauthors.galaxyzoo.org. We thank the following volunteers, in particular, for their comments on the manuscript or active search for candidate RGZ HyMoRS on RadioTalk: Jean Tate, Tsimafei Matorny, Victor Linares Pagán, Christine Sunjoto, Leonie van Vliet, Claude Cornen, Sam Deen, K.T. Wraight, Chris Molloy, and Philip Dwyer.”
But what are HyMoRS? HYbrid MOrphology Radio Sources, HyMoRS or hybrids for short, are peculiar radio galaxies that show atypical radio morphologies. That is, radio galaxies which we can resolve in our observations come in two principal flavours: 1) FRI – type; and 2) FRII-type — named after two scientists who introduced this classification back in 1974, Berney Fanaroff and Julia Riley [link to paper].
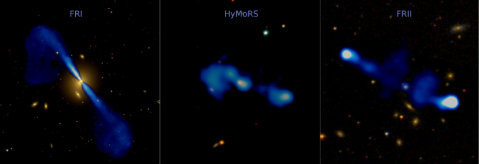
Figure 1. Three main types of radio galaxies. FRI type (3C 296, left panel), FRII type (3C 234, right panel), and a HyMoRS that shows a hybrid radio morphology of FRI on its eastern (left) side and FRII on its western (right) side (RGZ J103435.8+251817, middle panel). The radio emission from the jets is in blue, overlaid on the SDSS true colour images. Credits: Kapinska (based on FIRST/NRAO, SDSS, Leahy+Perley 1991).
Traditionally, FRIs and FRIIs are distinguished by different morphologies observed in radio images, where on the one hand we have archetypal FRIIs showing powerful jets that terminate in so-called hotspots (can be spotted in right panel of Figure 1 as two white bright spots at the ends of the jets), while on the other there are FRIs with their jets often turbulent and brightest close to the host galaxy and its supermassive black hole (left panel of Figure 1). HyMoRS are hybrids, they show both morphologies at the same time, that is they look like FRI on one side and FRII on the other side. Figure 2 shows two examples of the new HyMoRS candidates that Radio Galaxy Zoo identified in this latest paper.

Figure 2. Two new HyMoRS candidates found with Radio Galaxy Zoo: RGZ J150407.5+574918 (left) and RGZ J103435.8+251817 (right). The radio emission from the jets is in blue overlaid on the SDSS true colour images. The inserts show zoom-ins on the HyMoRS’s SDSS images of the hosts galaxies. Credits: Kapinska (based on FIRST/NRAO, SDSS).
How are HyMoRS formed? We still don’t have a very clear answer to this question. The thing is that there may be many reasons why one radio galaxy would have so radically different looking jets. One possibility is that the medium in which the jets travel through (the space around) is different on each side of the galaxy. In this case the FRI morphology could form if the medium is dense or clumpy for one jet, while FRII morphology could form if the medium is smoother or less dense on the other side for the second jet (but watch this space for more work from our science team). But there are also other options. For example, we may simply see the radio galaxy in projection, or we are observing rare events of a radio galaxy switching off, or switching off and on again. The more HyMoRS we know of, the better we can study them and pinpoint the scenarios of how they form.
For example, the science team at the University of Tasmania has produced a simulation of jets from an FRII-type radio galaxy located in the outer regions of a cluster (~550 kpc from the centre) and expanding in a non-uniform cluster environment. The jet on one side propagates into a much denser medium than the jet on the other side. The jets are very powerful (10^38 Watts) and the total simulation time is 310 Myr. The movies display the density changes associated with the jet expansion. Credit goes to Katie Vandorou, Patrick Yates and Stas Shabala for this simulation (link to simulation).
How rare are HyMoRS? We actually don’t really know, and this is because so far there are very few complete surveys of these radio galaxies. Current estimates indicate that they may be comprising less than 1% of the whole radio galaxy population. We are hoping that with Radio Galaxy Zoo and the new-generation telescopes we will be able to finally pin down the HyMoRS population. And our paper is definitely one big step towards that aim. It’s very exciting as with the fantastic efforts of RGZ we now have 25 new HyMoRS candidates — this could possibly double the numbers on known hybrids!”
So well done everyone and let’s keep up the fantastic work! We couldn’t have done it without you 🙂
Anna, Ivan & the coauthors on this latest paper
___________________
The official open access refereed paper can now be found at http://iopscience.iop.org/article/10.3847/1538-3881/aa90b7
The article can also be downloaded from: http://arxiv.org/abs/1711.09611
A CAASTRO story with embedded animation is now available at: http://www.caastro.org/news/2017-hymors
Shedding light on the mutual alignment of radio sources
The following blogpost is from Omar Contigiani about the Radio Galaxy Zoo paper that he published recently on the cosmic alignment of radio sources.
In the Radio Galaxy Zoo an incredible variety of creatures can be found — as our citizen scientists might know by now, radio sources in the sky can have all sorts of shape and sizes. The most powerful among them are plasma-filled jets emitted by the some of the largest elliptical galaxies in existence. Because of their precise structure, anyone can associate orientations to these sources by simply looking at the directions the jets point at.

Figure 1: Illustration of jet orientations distributed in the sky. Note that this figure only depicts a small fraction of the total area covered by the observations upon which RGZ is based. Credit: NASA, ESA, S. Baum & C. O’Dea (RIT), R. Perley & W. Cotton (NRAO/AUI/NSF).
Recently, our scientists have been looking at the directional properties of these fascinating beasts. If a particular source points in a direction, is it possible that its neighbours also tend to do the same? Because the distances between adjacent objects are (quite literally) astronomical, it seems intuitive to assume that the relative orientations should be random. However, nature always finds subtle ways to mess with our intuition and it turns out that this is currently an open question in astronomy. Thanks to Radio Galaxy Zoo’s numerous (almost two million) image classifications, the team was able to report the most precise measurement of this effect to date. The results are available in a scientific article published in Monthly Notices of the Royal Astronomical Society this November.
The analysis performed in the study suggests that relative alignment of radio sources is present on distances which are dubbed as cosmological. This is because only phenomena related to the history of the Universe as a whole are known to be connected to such large scales.
While this is an exciting step towards an answer, formulating any conclusive statement about this alignment and the reasons behind it appears to be difficult. What drives this effect? Is it related to a shared history or environment? More science needs to be done and more galvanising discoveries are waiting for us just around the corner.
Once again, without the contributions made by our volunteers all over the world, we would not have been so successful in our endeavours. A big thank you to all our Radio Galaxy Zooites!
However, we have only reached 74% of our classification target. Head to Radio Galaxy Zoo to become involved and you will be contributing to real science being done today and may be co-authoring another great discovery with us!
RGZ team spotlight: Francesco de Gasperin

Meet Francesco de Gasperin, an associate science team member (since 2015) who is very interested in the classifications resulting from Radio Galaxy Zoo
I am a VENI fellow at the Leiden University in the Netherlands. My research is mainly based on developing and exploiting new technologies in radio-astronomy to study active galactic nuclei (AGN), galaxy clusters, galaxies and ultimately everything which emits radio waves. I am part of the LOFAR collaboration and most of my time is invested in the commissioning of this new radio-telescope. I am now leading the effort to calibrate the low band antennas of LOFAR to observe the sky at decameter wavelength. Our plan is to ultimately produce the lowest frequency radio survey ever done.
I did my PhD at the Max Planck Institute for Astrophysics in Munich on a thesis titled: “The impact of radio-emitting supermassive black holes on their environment: the LOFAR view of the Virgo cluster”. During my master I also worked for the Planck mission, a satellite designed to study the Cosmic Microwave Background (CMB) – the relic radiation from the Big Bang.
******************
What has Francesco and his student, Omar Contigiani done lately ?
Is the orientation of radio galaxies totally random? Or is it driven by the large scale structure where galaxies are embedded in? Recently, some works on small regions of the sky claimed an intrinsic alignment of radio sources. This is in line with the observed alignment between quasar jets and the surrounding large scale structure at higher redshifts.
With the help of the RGZ we are now able to identify the orientation of a very large number of radio galaxies. This allows us to expand these studies to unprecedented scales, moving from regions of few square degrees to around 10 thousands.
Galaxy Zoo: Literature Search – Initial Results
Thanks to everyone who has helped with the Galaxy Zoo Literature Search so far. It’s not too late to join in (for full details see the first blog post), but I thought I would write a followup summarising some of the findings so far. Hopefully it’ll help clarify what we’re looking for, and you won’t have to worry about repeating any of the papers we already have.
Academic life is full of lots of different tasks which occupy our time more or less at different parts of the year. It’s one of those things which I enjoy about it so much, but is is also basically my excuse for why work on the paper has ground to a halt in the last month. I have been occupied with teaching undergraduate Computational Physics, SDSS Spokesperson duties, and keeping on top of lots of remote observing with the Green Bank Radio Telescope. All good fun, but not paper writing! However this paper is making it back up to the top of my to do list now (hence this blog post!), so I hope to have more news for you on it soon.
Anyway here’s my summary of the new papers you have found for us in the different categories. We had no submissions yet of new papers defining early-types as E/S0/Sa, or late-types as being only types Sb/Sc/Sd yet, so keep looking for those.
Also as a reminder that when we’re talking about galaxies red = shorthand for not forming stars (or quenched), so sometimes astronomers use red and quenched (or passive) interchangeably. And spectra can also be used to find galaxies which are not forming stars, so spectral type and colour are highly related.
We also have a ton of different ways to talk about galaxy bulge size, from B/T (bulge-total ratio), to various model fits to light profiles (e.g. the Sersic profile, where Sersic n>2.5 is generally take to mean there’s a bulge, and n=1 means a pure disc). Concentration is also talked about – a more concentrated galaxy is more likely to have a bulge, than a less concentrated galaxy. And in SDSS there is a “fracDeV” parameter, which is the fraction of the model light curve made up from a “De Vaucouleur profile”, which is the same as a Sersic profile with n=4. We don’t like to make life too easy for newcomers in astronomy! 😉
The list of papers that:
- Claim that colour and morphology are equivalent
Strateva et al. 2001: https://ui.adsabs.harvard.edu/#abs/2001AJ….122.1861S/abstract
A classic here, and possibly the root of this idea: “We use visual morphology and spectral classification of subsamples of 287 and 500 galaxies, respectively, to show that the two peaks correspond roughly to early- (E, S0, and Sa) and late-type (Sb, Sc, and Irr) galaxies, as expected from their different stellar populations.”
Note that they are defining early- and late-types in the way I would like to find more examples of.
Fang et al. 2013: https://ui.adsabs.harvard.edu/#abs/2013ApJ…776…63F/abstract
This one is a bit complicated. They state in the Introduction that “galaxies above a Sersic value of n ≈ 2.5 tend to be quiescent. “ and go on to claim that having a large bulge is necessary but not sufficient to be quenched (ie. red). Which means they acknowledge the existence of blue ellipticals (or blue galaxies with large bulges), but not red spirals with small bulges.
In their conclusions they state: “our results imply that galaxy quenching requires the presence of a bulge, but that a bulge alone is not enough to ensure the complete cessation of SF. “
This was not exactly what we were looking for, but definitely related, and interesting.
Huerta-Company et al. 2011 http://adsabs.harvard.edu/abs/2011A%26A…525A.157H
Good try, but I’m not sure this quite counts in this category – they use colour as part of their classification scheme (which we would definitely not recommend), but it’s not the only part, so they’re not really saying it’s the same as morphology. “Three types of parameters used to estimate morphology probabilities; “we decided to include three types of parameters: (1) color (g − r, r − i) k-corrected with Blanton et al. (2005) code; (2) shape (isoB/isoA in the i-band and deVAB_i); and (3) light concentration (R90/R50 in the i-band). For color measurements we use modelmagnitudes corrected for galactic extinction. isoB and isoA are the isophotal minor and major axes respectively, and deVAB_i is the DeVaucouleurs fit b/a. R90 and R50 are the radii containing 90% and 50% of the petrosian flux, respectively”
Cooper et al. 2010: https://ui.adsabs.harvard.edu/#abs/2010MNRAS.402.1942C/abstract
In the introduction they say: “Various observational studies have investigated the formation of early-type or red-sequence galaxies “
They then go on to use colour to define their sample: sec. 2 p. 1943:”To isolate the red- sequence population, we use the following magnitude-dependent cut: g − r = −0.02667 · M r + 0.113”
Good find. This definitely just assumes that colour=morphology.
Tal & van Dokkum 2011: http://adsabs.harvard.edu/abs/2011ApJ…731…89T
In the words of our volunteer (Jean Tate):
“Throughout this paper, the authors conflate “massive red” with “elliptical”. This formally begins with the selection criteria (“We selected galaxy images for this study from the Sloan Digital Sky Survey (SDSS, Abazajian et al. 2009) including all objects classified as Luminous Red Galaxies (LRG) that have a spectroscopic redshift measurement. LRGs are intrinsically red and luminous objects that were identified as such from their central surface brightness and location on a rotated color-color diagram (for full details see Eisenstein et al. 2001). This selection is aimed at finding the most luminous red galaxies in the nearby Universe (L 3L⋆) out to a redshift of z = 0.5.”)”) which does not distinguish between red ellipticals and red spirals (nor red S0s). However, the first sentence in the Discussion section strongly implies that massive red S0s and massive red spirals are irrelevant (“The first and foremost result that arises from this study is that faint, gravitationally bound stellar light can be traced in massive elliptical galaxies out to a radius of 100 kpc.”), to take just one example.”
Another good find, and very common that LRG=elliptical is assumed.
2. Define “early-type” galaxy as any galaxy without visible spiral arms (e.g. our “smooth” category, which can include elliptical galaxies, and smooth disks), rather than as a galaxy that isn’t a disk.
So here I basically meant they were defining early-type as E and S0 only, and we got one submission like that:
Stanford et al. 1998: http://adsabs.harvard.edu/abs/1998ApJ…492..461S. “We present results from an optical-infrared photometric study of early-type (E+S0) galaxies in 19 galaxy clusters out to z = 0.9.”
“In this paper, we use the term ““early-type” galaxy to refer to those galaxies classified morphologically as having Hubble classes E, E/S0, or S0. “
3. Define “early-type” galaxy as including Sa spirals as well as lenticular and ellipticals.
No submissions yet – although note that Strateva et al. 2001 (above) do this.
4. Define “late-type” galaxy as only late-type spirals (e.g. excluding Sa spirals)
No submissions yet – although note that Strateva et al. 2001 (above) do this.
5. Use colour or spectral type to split galaxies into “early-“ or “late-“ types (or “elliptical” and “spiral”)
van den Bergh 2007: http://cdsads.u-strasbg.fr/cgi-bin/nph-bib_query?2007AJ….134.1508V&db_key=AST&nosetcookie=1 actually has a contrary view, claiming that “there appears to be no obvious dichotomy between the morphologies of galaxies that are situated on the broad blue and on the narrow red sequences in the galaxian color-magnitude diagram.”
Bell et al. 2004: http://adsabs.harvard.edu/abs/2004ApJ…608..752B
Exactly what we were looking for. They use colour to split their sample into “late” and “early” types, saying:
“”We find that the rest-frame color distribution of these galaxies is bimodal at all redshifts out to z ~ 1. This bimodality permits a model-independent definition of red early-type galaxies and blue late-type galaxies at any given redshift. ”
Cooper et al. 2010: https://ui.adsabs.harvard.edu/#abs/2010MNRAS.402.1942C/abstract
Another good example of using colour to define an early-type sample:
sec. 2 p. 1943:”To isolate the red- sequence population, we use the following magnitude-dependent cut:
g − r = −0.02667 · M r + 0.113”
In doing this they are assuming that red = early-type. In the introduction they say: “Various observational studies have investigated the formation of early-type or red-sequence galaxies “
Almedia et al. 2011: http://adsabs.harvard.edu/abs/2011ApJ…735..125S
Actually seem to be looking into how well the correlation between spectral type and morphology works, saying: “Given a spectral class, the morphological type wavers with a standard deviation between 2 and 3 T types, and the same large dispersion characterizes the variability of spectral classes given a morphological type.”
So this is actually evidence that morphology and spectral type are not completely equivalent.
Ascasibar & Almeida 2011: http://adsabs.harvard.edu/abs/2011MNRAS.415.2417A
But now in this one, the claim is that the correlation is good enough to use spectral classifications to place galaxies into a morphological sequence: “Considering galaxy spectra as multidimensional vectors, the majority of the spectral classes are distributed along a well-defined curve going from the earliest to the latest types, suggesting that the optical spectra of normal galaxies can be described in terms of a single affine parameter.”
6. Use the bulge-to-total ratio (or some proxy for it like concentration, or the SDSS “fracDeV” parameter) to place spiral galaxies in a sequence.
Goto et al. 2003: http://adsabs.harvard.edu/abs/2003MNRAS.346..601G
p. 604 : “Based on the Tauto parameter, we divide galaxies into four subsamples…”
Looking into this, “Tauto” is an attempt to parameters both the bulge size, and the amount of structure not captured in a smooth light profile (some form of clumpiness), so it does indeed neglect the degree of windiness of the spiral arm in placing them in a sequence by bulge size and clumsiness only. Nice find.
Drory & Fisher 2007: http://adsabs.harvard.edu/abs/2007ApJ…664..640D
This paper actually provides evidence that B/T is not enough to classify galaxies into a sequence, pointing out that there are different types of bulge (pseudobulges, which are thought to be build up slowly from discs, and classical bulges, general thought to form in mergers) which correlate with galaxy colour even at the same B/T.
“(1) the red-blue dichotomy is a function of bulge type: at the same B/T, pseudobulges are in globally blue galaxies and classical bulges are in globally red galaxies; “
In summary, I hope this was interesting, and there’s definitely some examples you hve found which will make it into the reference list for the paper. Thanks again for your help, and if you are now inspired to join in go read the instructions here. We’d love to have you along.
Galaxy Zoo Literature Search
Dear volunteers,
Here at Galaxy Zoo we know that some of you are looking for ways to be more involved in the entire process of making science from your clicks.
So we had an idea…..
The team are currently in the process of writing a paper which in its introduction discusses some of the current assumptions/errors/approximations common among our fellow astronomers when thinking about galaxy morphology and classification. As such we’d like to collect as many papers as possible which do the following things:
- Claim that colour and morphology are equivalent
- Define “early-type” galaxy as any galaxy without visible spiral arms (e.g. our “smooth” category, which can include elliptical galaxies, and smooth disks), rather than as a galaxy that isn’t a disk.
- Define “early-type” galaxy as including Sa spirals as well as lenticular and ellipticals.
- Define “late-type” galaxy as only late-type spirals (e.g. excluding Sa spirals)
- Use colour or spectral type to split galaxies into “early-“ or “late-“ types (or “elliptical” and “spiral”)
- Use the bulge-to-total ratio (or some proxy for it like concentration, or the SDSS “fracDeV” parameter) to place spiral galaxies in a sequence.
The current draft text in the paper which talks about these assumptions is:
“The morphology of a galaxy encodes information about its formation history and evolution through what it reveals about the orbits of the stars in the galaxy, and is known to correlate remarkably well with other physical properties (e.g. Roberts & Haynes 1994). These correlations, along with the ease of automated measurement of colour or spectral type, have resulted in a recent trend for classification on the basis of these properties rather than morphology per se (e.g. Weinmann et al. 2006, van den Bosch et al. 2008, Zehavi et al. 2011). Indeed the strength of the correlation has led some to authors to claim that the correspondance between colour and morphology is so good that that classification by colour alone can be used to replace morphology (e.g. Park & Choi 2005, Faber et al. 2007). Meanwhile the size of modern data sets (e.g. the Main Galaxy Sample of the Sloan Digital Sky Survey, SDSS, Strauss et al. 2002) made the traditional techniques of morphological classification by small numbers of experts implausible. This problem was solved making use of the technique of crowdsourcing by the Galaxy Zoo project (Lintott et al. 2008, 2011). One of the first results from the Galaxy Zoo morphological classifications was to demonstrate on a firm statistical basis that colour and morphology are not equivalent for all galaxies (Bamford et al. 2009, Schawinski et al. 2009, Masters et al. 2010) and that morphology provides complementary information on galaxy populations useful to understand the processes of galaxy evolution. “
and later when talking about the spiral sequence:
“Modern automatic galaxy classification has tended to conflate bulge size alone with spiral type (e.g. Laurikainen et al. 2007, Masters et al. 2010a), and automatic classification of galaxies into “early-” and “late-” types, referring to their location on the Hubble Sequence and based on bulge-total luminosity ratio (B/T ) or some proxy for this through a measure of central concentration, or light profile shape (e.g. Sersic index, as reviewed by Graham & Driver 2005) has become common (e.g. van der Wel et al. 2011). Indeed, Sandage (2005) says this is not new, claiming ”the Hubble system for disk galaxies had its roots in an arrange- ment of spirals in a continuous sequence of decreasing bulge size and increasing presence of condensations over the face of the image that had been devised by Reynolds in 1920.””
We’d like to ask for your help in searching for more examples of these behaviours. We have made a simple Google form, and we ask that you submit any examples you find in the next few weeks.
Some of the papers you find might end up cited in the Galaxy Zoo team paper (please be aware there are rules/guidelines about the appropriate number – we don’t want to have too few; it doesn’t make the point about how widespread this is, and we don’t want to single out specific astronomers, but the journal won’t accept too many either). If there are more papers found than we can use, they will be kept in a list on the Galaxy Zoo website (and we can continue to add to them if needed).
I want to reassure you that helping with this does not mean you have to read the entire extragalactic astronomy literature, or even the entirety of a paper! The best place to look for this information in a paper will be the “Sample Selection”, or “Data” sections. Modern online PDF papers also have excellent search facilities – so searching the text for key words (e.g. “spiral”, “early-type”, “colour/color-selected”) may work extremely well.
We’re happy for you to do this however you like (e.g. Google Scholar is fine), but we’d like you to return the NASA ADS (Astrophysics Data System) URL for the paper you find. You can search ADS here: http://adsabs.harvard.edu/abstract_service.html, and I give examples below of the URL I mean. This makes it easy for us to get the full bibliographic data to add the reference to the paper.
One tip – there are some papers in extragalactic astronomy which are cited by most/many results. A good place to start looking through recent papers would be the citation and reference lists of such papers, which can be found in ADS.
For example:
Strateva et al. 2001 “Color Separation of Galaxy Types in the Sloan Digital Sky Survey Imaging Data”
http://adsabs.harvard.edu/abs/2001AJ….122.1861S is cited by 926 papers, and references 25 – this would be an excellent starting place, and the more papers you read the more mentions you may find other other papers doing similar things.
Other good starting places:
Strauss et al. 2002: “Spectroscopic Target Selection in the Sloan Digital Sky Survey: The Main Galaxy Sample” http://adsabs.harvard.edu/abs/2002AJ….124.1810S
Ironically the papers which cite some of our Galaxy Zoo papers where we demonstrate there are galaxies which are not in the normal correlation between colour and morphology may also be good starting points (some citations to these are along the lines of saying things like: “most galaxies fall into blue=spiral; red=elliptical, a few don’t (cite Galaxy Zoo here), but we’re going to use this definition anyway”.
The initial papers on colour not being the same as morphology are:
Bamford et al. 2009 (281 citations): http://adsabs.harvard.edu/abs/2009MNRAS.393.1324B
Schawinski et al. 2009 (81 citations): http://adsabs.harvard.edu/abs/2009MNRAS.396..818S
Masters et al. 2010 (125 citations): http://adsabs.harvard.edu/abs/2010MNRAS.405..783M
We hope that if several of you take up the challenge, you’ll find different paths through the literature and find lots of different examples for us. Again here’s the link to our Galaxy Zoo Literature Survey.
Thanks for your help!
Karen Masters (Galaxy Zoo Project Scientist)
Can we reach 2 million classifications?

Radio Galaxy Zoo is halfway through its fourth year. We are going through all the classifications and finalizing our 1st data release. We could not have gotten this far without all of you. From the bottom of our hearts, we THANK YOU.
We have reached 71% completeness and sit just over 1,959,000 classifications. Can we reach 2 million?
As we did with our 1 million classification milestone, we invite you to classify our 2 million-th Radio Galaxy Zoo supermassive black hole. We have been working hard on Radio Galaxy Zoo merchandise (mugs, holographic bookmarks, and stickers). These are up for grabs for those who classify near or on number 2 million.
As always, make a note (click on discuss) if you have found something interesting, confusing, or if you have a question.
Start your hunt for active supermassive black holes at Radio Galaxy Zoo.
New papers investigate Galactic Rings in Galaxy Zoo
Hello Galaxy Zoo volunteers!
The fact that galaxies can host a multitude of different structures is no news to the volunteers: recent publications have looked at the spiral arms and bars in galaxies. There has now been some more recent work into a different, altogether rarer phenomenon that are called galactic rings. Galactic rings are objects that are commonly observed in the most strongly barred galaxies — it is theorised that these ring structures grow with the bars in galaxies. However, there are multiple theories that can explain these rare but significant features in galaxies, and the theories that claim to explain them remain purely theoretical.
To get an idea of exactly what is going on in ring galaxies requires a sample of galaxies which have galactic rings. Previous studies have relied on a handful of galaxies to study. However, Galaxy Zoo has proven to be the dataset of choice for any astronomer looking for the rarest of morphological phenomena, and Galaxy Zoo has once again provided the dataset for finding galactic rings in galaxies. Galaxy Zoo has always prided itself on not being just from the public but also for the public and for anyone the field of astronomy: all of the Galaxy Zoo data is available online for any astronomer to use. It is exactly the dataset that has allowed for the publication of two papers on galactic rings, by astronomer and long time friend of Galaxy Zoo, Ronald Buta, a Professor of Astrophysics at the University of Alabama. The first paper (here) used the public Galaxy Zoo 2 classifications to successfully define a sample of 3,962 ringed galaxies in Galaxy Zoo, and some examples are given in Fig.1.

Figure 1: Examples of various ring morphologies identified with the help of Galaxy Zoo 2.
A direct follow-up paper investigating fifty of these ringed galaxies in more detail was then published, again by Ronald Buta. In the second paper of this Galactic Rings revisited series, the main aim was to check how the rings in galaxies are related to the dynamics of the disc: theory suggests that rings are the result of resonances between the motions of the various rotating materials in galaxy discs. A resonance is an amplification caused when two oscillations match at just the right frequency: think of pushing someone on a swing. If you give a push at the top of the swing, then the amplitude (how high up the swing goes) will increase. The work described in this paper shows that galactic rings are likely to be exactly that: resonances between the bar+spiral pattern and rotating stars, and that various ring morphologies can be caused by different resonances in the outer discs of galaxies.
This work really showcases one of the key strengths of Galaxy Zoo: finding rare classes of objects in samples impossible to be classified by professional astronomers. So once again we’d like to say thank you, on behalf of astronomers around the world in the Galaxy Zoo team and those who have gone on to use the data from your hard work in other ways.
#GZoo10 Day 3
We’re ready for the final day of the Galaxy Zoo 10 workshop at St Catherine’s College in Oxford; it’s been great to have so many people following along on the Livestream – yesterday’s talks are still up, and today’s schedule is:
09:30 Alice Sheppard (Forum Moderator 2007-2012)
10:00 Brooke Simmons (UCSD)
10:20 Nic Bonne (Portsmouth)
10:40 Coffee
11:00 Coleman Krawczyk (Portsmouth)
11:20 Mike Walmsley (Edinburgh)
11:40 Carie Cardamone (Wheelock)
12:00 Karen Masters: Summary (Portsmouth)
We’ll be blogging these talks as they happen here but you can also keep an eye on the twitter hashtag for updates too!
Our first speaker this morning is Alice Sheppard who was here from the beginning as a forum moderator on the original Galaxy Zoo site. She’s talking about the past 10 years and how she got involved with Galaxy Zoo site. She was very keen to get involved in the project and help classify galaxy images. After finding images that weren’t easily classifiable, users started to email members of the science team to ask them what to do. After this happened many times, the team realised that a place where users could talk together and interact with the team about classifications would be really useful. So the Galaxy Zoo forum was born! Alice was one of the first people to sign up and was asked to moderate the forum – she (along with other moderators) even started welcoming each new user who signed up with a friendly “Welcome to the Zoo!”
.@PenguinGalaxy: how the volunteers are welcomed to the Galaxy Zoo forum #GZoo10 pic.twitter.com/xxIviVO70e
— galaxyzoo (@galaxyzoo) July 12, 2017
Alice is now talking us through some of the findings made by the users. These discoveries including the Green Peas, which when first spotted by the users they immediately started investigating what they were using the links to the science survey site. In the original Galaxy Zoo there was also no button for an irregular galaxy, so users started collating their own collection of irregular galaxies! But what makes users keep coming back to the Galaxy Zoo forum time and time again? One success story was the Object of the Day – the moderators even crowd sourced the users to find good images!
.@PenguinGalaxy: Some of the volunteers started recognizing shapes in Galaxy Zoo #GZoo10 pic.twitter.com/eIlxpA0OxZ
— galaxyzoo (@galaxyzoo) July 12, 2017
Alice has discussed some suggestions for future engagement with users online – always give people room to chat; whether it’s about astronomy or not at all! Remember: as good as you think you citizen science system, tools, tutorials etc are – the volunteers will teach you how to do it better!
.@PenguinGalaxy's research questions #GZoo10 pic.twitter.com/BYQk8ju5Yw
— galaxyzoo (@galaxyzoo) July 12, 2017
Next up this morning is Brooke Simmons talking about what she’s calling probative outliers. The things that tend to break the mould and challenge our world (or Universe!) view. She starts with the bulgeless galaxies – those that look like pure disks – but are hosting growing super massive black holes in their centers. This is weird because the most accepted theory is that super massive black holes grow in mergers of galaxies BUT mergers also grow bulges – so how did these bulgeless things grow their black holes? Brooke is showing us some beautiful follow up observations of Galaxy Zoo SDSS images taken with the Hubble Space Telescope that will help to try and figure this out.
This galaxy hosts a luminous supermassive black hole. Hubble reveals rich substructure, including star-forming knots along the spiral arms. pic.twitter.com/SKufkF7IbV
— Brooke Simmons (@vrooje) May 22, 2017
Thing is, Brooke only has about 100 of these galaxies – but not for lack of trying! They just seem to be really rare. If we could actually cover the southern sky in the same way that SDSS covered the northern sky, Brooke would be very grateful! Could we also use trained machines to pick out the weird outliers as well? In which case, Brooke thinks we need to adapt the next iteration of Galaxy Zoo to be both machine as well as user friendly. This will mean leaving things behind but let’s not be afraid to make changes!
.@vrooje: let's actually let the machines do some of the work #GZoo10 pic.twitter.com/d8MIVp4Xgr
— galaxyzoo (@galaxyzoo) July 12, 2017
Next up, we have Nic Bonne from Portsmouth who’s going to tell us all about making luminosity functions using the data from Galaxy Zoo. So what’s a luminosity function? It’s basically a count of the number of galaxies at different luminosities (or brightness) which can give us clues about how the Universe formed and evolved.
Next is @coffee_samurai and Raffles, the awesome guide dog, on the luminosity function of GZ galaxies #GZoo10 pic.twitter.com/dvlrGATk5t
— galaxyzoo (@galaxyzoo) July 12, 2017
Luminosity functions are especially interesting if you start making them for different morphologies or colours of galaxies. This is what Nic has been doing using the Galaxy Zoo 2 classifications. He’s found something a bit weird though – that the galaxies classified as smooth seem to be more numerous than those classified as featured at the low luminosity (low mass) end. Bringing the colour of the galaxies into this picture as well shows you how similar red featured and red smooth luminosity functions are. Nic says there’s a lot more to do be done with this work though, including using Ross’s new debiased classifications to improve the sample completeness and investigating how the luminosity functions change shape for different kinematic morphologies.
@coffee_samurai's results on the luminosity functions: smooth galaxies are more numerous than featured ones at low masses #GZoo10 pic.twitter.com/mbqIyvageI
— galaxyzoo (@galaxyzoo) July 12, 2017
Next up is Coleman Krawczyk who’ll be showing us some of the initial results from the Galaxy Zoo 3D project. This project asked users to draw around the features of a galaxy on an image so that researchers could pick out the spectrum of that particular feature using MaNGA data. Users were asked to either mark the centre of the galaxy or draw around any bars or spiral arm features.
#gzoo10 some potential @galaxyzoo tasks are harder than others …. pic.twitter.com/hMd3qpAKHx
— Alice Sheppard (@PenguinGalaxy) July 12, 2017
Users could also choose which classification task they would prefer to help out with. This meant that the easy classification task of marking the centre of the galaxy was finished within a couple of days – whereas the spiral drawing task took 6 weeks for classifications to finish. Coleman has now reduced these classifications and has made “maps” for every galaxy marking which pixels are in which features. He’s now started making diagnostic plots to map the star formation rate in the different features of classified galaxies. Turns out we’re going to need more classifications in order to do the science we want to, so this project could have new data coming soon!
Next up is Mike Walmsley, who’ll be joining the research team as a PhD student in October.
Next is Mike Walmsley who will be joining the Galaxy Zoo team in 3 months' time #GZoo10 pic.twitter.com/agN3fmuOQH
— galaxyzoo (@galaxyzoo) July 12, 2017
He’s not yet done any work with Galaxy Zoo but as part of his Masters research he looked at doing automatic classification of tidal features in galaxies. His goal was to write a code that trained a machine, using a neural network, to detect these tidal features. He also figured out that masking the main galaxy light in the image makes it easier for the machine to spot tidal features. So does this method actually work? It identifies tidal features with ~80% accuracy – which is actually a much higher quality than other automated methods! He’s hoping to apply these methods to new and bigger surveys during his PhD.
Next up is Carie Cardamone from Wheelock College talking about her work building on the the discovery of the Green Peas by Galaxy Zoo volunteers.
AND IT'S THE PEAS 💚💚💚💚 #gzoo10 pic.twitter.com/TcWkBucD6H
— Alice Sheppard (@PenguinGalaxy) July 12, 2017
So what are the Green Peas? First up their name describes them pretty well because they’re small, round and green. Carie originally wanted to study them because she thought they might be growing super massive black holes, but it turned out instead they have extremely high star formation rate for their relatively small mass. There has been many further studies on these objects so we now know a lot more about them, but one thing we still don’t really know is what galaxy environment they live in. Carie is trying to quantify this but the first problem was that she didn’t have enough Peas! There’s only 80 in the original GZ2 sample but now with the better analysis tools Carie has been able to select 479 candidate Peas. Analysing this sample and comparing it to a sample of well studied luminous red galaxies, the results suggest that peas are less clustered. i.e. the Peas have fewer galaxy neighbours.
#GZoo10 Peas aren't quite so round in Hubble pic.twitter.com/t544m8I6KA
— Alice Sheppard (@PenguinGalaxy) July 12, 2017
We’re now coming towards the end of the meeting (sad times guys) and to remind us all why we’re here and what we talked about, Karen Masters is going to give us a summary of the past couple of days. She’s first pointing out how great we are as a team and the impact the research has had on the galaxy evolution community. Fitting for the 10 year anniversary is that we have 10 published papers with over 100 citations!
Finally. @KarenLMasters giving a summary of the #GZoo10 pic.twitter.com/l6ZzewUQaI
— galaxyzoo (@galaxyzoo) July 12, 2017
Karen has noticed a couple of themes from the past few days that she’s summarised for us. The first is that we have to keep engaging with the Galaxy Zoo community on Talk. The second is that we shouldn’t be afraid of change – let’s not get hung up on how it’s always been done and think about how best to do it now. The third is that galaxy’s are messy and we need to think carefully how we use the classifications. The fourth is that the users will always give you what you ask for – so be careful what you ask! But sometimes you get more than you asked for and end up with a wonderfully collaborative research team!
.@KarenLMasters: Happy 10th Birthday Galaxy Zoo! #GZoo10 pic.twitter.com/AqWrBWNMPW
— galaxyzoo (@galaxyzoo) July 12, 2017
#GZoo10 Day 2 : Happy Birthday to us
Ten years ago today, I was trying to work out how to deal with the sudden flood of volunteers heading to our site to help explore the Universe. Lots of that traffic came from a BBC News article, so it seems appropriate they’re marking the day with a new piece reflecting on recent results.
BTW – for more on the Hubble paper described in the BBC article, these from @galaxyzoo blog https://t.co/NFghsTJvNx https://t.co/61JARjnHtC https://t.co/KZHum115sr
— William Keel (@NGC3314) July 11, 2017
(As Bill says, you can find out more about those results here on the Galaxy Zoo blog).
We’re ready for day 2 of the Galaxy Zoo 10 workshop at St Catherine’s College in Oxford; it was great to have so many people following along yesterday morning on the Livestream – yesterday’s talks are still up, and today’s schedule is:
9.40am: Karen Masters (Portsmouth)
10.00am: Lucy Fortson (Minnesotta)
10.20am: Hugh Dickinson (Minnesotta)
11.00am: Sam Penny (Portsmouth)
11.20am: Becky Smethurst (Nottingham)
11.40am: Ross Hart (Nottingham)
12 noon: Seb Turner (Liverpool John Moores)
12.20pm: Peter McGill (Oxford).
We’ll blog these talks as they happen here too.
From here one in folks it’s Becky Smethurst taking the reins – once more unto the breach my friends!
We’re kicking off the day with an original science team member: Karen Masters! She’s going to be asking the question: After 10 years of Galaxy Zoo: What Now?
She kicks us off with thinking about how Galaxy Zoo classifications are just as quantitative as an automated computer classification of a galaxy’s morphology – but what can we do to combine these measurements? The problem is that computers which searching for a best fit model can get stuck in what’s called a “local minimum” in parameter space which is not actually the best fit. Combining human interaction with this computer fitting process will help to find the “global minimum” or the true best fit for the model. Karen is showing a new project that is still in the early development stages where volunteers help to fit a model light profile for a galaxy.
.@KarenLMasters about an exciting new project to combine Galaxy Zoo with quantitative morphology #GZoo10 pic.twitter.com/VfLetYsIyc
— galaxyzoo (@galaxyzoo) July 11, 2017
Karen now segways into the idea that colour ≠ morphology, which was one of the first results from Galaxy Zoo.
.@KarenLMasters explaining the origin of the confusion that colour=morphology #GZoo10 pic.twitter.com/a7qKYRfRtD
— galaxyzoo (@galaxyzoo) July 11, 2017
She’s now talking about how we need to go one step beyond the visual morphologies we have, to classify how the stars are actually rotating. New galaxy surveys, such as MaNGA that Karen is working on, are taking many spectra across the whole galaxy to get rotation maps. We can then classify these rotation maps to understand a galaxy’s history – less ordered rotation suggests that a galaxy’s disk has been disturbed by something like a merger or interaction. This is really helpful to astronomers to be able to figure this out, especially if there’s no clues in the visual morphology that an interaction or merger is happening.
Karen ends her wonderful talk by discussing how we can all get more students involved with Galaxy Zoo and astronomy as well. Galaxy Zoo is often used in Astronomy 101 classes at universities, as well as in schools – so how do we engage more with this side of the Galaxy Zoo community?
Next up this morning is Lucy Fortson talking about “The evolution of a Galaxy Zoo team member.” Ten years ago Lucy was working at the Adler Planetarium in Chicago and was aware that the best research model for museums was to get the public to participate in it – so jumped at the chance to join the Galaxy Zoo research team! She’s now going to be giving us a round up of everything going on in the group at Minnesota – one of the hubs for the Galaxy Zoo research team.
Next is @LucyFortson on the work of the team at the University of Minnesota in #galaxyzoo #GZoo10 pic.twitter.com/sT35I9KKxi
— galaxyzoo (@galaxyzoo) July 11, 2017
Mel Galloway’s work comparing the UKIDSS (infrared images) and SDSS (optical images) Galaxy Zoo classifications – how does the morphology of a galaxy change with wavelength? Mel has also worked with the Galaxy Zoo Hubble classifications looking at how disk galaxies evolve and become passive (i.e. non star forming). The problem was that the number of disks drops out at the high redshifts that the Hubble Space Telescope can target, so makes the sample of disks incomplete. This ended up with a new offshoot project classifying disk galaxies lovingly titled Save Mel’s Thesis! With these classifications providing a more complete sample, Mel managed to show how the the amount of passive disks increased from 6 billion years ago to the present day. Not only that, she also showed that more massive galaxies are more likely to keep their disks after they stop forming stars as well.
Now we’re all getting emotional because Lucy’s brought up Kyle Willett who recently left astronomy to work in the data science industry. But where would Galaxy Zoo be without Kyle?! He not only published a lot of the data release papers for Galaxy Zoo but also kept up the site maintenance and even ran the kaggle competition we held for machine classifications of galaxies.
Speaking of machine classifications of galaxies – did someone say Melanie Beck?! Melanie is working on using machine learning in conjunction with the user classifications to complete Galaxy Zoo much quicker by retiring the easy subjects much quicker, leaving the users with the interesting and difficult things to classify.
.@LucyFortson presenting the work of @highzgal on combining machine learning with Galaxy Zoo classifications #GZoo10 pic.twitter.com/Nqc87wMrv2
— galaxyzoo (@galaxyzoo) July 11, 2017
This is going to be really important in the future when new telescopes like the LSST start observing when we’ll have almost 1 billion images of galaxies! If the computers are working on the easy stuff, say 90% of the images, users will still be left with 1 million more interesting things to classify!
The next Minnesota person is Hugh Dickinson – but he’s in the room, so now we’re hearing from him personally. Hugh is working on the classifications from Galaxy Zoo Illustris – the first time users have been asked to classify galaxies from a different universe – albeit a universe that only exists inside a computer! Illustris is a simulation of galaxies which is one of the most realistic simualtions to date; it’s high resolution and includes all the ingredients for a Universe such as dark matter, stellar processes, feedback and gas cooling.
Next is Hugh Dickinson on results from using simulated galaxies in Galaxy Zoo #GZoo10 pic.twitter.com/qAlwVkrE5V
— galaxyzoo (@galaxyzoo) July 11, 2017
But why is it important to classify what are essentially “fake” galaxies? Well with a simulation we know exactly what the history of a galaxy is throughout the entire simulated life of the Universe, so if we’re getting the same morphologies as we see in the Universe then we know that the Physics we’ve assumed to make this simulated universe are right. It can also help highlight the links between a galaxy’s visual appearance and its dynamical history. So although it might seem weird classifying something that doesn’t really exist, those classifications are extremely helpful to astronomers to help down pin down the Physics that is occurring in the Universe.
So the first thing that Hugh has looked at is the first question in the Galaxy Zoo tree: smooth or featured? And the bad news is that the classifications of the simulation images don’t match the real classifications of galaxies from Galaxy Zoo 2.
We find that simulated and real galaxies indicate almost opposite smooth/features fractions. There is a match only at higher masses #GZoo10 pic.twitter.com/fN90GuKcmv
— galaxyzoo (@galaxyzoo) July 11, 2017
This means that there’s an issue with the simulations – investigating it further they found that there is actually very good agreement between the classifications for higher mass galaxies (> 10^11 solar masses) where the same number of smooth galaxies are seen. For lower mass galaxies though there are a lot more featured things in the simulations than in the real Universe. So, from this preliminary study Hugh’s figured out that we’ll only be able to compare the detailed structures of simulated and real galaxies of high mass – so now these are back being classified right now on the Galaxy Zoo site to get answers to all the further questions about spiral arms, bars etc. So please keep classifying!
Hugh is now telling us all about one of our newest projects: Galaxy Nurseries! Users look at the spectrum of a galaxy and are asked whether the emission they’re seeing in the plot is a real feature or not. The data is a bit messy, so this is not an ideal task for a computer but perfect for a human! There’s a lot to be done with this project but Hugh is excited to see the classifications come through.
Time for coffee for us now – we need caffeine to keep up this level of science discussion!
Next up for our listening pleasure is Sam Penny from the University of Portsmouth.
Next is @astro_hedgehog on dwarf galaxies and MaNGA @sdssurveys #GZoo10 pic.twitter.com/xSPYAo6OpV
— galaxyzoo (@galaxyzoo) July 11, 2017
She’s going to be giving us an overview of the MaNGA survey, which is a new survey looking at the kinematics of galaxies by taking lots of spectra for each galaxy in a bundle. How are we going to integrate this then with Galaxy Zoo? Currently Sam works on very low mass non star forming galaxies which tend to be quite low brightness so aren’t always the easiest to visually classify. So she’s using the kinematic information that MaNGA provides to reveal how these galaxies have evolved. But she wants to know is there a link between the kinematics and the morphology of the galaxies? That way, if we don’t have kinematics for some galaxies will we still be able to pick these galaxies out?
Sam’s other interest is void galaxies; these are found isolated from other galaxies in extremely low dense environments. Surprisingly for galaxies that have been isolated from other galaxies their entire lives, some of them are very massive, very red (i.e. no longer star forming) and have disks. So how did they get so massive on their own? The most massive galaxies in the Universe are thought to build up through mergers – but if these galaxies are isolated then this doesn’t seem to be a possibility for these objects!
This is Chris Lintott taking back over to blog Becky’s talk.
She’s discussing our elephant in the room – the fact that we don’t deal with kinematic morphologies; in other words, we classify galaxies by how they look, not how the stars and gas move within them.
Before that, though, she’s pointing out that the clean samples we assemble from our data – which require a threshold of, say, 80% of people to agree on a classification before a galaxy makes it in – throw out a huge number of galaxies. That works, says Becky, if you’re trying to assemble a sample of discrete bins, like the categories on the Hubble diagram, and not a continuous range of types of galaxies.
But! There’s a catch. If you care about kinematic morphology, there really is a true binary. Things are rotating as a disk or they are not. (The audience seems not necessarily to agree on this point; we’ll see what happens when we get to questions). To study kinematics we can use instruments like MaNGA, which I hope Becky described above during Sam’s talk – Becky tested us and though the majority could distinguish a rotating smooth galaxy from a non-rotating smooth galaxy, it certainly isn’t easy just by looking. (And we probably shouldn’t draw conclusions from a sample of one).
.@becky1505 testing us on identifying the kinematics of galaxies by the visual inspection of galaxy morphologies. We failed. #GZoo10 pic.twitter.com/OIQkD7GKgY
— galaxyzoo (@galaxyzoo) July 11, 2017
Becky reckons that only 20% of Galaxy Zoo smooth galaxies are ‘true’ ellipticals – those that don’t have a hidden disk-like rotation inside. How will this affect Becky’s work on fitting star formation histories? She does this using a code called StarPy, which uses statistics to decide when a galaxy started to stop star-formation and how fast that ‘quenching’ is happening. (There’s a nice description of StarPy on the blog here).
Using MaNGA to divide galaxies not by visual morphology, but by rotation, Becky has run Starpy and finds differences. Non-regular rotators – what we might call ‘true ellipticals’ – quench either quite fast or very fast; there were a bunch of smooth galaxies that only quenched slowly, but these now seem to be the regular rotators; disks hiding amongst the Galaxy Zoo smooth sample.

Becky finishes with this diagram, from a recent review of kinematic morphologies. She’s added the location of the elephant – she feels we’re good at distinguishing spirals but need to talk about the smooth ones. In questions, Karen reckons we can tell the difference visually, Jean Tate wanted confirmation that lenticulars rotate (they do!), and I reckon we need to think hard about statistics.
Becky is back!
Next up is Ross Hart who’s telling us all about his work for correcting for biases in Galaxy Zoo 2 data to get out a nice complete sample of spiral galaxies. The problem is that at greater distances it becomes harder to spot spiral arms as things get fainter.
#gzoo10 Hugging spiral arms all conference pic.twitter.com/WWTOlg1Bqs
— Alice Sheppard (@PenguinGalaxy) July 11, 2017
Ross’s code does a really nice job of recovering lots of spiral galaxies that would’ve been missed otherwise in the catalogue. Now we’ve got this catalogue we can use it to study the properties of spirals with arm number – turns out many armed spirals look a lot bluer than typical 2 armed spirals. Despite the fact that they appear blue (i.e. forming lots of hot, young, blue stars!), when Ross measures the star formation rate of these galaxies there is no dependance with arm number. But, he does find that more armed spirals have more hydrogen gas than 2 armed spirals, so might have more fuel for star formation in the future.
So what is actually happening in the spiral arms? Ross is now using an automated method to identify where the spiral arms in galaxies are called SpArcFiRe. Once the spiral arm locations have been identified, we can take off their light from the rest of the disk and just study what’s going on in the spiral arms and disk separately. Ross is currently working on these results but has some interesting preliminary results – so watch this space!
Now for something completely different! We’ve got Sebastian Turner from Liverpool John Moores University telling us all about automating galaxy classifications.
Our final speaker for today is @sebturne on using machine learning in classifying galaxies #GZoo10 pic.twitter.com/MoCS3Amyqo
— galaxyzoo (@galaxyzoo) July 11, 2017
He’s asking what are we going to do moving forward? How will we merge the efforts of computers and humans? Seb is working on using statistical clustering methods to pick out information from the data we already have about galaxies. Clustering methods can pick out groupings of features in a sample – Seb feeds in information about the mass, colour and shape of a galaxy and the machine returns how many groupings it thinks there are in this multi-dimension parameter space. This can tell us something more about galaxy evolution because as humans we could never visualise this multi-dimensional space. Seb is showing us how the clustering algorithm picks up the areas of the colour magnitude diagram that we’re used to including the blue cloud, red sequence and green valley. The groups it picks out also correlate nicely with Hubble type morphology as well which is encouraging! There’s a lot more work we can do with this including using the Galaxy Zoo classifications as an input to the algorithm.
Ross wanted to know if we could input kinematics into this as well? Seb definitely thinks it’s possible. Brooke then asked about how it was weird the algorithm picked out two groups in the blue cloud before it picked out a group for the green valley. Seb reckons a big issue is that the algorithm tries to equalise the numbers in the groups and there’s just so many galaxies in the blue cloud.
Next up is a summer student at the University of Oxford: Peter McGill. He’s been looking at star formation histories of galaxies (like me!) but in galaxies at greater distance (high redshift) in the COSMOS survey with images taken by the Hubble Space Telescope.
Oops turns out @sebturne was not our final speaker! It is @petermcgill94 on the star formation histories out to a redshift of z~1 #GZoo10 pic.twitter.com/UFFMnO1a82
— galaxyzoo (@galaxyzoo) July 11, 2017
In particular he’s focussing on figuring out what is stopping star formation (or quenching it) in the high redshift Universe. He’s using Starpy again (see Becky’s talk above!) to model the star formation history but has changed Starpy to take colours from the Hubble telescope rather than the SDSS. He’s looking at how these star formation histories change at different redshifts in the COSMOS survey and in comparison the results in the local Universe with SDSS. He’s showing plots where you can see how the rate that the star formation quenches at gets quicker for galaxies at higher redshift. His future work includes figuring out to include galaxy environment in these studies and changing the method to use a better algorithm to explore the parameter space!
Now we’re off to lunch and afterwards we’ll be having “un-conference” sessions where we’ll have lots of discussions. I’ll be live blogging later on when we report back – see you then internet!
We’re back! We’ve had a very productive afternoon discussing all the weird and wonderful things.
First up, Chris is telling us about a discussion half the team had about a paper draft from four years ago that we forgot existed. It got left by the wayside when the team ran into some problems with completeness of a spiral sample – however Ross’s current work has solved that for us! So we’re going to try completing it as a team again so watch this space.
Steven is now telling us about a session they had about integrating machine learning algorithms with Galaxy Zoo classifications (and Zooniverse classifications as a whole). So how will this affect the interaction of the volunteers with the site and the quality of the data we get out? The aim of this is to speed up classifications (for GZ2 from 6 months –> 1 month) since we’re moving into an era of even larger data sets. It will also hopefully mean the machine will do the boring stuff and the interesting stuff gets left in for the users (although that will vary with project). We have to be careful though not to put in too many good images though because research has shown there is a sweet spot for the amount of boring classifications to keep people classifying on the site. Also we want to make sure we’re still showing a representative sample of objects so that the public logging onto the site don’t get a biased view of what galaxies look like in the Universe. Could we have somewhere we still put retired (either by the machine or by humans) images for users to still explore these? The discussion then came back to what the main science goal of the Galaxy Zoo project is – is the final goal science or to make an interesting data set?
There was a hack session that also occurred to get a master data table for the MaNGA Galaxy Zoo classifications. We have them all, they’re just a bit scattered all over the place and need concatenate into one giant table.
Then the science team had a discussion about fast and slow rotators – can we actually do kinematic classifications by eye? We think we’re going to challenge the astronomical community to test this.
Then the science team had a talk about Talk. The discussion was focussed on the importance of needing to engage with the Galaxy Zoo community.
There was also another hack taking place this afternoon playing around with the Galaxy Zoo:3D data. Some of us got to grips with the data and tried to make some nice plots. One thing we did realise is that it might be worthwhile in getting about a third of the sample classified a bit further for better statistics.
We had a discussion about one of the tools that we use as a team to infer star formation histories; Starpy. We want to update this code to use a more robust statistical algorithm to get results.
Whilst that was going on, there was also a discussion about how to engage more with undergraduate students. One idea was to have a summer camp with undergraduates who will be engaging in research in the future – teaching them about citizen science, interacting with data, coding skills with a focus on Python – similar to the .Astronomy summer camp or the LSST data camp. Perhaps this could be tied in each year with a science team meeting? Also users may also enjoy this type of summer camp idea as well!
And that’s it for science for the day! We have our formal conference dinner tonight though so we’re all looking forward to socialising over a delicious dinner. Until next time internet!
