
Galaxy Zoo on the "Curious" Podcast

Just wanted to put up a quick post to point out that the latest podcast from the people who run Ask an Astronomer @ Cornell discusses citizen science, and I’m interviewed on it about Galaxy Zoo stuff.
Link to the podcasts in iTunes.
Merry Christmas! Karen.
Galaxy Crash Debris: Post-merger Spherodials paper now out!
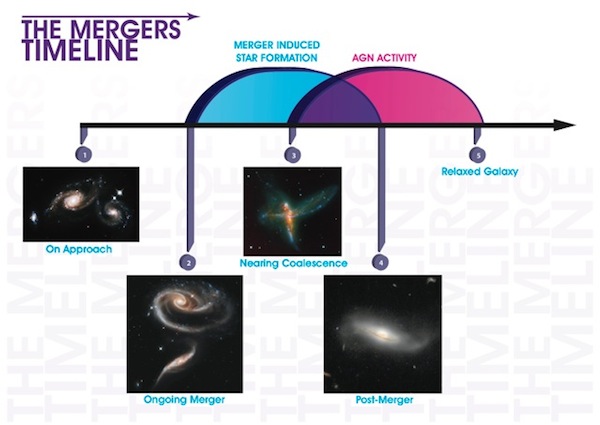
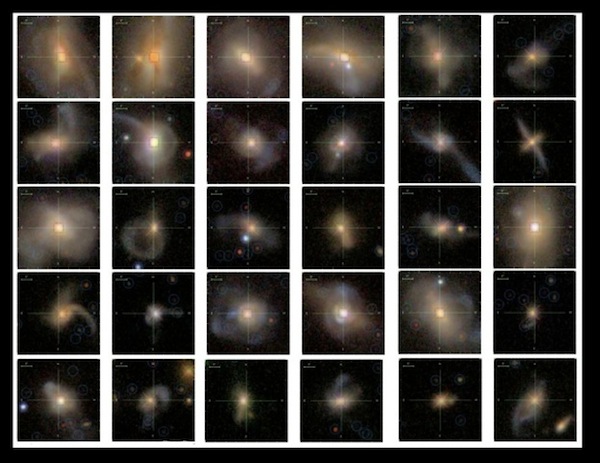
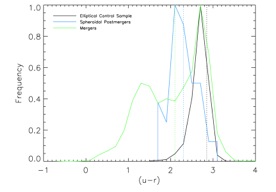
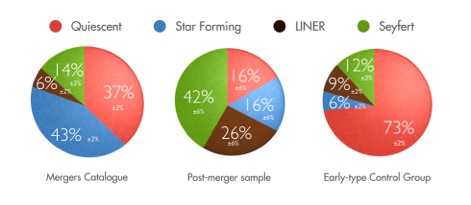
The specific subset we chose are the likely predecessors of elliptical galaxies, and we compared them to the general merger and an elliptical control sample to see how the properties of galaxies evolve along the merger. The SPMs are part of a sample classified by Galaxy Zoo as post-mergers. We looked at this sample again and we picked the ones which look mostly bulge dominated, a key feature of galaxies that are likely to be precursors of elliptical galaxies. You can see in the figure below how, even though these galaxies are similar in morphology to elliptical galaxies, they appear to be in the process of relaxing into relaxed ellipticals.
Post-starburst galaxies paper accepted!
Great news everybody!
The post-starburst galaxies paper has now been accepted by MNRAS. You can find the full paper for download on astro-ph.
GZ1 used for the fractions of early-types in clusters
We’re happy to report that we have once again used your (now public) GZ1 classifications to find an interesting result.
We use the classifications in a study we just submitted to MNRAS (or see the arXiv entry for a copy) looking at the observed fractions of early-type galaxies (and spiral galaxies), in groups and clusters of galaxies.
Recent work (De Lucia et al. (2011), which posted to the arxiv in September), used sophisticated semi
analytic models to determine the properties of galaxies found in massive
clusters in the Millennium Simulation. They identified elliptical galaxies
(or more accurately early-type galaxies) in the simulation, and found that the fraction these
galaxies, remained constant with cluster halo mass, over the range 10^14 to
10^14.8 solar masses. They compared their results with previous
observational studies which each contained less than 100 clusters.
With GZ1 we realised we could put together a much larger sample. We
used galaxies with GZ1 classifications, cross matched with cluster and
group catalogues, to compare the above results with almost 10 thousand
clusters. We found that the fraction of early-type galaxies is indeed
constant with cluster mass (see the included figure), and over a much larger range of 10^13 to 10^15
solar masses (with covers small groups of galaxies to rich clusters), than previously studied. We also found the well known result (to astronomers) that outside of groups and clusters, the fraction of early-type galaxies is
lower than inside of groups and clusters.

Plot showing the fraction of early-type galaxies (red lines) as a function of halo mass. We used two different halo mass catalogues, and the agreement between them is excellent. We also examine the fraction of spiral galaxies with halo mass (blue lines)
This work suggests that galaxies change from spiral to early-type when individual
galaxies join together to form small groups of galaxies, but that going from groups to rich clusters does not significantly change the morphologies of galaxies.
Without the GZ1 results at our finger-tips, this work, which was devised,
implemented, and written up in less than 2 months, would have taken much
longer to complete.
Thanks again for making the Zoo such a wealth of information,
Ben Hoyle (on behalf of Karen Masters, Bob Nichol, Steven Bamford, and Raul Jimenez)
First look at Hubble's first look at the first Voorwerpje
The bits are still warm, having just been downlinked from Hubble overnight. There is still a good bit of processing to be done, cleaning up cosmic rays and so forth. But that said, here is our first look at SDSS 2201+11, first of the Galaxy Zoo AGN cloud galaxies (AKA voorwerpjes) to come up on the telescope’s schedule. As a reminder, as waveney just posted in yesterday’s Object of the Day, here it is in the SDSS images:
And now what we’ve all been waiting for! First up, the galaxy in a narrow filter that includes the strong [O III] emission from the clouds at this redshift:
emission”]![Hubble image of SDSS 2201+11 with [O III] emission](https://blog.galaxyzoo.org/wp-content/uploads/2011/11/sdss2201-hsto3.jpg)
And one in a filter including H-alpha emission, which is several times fainter in such highly ionized gas:
SDSS 2201+11 HST image with H-alpha
And finally, in the tradition of vacation photographs everywhere, a shot of just the galaxy (in this case a medium-width filter near the standard i band to show the stars and dust but not the gas):

SDSS 2201+11 Hubble i image
First inspection shows that the galaxy has been disturbed – the dust lanes twist. One of them trails right off into one of the gas clouds, adding to our evidence that ionized tidal debris often shows up in this way. That also suggests which cloud is on the near side, so we have a clue about the time delays experienced by the radiation we see from each one as it has been affected by possible changes in the nucleus. There are interesting holes and curlicues in the gas, as well.
Further processing will show us more. And there are six galaxies to go! (These should dribble in throughout 2012 – we just got an appetizer).
New Bar Paper Submitted to MNRAS
I’m happy to report that this week we submitted a new paper (to the Monthly Notices of the Royal Astronomical Society) using your bar classifications from Galaxy Zoo 2. The paper appears on astroph this morning (paper link here).
The title of the paper is shown below.

Ramin Skibba (who wrote one of the early Galaxy Zoo papers on the morphology-colour-environment relations) led this study into how the chance of finding bars and bulges in disc galaxies depends on the environment the galaxy is found in. We’re interested to find this out – particularly how the chance of finding a bar depends on environment – to help with the interpretation of our finding that redder disc galaxies are much more likely to host bars (which has now also been seen in other samples, and illustrated beautifully in one of the first figures from the paper, below – look at the blue lines which show the probability of finding a bar in a disc galaxy against it’s colour, with red to the right). Previous studies of the effect of environment have not had as many galaxies as we have (thankyou again), and have come up with contradictory answers as a result (for references see Ramin’s paper), so being able to do this study with a huge sample of galaxies with visually classified bars has been really fantastic.

Ramin used a technique called marked correlation functions to look for the effect of environment on the chance of a disc galaxy having a bar (or bulge). A correlation function (in astronomy at least) gives the probability that you’ll find two galaxies separated by a particular distance. We plot the “correlation” as a function of this separation (usually called r). The higher the correlation function (w(r)) is at some separation the more likely it is that you’ll find galaxies clustered on that scale. Practically this is measured by counting pairs of galaxies separated by each separation, r, and comparing it to the number of such pairs you’d find in a completely randomly arranged sample of galaxies.
The only difference with a marked correlation function is that in addition to simple counting of pairs, each galaxy is weighted by some “mark” (or number from zero to one). For example, in our paper we mark the galaxies by the fraction of you who classified the galaxy and clicked that you saw a bar – which we called p_bar. So two galaxies with a high fraction of “bar clicks” separated by a distance r would count more in the marked correlation function than two with a low fraction of “bar clicks”.
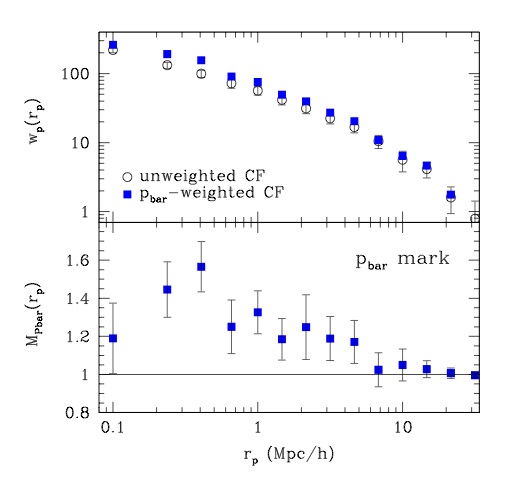
Our main result is shown above. The top panel shows the correlation functions of the whole sample, both with and without the weighting by p_bar. The bottom panel shows the ratio between those two correlation functions – so basically it shows the scales at which you’re more likely to a pairs of barred disc galaxies than a pair of any two random disc galaxies. This shows us that on the smaller scales barred disc galaxies are more strongly clustered than disc galaxies in general. The clustering peaks at about 0.4 Mpc/h (where Mpc/h are fantastic astronomers distance units which show our mistrust of the value of the Hubble constant; h = H0/100 km/s/Mpc, so is probably about h=0.7; so 0.4 Mpc/h is probably about 0.6 Mpc, or about 2 million light years) which is interestingly about the scale where most galaxies will be satellites of larger halos (ie. galaxies in groups). It is also interesting that on the very smallest scales the ratio drops back down to almost one – showing that for very close pairs disc galaxies are not more likely to have a bar.
Ramin (and of course also Steven using a different method) had previously shown that redder disc galaxies are more strongly clustered than bluer ones, so we had to wonder how much of the extra clustering of barred disc galaxies was just due to them being preferentially in red discs…. Ramin tested this using a really neat little trick, which he called “shuffling the marks”. Basically he took all galaxies of a similar colour and randomly shuffled the p_bar number within the group. If the bar-environment correlation was entirely due to the colour-environment correlation doing this for all the galaxies should result in no change in the marked correlation function. And in fact this is almost what we saw (below: the red triangles almost match the white circles). On most scales the bar-environment correlation can be explained by red discs being more strongly clustered, except right around the 0.4 Mpc/h scale (which likely represents galaxies in small groups) where in simple terms – we see some excess clustering of red discs with bars over the clustering of red discs in general.

This finding suggests that something about the group environment may be triggering bar formation. In addition the downturn at small scales (if real) suggests that once galaxies get really close and start interacting they are not more likely to have a bar.
There is a whole lot more information in Ramin’s paper, which as usual is an excellent and densely packed piece of work, so I hope you’ll forgive me for stopping here after explaining only the main result on the barred disc galaxies. It’s really been a pleasure working with Ramin on this study, and I just wanted to give you a flavour of the interesting results we have found.
The relative importance of bars (and other forms of “secular evolution” – generally used to mean slow internal processes acting on a galaxy) is turning into a hot topic in astronomy; with an entire session at the upcoming International Astronomical Union General Assembly (being held in Beijing in August 2012) devoted to “Galaxy Evolution through Secular Processes” so I expect you’ll be hearing a lot more about this.
To finish up a pretty (ish) picture. The top row shows examples of galaxies with pbar=0 (ie. no-one could see a bar), then pbar=0.2; pbar=0.5 and pbar=1.0 (all of you saw a bar).

How to Navigate the Astro Literature, Part 1
So you want to learn about current astrophysics research? You’re in luck! Not only are there many excellent blogs, pretty much all of the peer reviewed literature is out there accessible for free. In many areas of science, the actual papers are behind paywalls and very expensive to access. Astrophysics, like a few other areas of physics and mathematics, puts most papers on the arxiv.org preprint server where they are all available for download form anywhere. In addition, we have a very powerful search tool in the form of the NASA Astrophysics Data System which allows you to perform complex searches and queries across the literature.
Suppose you wanted to learn more about the green peas, one of our citizen science-led discoveries. Your first stop could be the ADS:
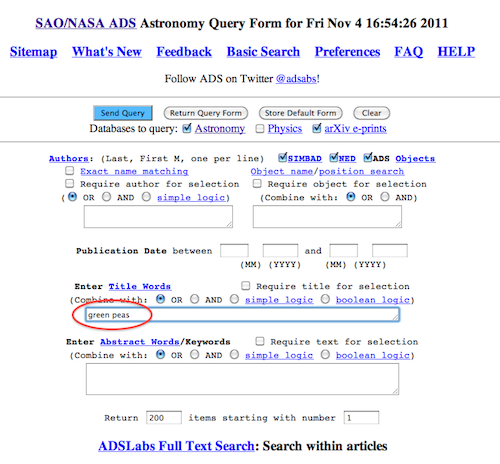
ADS, like any search engine, will now scour the literature for papers with the words “green peas”, “green” and “peas” in it, and return the results:
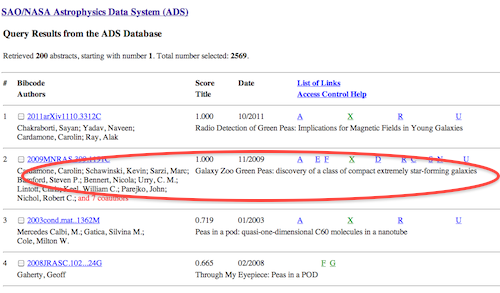
As you can see, the discovery paper of the peas, “Cardamone et al. (2009)” is not the first hit. That’s because in the meantime there has been another paper with “green peas” in the title. You can click on Cardamone et al. and find out more about the paper:

This is just the top of the page but it already contains a ton of information. Most importantly, the page has a link to the arxiv (or astro-ph) e-print (highlighted). Clicking there will get you to the arxiv page of the paper where you can get the full paper PDF.
Also there is a list of paper which are referencing Cardamone et all, at the moment 23 papers do so. By clicking on this link you can get a list of these papers. Similarly, just below, you can get a list of paper that Cardamone et al. is referencing.
Lower still are links to NED and SIMBAD, two databases of astronomy data. The numbers in the brackets indicate that SIMBAD knows 90 objects mentioned in the paper, and NED knows 88. By clicking on them, you can go find out what those databases know about the objects in Cardamone et al. (i.e. the peas).
Obviously there’s a lot more, but just with the arxiv and NASA ADS you can search and scour the astrophysics literature with pretty much no limits. Happy resarching!
Voorwerpjes – results now ready for prime time!
Yesterday marked a milestone in the Galaxy Zoo study of AGN-ionized gas clouds (“voorwerpjes”), when we received notice that the paper reporting the GZ survey and our spectroscopic study of the most interesting galaxies
has been accepted for publication in the Monthly Notices of the Royal Astronomical Society. We’ve now posted the preprint online – at http://arxiv.org/abs/1110.6921 on the preprint server, or, until publication, I have a PDF with full-resolution graphics. Here’s the front matter:
The Galaxy Zoo survey for giant AGN-ionized clouds: past and present black-hole accretion events
Read More…
Update on the "Violin Clef" merger: redshifts and Merger Zoo
Hi everyone,
Since I haven’t posted here before, I’d like to introduce myself. My name is Kyle Willett, and I’m a postdoc working at the University of Minnesota in Lucy Fortson’s group. My work for Galaxy Zoo includes development of the next generation of tools that Zooites can use to explore galaxies and conduct their own research. My own scientific focus is on high-energy active galaxies, for which our group is using Sloan and Galaxy Zoo data to try and quantify the environmental properties.
For this post, I’d like to talk about follow-up work we’ve been doing on a recent discovery. About a month ago, Galaxy Zoo contributor Bruno discovered an example of a spectacular merger in the Sloan DR8 data that looked like a triple, or possibly quadruple system. It’s been informally dubbed the “Violin Clef” or the “Integral” based on its shape:

SkyServer image: http://goo.gl/qhFRc
This system is scientifically interesting for several reasons. While merging galaxies are common throughout the universe, the merging process is relatively quick compared to the total lifetime of a galaxy. Catching a system with long tails and multiple companions is rarer, and gives us the chance to match our models of galaxy interaction against a system “caught in the act”. This is one of the main drivers of Merger Zoo, and a system like this is a good test to see if we can reproduce the tidal features. If so, then we can start to think about the bigger picture, and predict how often you’d expect a multi-galaxy merger like this to occur.
We’re also interested in the gas and stellar content of the galaxies and their tails. In most merging systems, gas in the galaxies is gravitationally compressed, which leads to a burst of new star formation in the galaxies and their tails. Since this results in more young and hot stars, the colors of these galaxies are typically blue in the Sloan bands. However, all four galaxies and the tidal tails in this system are red. If that’s the case, then we want to estimate the current age of the system. Were the galaxies all red ellipticals to begin with, with very little gas that could form new stars? Or has the starburst already come and gone – and if so, how long-lived are these tidal tails going to be?
After Bruno’s discovery, the team started by looking at what other archived observations could tell us. An ultraviolet image from the GALEX satellite showed no strong UV source in the system. Radio observations showed a point source in the system that might be consistent with weak star formation. This convinced us that we needed an optical spectrum of the system.
Spectra give several crucial pieces of information – first, by measuring redshifts we can determine an accurate distance. This tells us whether all four galaxies genuinely belong to a single interacting group, or whether some appear in projection. Knowing the distance, we can also use the UV and radio flux measurements as diagnostics of the total star formation rate. Finally, with really accurate spectroscopy, we might be able to measure the kinematics of the galaxies, and measure the velocities to get a 3-D picture of how the four members are interacting.
Since Sloan doesn’t have a spectrum of this system, we needed more observations. Danielle Berg, a graduate student at the University of Minnesota, observed the Violin Clef in September using the 6.5-meter Multiple Mirror Telescope in Arizona and obtained two optical spectra.
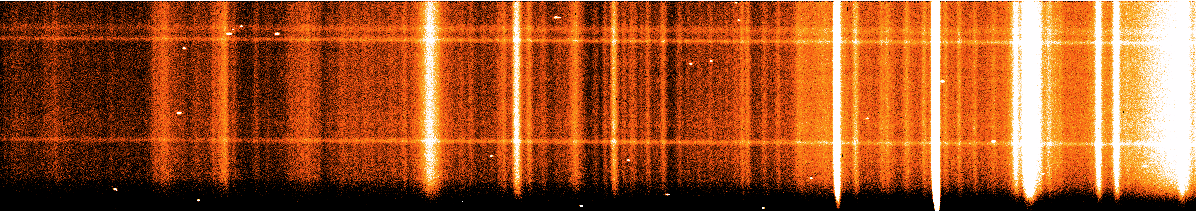
Raw optical spectra of the Violin Clef
The analysis has shown that all four galaxies lie at the same redshift (z=0.0956 +- 0.002), and are likely all genuine members of the same group. None of the galaxies show evidence of strong star formation, confirming the red colors that we see in the Sloan data.
The next step in the analysis will be working with simulations like the ones in Merger Zoo. Having confirmed that this really is a quadruple merger will significantly constrain the merger models, and hopefully give us well-defined parameters for the age and history of the system. This is a step that Zooites can help with – if you go to http://mergers.galaxyzoo.org/merger_wars, you can identify simulations that resemble the Violin Clef. We need more clicks at this point, so please consider going to Merger Zoo and helping out! We hope that this will result in another scientific publication soon for the Galaxy Zoo team, and it’s been an exciting project to work on.
– cheers,
Kyle
