
Galaxy drumstick, anyone?
Over the past six years, Galaxy Zoo volunteers have spotted innumerable patterns in the shapes of regular, merging, and fortuitously overlapping galaxies in the various surveys. While we’ve had great success with letters of the alphabet and with animals, searches of both the Forum and Talk haven’t revealed many turkeys so far. In recognition of Thanksgiving in the U.S. this week, we offer this turkey drumstick (or tofurkey, if you’re a veggie like some team members) spotted last year by volunteer egalaxy.

A galaxy (or pair?) at z=0.436, spotted in Galaxy Zoo: Hubble
For those of you who get them, enjoy the break — and let us know what you think about this interesting galaxy (or possible overlapping pair)!
Galaxy Zoo and undergraduate research: spiral arms, colors, and brightnesses
The guest post below is by Zach Pace, an undergraduate physics student at the University of Buffalo. Zach worked at the University of Minnesota during the summer of 2013 through the NSF’s Research Experience for Undergraduates (REU) program. Zach is continuing to work with Galaxy Zoo data as part of his senior thesis.
Hi, everyone–
My name is Zach Pace. I’m an undergraduate physics student from the University at Buffalo, and I’ve been working on the Galaxy Zoo 2 project at the University of Minnesota since late May with Kyle Willett and Lucy Fortson. My investigation has been twofold: I have been diagramming specific morphological categories in color-magnitude space, and also fitting those data to mathematical functions.
As many readers probably know, a galaxy’s magnitude (overall brightness in the red band, on a log scale) and a galaxy’s color (the difference between the blue magnitude and a red band) are two important quantities for determining what a galaxy might look like (and how it might evolve). Brighter galaxies have more mass (more stars produce more light, of course), and bluer galaxies have a more recent star formation history (this is because young, bright stars tend to be large, bright, and blue). In terms of the whole population, we know, for instance, that elliptical galaxies tend to concentrate in a red sequence, and have typical colors between 2.25 and 2.75. Conversely, the vast majority of spiral galaxies concentrate in a blue cloud between colors 1.25 and 2.0. These two populations are clearly separated in color-magnitude space (this can be seen in the accompanying 2-D histogram, made from Zoo 2 data).

Color-magnitude diagram (CMD) for objects in Galaxy Zoo 2. The lines show fits to the two main populations of elliptical (red) and spiral (blue) galaxies, following the method of Baldry et al. (2004). The green line shows an approximate separation between them.
One of the main goals of Zoo 2 is to gauge the extent to which morphology informs physical characteristics like color and magnitude, so my objective for the summer was to come up with good representations of color and magnitude for all of the smaller sub-populations in Zoo 2.
Several of my results were interesting and surprising. For instance, it has been suggested that spiral galaxies with more arms and spiral galaxies with tighter arm winding (which is to say, a shallower pitch angle) tend to be brighter and bluer. This can be intuitively understood as follows: tighter winding of spiral arms and the presence of more spiral arms indicate, on average, denser gas clouds in those arms, which is tied to increased star formation and bluer color. However, I wasn’t able to measure this in the Zoo 2 data (all the differences were on the order of the histograms’ bin size, about 0.1 magnitude, or about a 10% difference in brightness). This suggests that spiral galaxies, no matter arm multiplicity or winding, are drawn from the same base population.

Color-magnitude diagram (CMD) for spirals in GZ2, split by the number of spiral arms identified in each galaxy. The distribution of colors and magnitudes for galaxies are statistically similar, no matter what the number of spiral arms.
I also came across something unexpected when looking at bulge sizes in face-on disk galaxies. The distribution of galaxies classified by users as bulgeless is starkly different from the distribution of obvious bulge and bulge-dominated galaxies. Furthermore, the population with a bulge that is just noticeable seems to form an intermediate population between the bulgeless and bulge. This observation is also borne out in edge-on disk galaxies: the population of bulgeless edge-on galaxies has a similar shape to the population of face-on galaxies, albeit with stronger reddening on the bright end.

Color-magnitude diagram (CMD) for disk galaxies in Galaxy Zoo 2, split by the relative size of the central bulge. Galaxies that appear to have no central bulge (top) have very different colors and luminosity than those with dominant bulges (bottom).
To fit the distributions, I used a method pioneered about 10 years ago by Ivan Baldry, which fits one parameter after another in our profile functions to find a distribution that converges onto the best fit. It works okay (but not great) for the whole sample, and it fails pretty badly when working with the smaller sub-populations. This is because I have to fit many parameters at once, and do that a bunch of times in a row for the fit to converge, so there are a lot of points of failure. I’m working now at Buffalo towards finding a different and better fitting routine, which will allow us to represent more distributions mathematically.
If you have any questions, feel free to comment below.
Studying the slow processes of galaxy evolution through bars
Note: this is a post by Galaxy Zoo science team member Edmond Cheung. He is a graduate student in astronomy at UC Santa Cruz, and his first Galaxy Zoo paper was accepted to the Astrophysical Journal last week. Below, Edmond discusses in more depth the new discoveries we’ve made using the Galaxy Zoo 2 data.
Observations show that bars – linear structures of stars in the centers of disk galaxies – have been present in galaxies since z ~ 1, about 8 billion years ago. In addition, more and more galaxies are becoming barred over time. In the present-day Universe, roughly two-thirds of all disk galaxies appear to have bars. Observations have also shown that there is a connection between the presence of a bar and the properties of its galaxy, including morphology, star formation, chemical abundance gradients, and nuclear activity. Both observations and simulations argue that bars are important influences on galaxy evolution. In particular, this is what we call secular evolution: changes in galaxies taking place over very long periods of time. This is opposed to processes like galaxy mergers, which effect changes in the galaxy extremely quickly.

Examples of galaxies with strong bars (linear features going through the center) as identified in Galaxy Zoo 2.
To date, there hasn’t been much evidence of secular evolution driven by bars. In part, this is due to a lack of data – samples of disk galaxies have been relatively small and are confined to the local Universe at z ~ 0. This is mainly due to the difficulty of identifying bars in an automated manner. With Galaxy Zoo, however, the identification of bars is done with ~ 84,000 pairs of human eyes. Citizen scientists have created the largest-ever sample of galaxies with bar identifications in the history of astronomy. The Galaxy Zoo 2 project represents a revolution to the bar community in that it allows, for the first time, statistical studies of barred galaxies over multiple disciplines of galaxy evolution research, and over long periods of cosmic time.
In this paper, we took the first steps toward establishing that bars are important drivers of galaxy evolution. We studied the relationship of bar properties to the inner galactic structure in the nearby Universe. We used the bar identifications and bar length measurements from Galaxy Zoo 2, with images from the Sloan Digital Sky Survey (SDSS). The central finding was a strong correlation between these bar properties and the masses of the stars in the innermost regions of these galaxies (see plot).
.")
This plot shows the central surface stellar mass density plotted against the specific star formation rate for disks identified in Galaxy Zoo 2. The colors show the average value of the bar fraction for all galaxies in that bin. This plot shows that the presence of a bar is clearly correlated with the global properties of its galaxy (Σ and SSFR).
We compared these results to state-of-the-art simulations and found that these trends are consistent with bar-driven secular evolution. According to the simulations, bars grow with time, becoming stronger (they exert more torque) and longer. During this growth, bars drive an increasing amount of material in towards the centers of galaxies, resulting in the creation and growth of dense central components, known as “disky pseudobulges”. Thus our findings match the predictions of bar-driven secular evolution. We argue that our work represents the best evidence of bar-driven secular evolution yet, implying that bars are not stagnant structures within disk galaxies, but are instead a critical evolutionary driver of their host galaxies.
GZ: Quench data update
Since finishing the classifications for the GZ: Quench project, many of our volunteers have been analyzing that consensus data using the tools at tools.galaxyzoo.org. We made a few changes to the site earlier this week, and I’d like to describe them and talk about how it might affect your work on the project.
First, a quick reminder of how the data is presented. As most of you probably remember, the classification process on GZ: Quench (and all GZ projects since GZ2) is what we call a “decision tree”. We begin with a broad question on morphology (ie, “Is this galaxy smooth, or does it have features or a disk?”) for the volunteer to answer. We then ask more specific follow-up questions that depend on the previous answers. For example – if you said the galaxy doesn’t have any spiral arms, it doesn’t make sense for us to then ask you how many arms there are – it doesn’t apply to this galaxy! So, out of 11 potential questions covering galaxy morphology, a single classifier will only answer a subset (between 4 and 9) of them. Here’s a flowchart of the decision tree for GZ: Quench — it’s an interesting exercise to look at it and work out how many unique morphologies you could sort galaxies into by going through the tree.

Flowchart of the morphology decision tree for GZ: Quench
So, why this discussion? When we added the data to the Tools website, we added a label in each category that gave the most common response to that question. For example, under “Arm tightness”, you could see that all galaxies were either “Tight”, “Medium”, or “Loose”. However, this is problematic when you’re trying to analyze data and compare different sets of galaxies. For smooth (or elliptical) galaxies, though, this arm classification is the result of very few votes (or even none) — they don’t represent the majority of classifications, and thus we really shouldn’t be including them when trying to compare what makes a medium-wound vs. a loosely-wound spiral.
The solution we’ve adopted has been to edit the data on Tools — questions whose answers don’t apply to the consensus morphology (eg, spiral arms in a smooth galaxy, or the roundness of a spiral) are now blank. This means that if you look at the average color or size of any of these morphology properties, you’re now truly comparing similar groups of objects (apples to apples). Including other galaxies in earlier samples likely introduced a significant amount of bias – the science team thinks that this will largely help to address that.
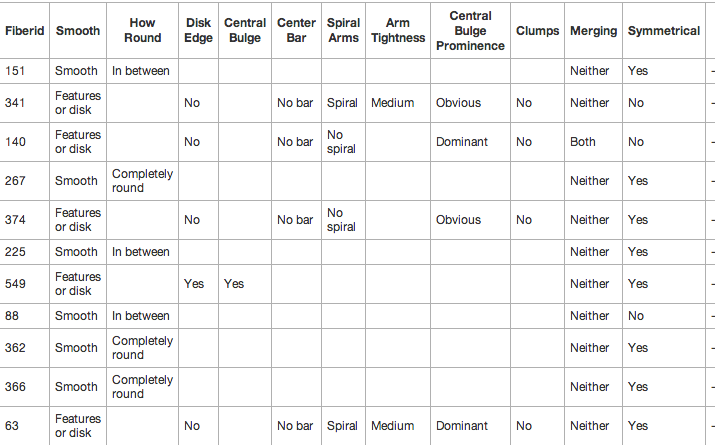
Example of the new GZ: Quench classification set in Tools
What does this mean for your analysis? Most of your old Dashboards and results should still work and remain valid results. For any work where you were analyzing morphological details (especially for spiral structure), though, we encourage you to revisit these and run them again on the new, filtered dataset. Please keep posting any questions you have on Talk, and we’ll answer them as soon as we can. Good luck!
SDSS Data Release 10 and Galaxy Zoo 2
Since the original launch of the Sloan Digital Sky Survey (SDSS) in 2000, the data from the project has been released to the public on a timescale of every year or two. These Data Releases include both new observations from the telescope, as well as refinements to old data based on improving the processing and reduction routines.
Today, Sloan announced that Data Release 10 (DR10) is now available to both the general astronomy community and to the public. It contains the first release of spectra from the APOGEE experiment, which has been observing tens of thousands of red giant stars in the Milky Way. It also includes new data from BOSS, which has been measuring redshifts for distant galaxies in order to measure cosmological parameters and study structure formation.
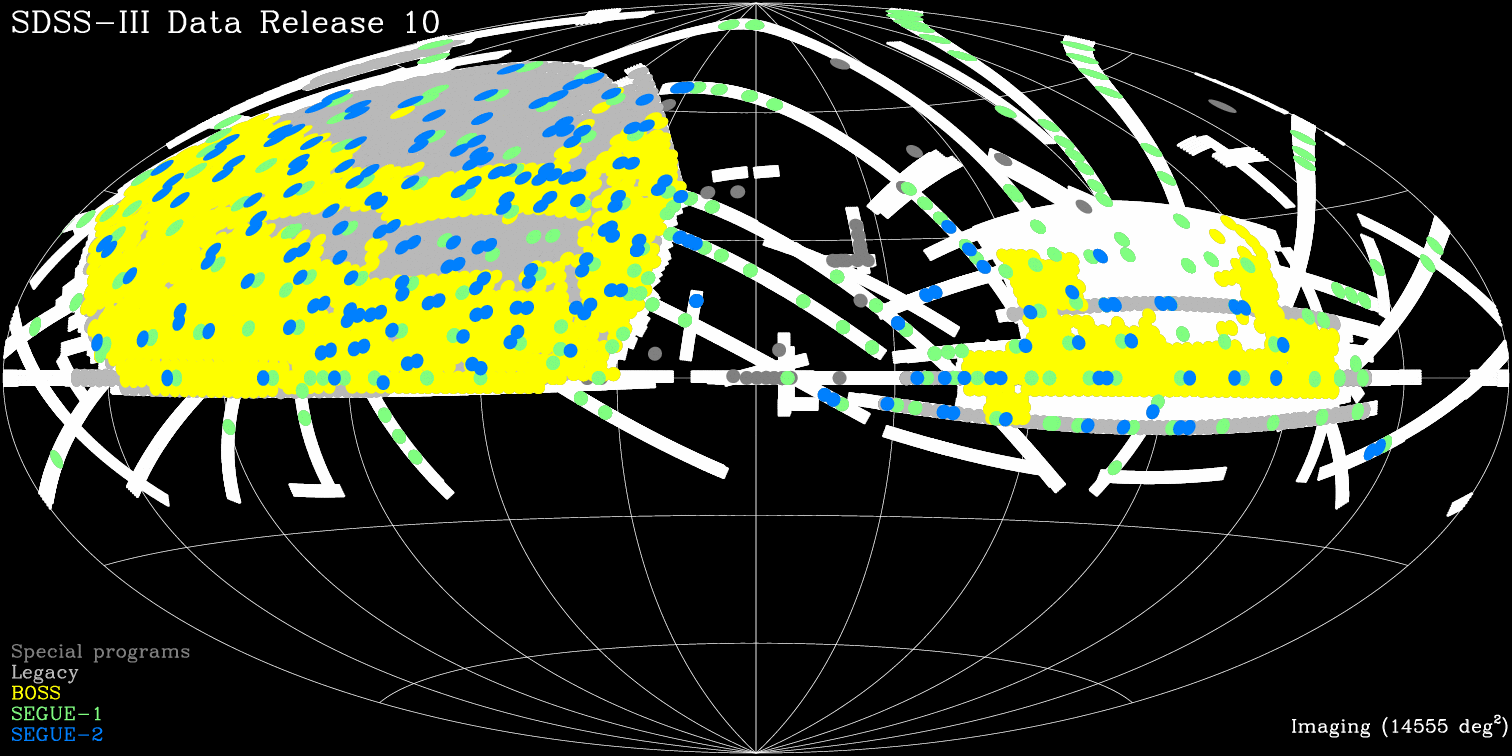
Sky coverage of the SDSS data contained in DR10
The original data from Galaxy Zoo was included in the SDSS Data Release 8. That’s quite important for a couple of reasons. It makes it much easier for scientists to use the GZ data, since SDSS uses this as the input for their own database, called CasJobs. This database enables matching of morphologies to other properties of the galaxies that SDSS measures, such as color or size. It also provides one of the main means of access to the data for people who aren’t members of the Galaxy Zoo team. Finally, it’s a validation that your GZ classifications have become a core data product of the survey, and something which is worth preserving and sharing as widely as possible.
In DR10, we’re happy to announce that data from Galaxy Zoo 2 is available for the first time. The reduction and description of the data is covered in a recent paper, which received a very favorable referee report a couple of weeks ago and will be resubmitted soon. We’ll share the paper as soon as it’s been formally accepted. The GZ2 data will also be hosted on our own site within Galaxy Zoo in the near future.

Galaxy Zoo 2 data is now on CasJobs!
Please check out DR10 if you’re interested in peeking at the GZ2 data – do acknowledge both Willett et al. (GZ2) and Ahn et al. (DR10) if you end up using it, though. Congratulations to the SDSS team on this new release!
Galaxy Zoo 2 at the AAS meeting
This post was written by Kyle Willett. He is a postdoc at the University of Minnesota and a member of the Galaxy Zoo science team.
It’s been a couple of weeks since the 221st meeting of the American Astronomical Society (AAS) in Long Beach, California. Kevin and Bill already made several excellent posts on their conference experience (tip: showing data hot off the telescope and having Swiss chocolate at your poster really generate foot traffic). I wanted to write a bit more about the research that I presented and how it related to other topics at the meeting.
My poster was up during on the third day of AAS, in the “Catalogs” section of the big poster hall. This is a bit unusual in that the posters there were sorted more by their methods, rather than science content. A group like this is useful for identifying projects with similar challenges, including curation of large data sets, reduction techniques, and how to best publish the data so the scientific community will recognize and use it. The content varies widely, though – I got to compare what galaxy morphologies might have in common with catalogs of bright stars, exoplanets, and infrared mosaics.

Kyle Willett (@kwwillett) talking about GZ2 with Nicole Gugliucci (@NoisyAstronomer). Photo by W. Keel.
The content of my poster focused on three topics. The first was a description of the Galaxy Zoo 2 project, describing the new questions we developed (and that you answered) and the sample of galaxies in the Sloan Digital Sky Survey that the results cover. This is slightly different from the original Galaxy Zoo, since GZ2 uses a brighter sample of galaxies in which more detail can be seen.
The second portion was my work on data reduction for the Galaxy Zoo 2 catalog; in particular, the way in which we demonstrate that more distant galaxies appear smaller and dimmer in the classification interface, and how this can be corrected. I showed data for 4 of the questions (smooth vs. features? is it an edge-on disk? is there a bar? are there spiral arms?) as examples of successful corrections that we’ve already done. The remaining 7 are being finished this week, with results looking good so far.
Finally, I had a section summarizing the science results from using Galaxy Zoo 2 data. So far, these have all been led by members of our own science team (which you can find here). Our goal in releasing the full catalog, though, is to make GZ2 a community resource – we want other groups to use the data and write even more interesting papers. We know we have a unique data source – the challenge is to reduce it properly, put it in a useful public format, and help publicize it by writing papers and attending conferences.
I had a lot of good conversations with other astronomers at this meeting, many of whom are very keen to see the data come out. Several interesting presentations raised questions we can explore with GZ2. I was intrigued by Michael Rutkowski’s (Arizona State) talk on the surprising amount of star formation and diversity amongst early-type galaxies, as well as Benjamin Davis’ (Arkansas) talk on using computers to measure the angle of spiral arms and how it relates to their central black holes.
Overall, it was a great meeting both for general astronomy and for Zoo-related projects. The science team and I are finishing the first draft of the data release paper this month, and we’ll be submitting it to a journal shortly after. I’ll keep writing as we make progress – as always, thanks for your classifications that make my work possible!
