
Zooniverse Goes to Mauna Kea, Day 1: High Winds

(…more like Day 1.5. We arrived late last night in Hilo, HI after about 24 hours of traveling for the Oxford contingent and mere 14 hours of travel for myself).
Chris, Becky, Sandor, and I are at Mauna Kea to use the CSO telescope to look for blue elliptical galaxies. Or at least they are. I’m just here with my American driver’s license to be the chauffeur. As the non-astronomer in the group, I think it’d be fun to give an outsider’s perspective into what an observing trip is like.
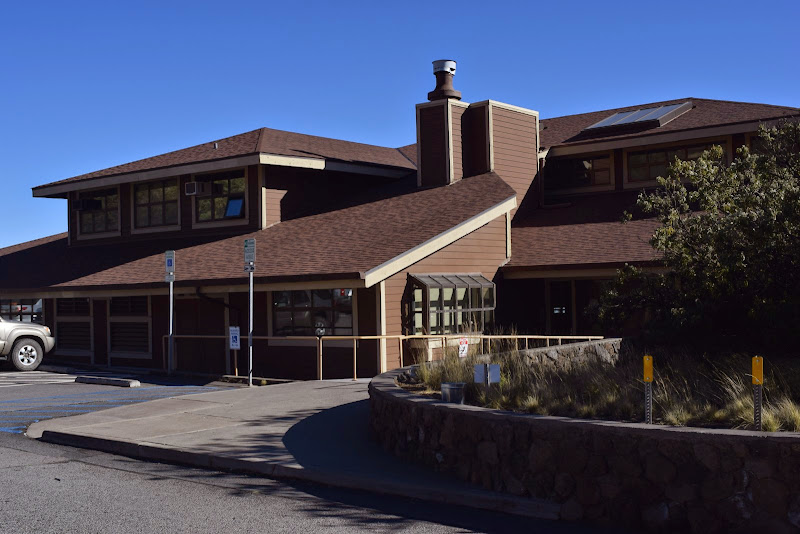
We’re staying at Hale Pohaku, just downhill from the observatories. It’s name means ‘Stone House’, referring to the original structure built by the CCC during the 1930s. It lets visiting observers acclimatize to the high altitude of Mauna Kea. (As Zooniverse readers may know, altitude sickness is not fun.)

Plotting their course of action
While the weather at Hale Pohaku has been beautiful, it is also amazingly windy. So amazingly windy that we weren’t able to start observing tonight when the sun set. Instead we’re reduced to sitting in the common room refreshing a page of anemometer readings hoping that it will drop down below the maximum 35 mph wind speed we can operate the telescope at.

struggling to open the car door in the wind
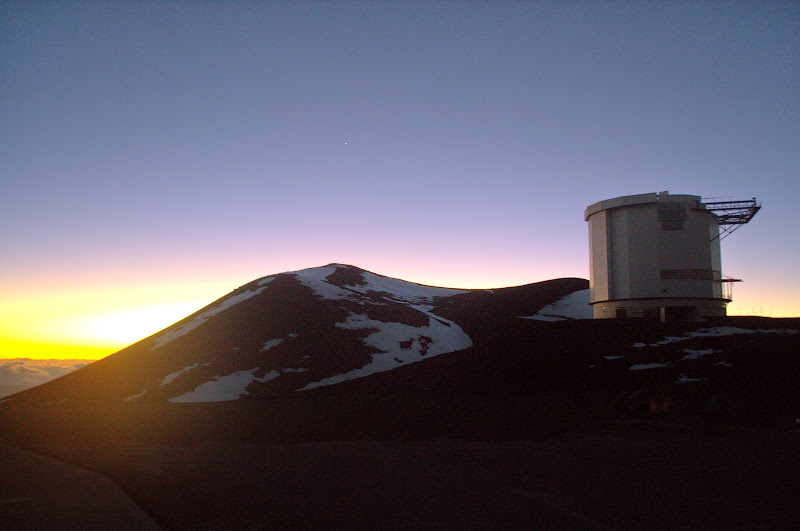
We did get to drive up to the summit of Mauna Kea to visit CSO with its manager Simon Redford. Driving the road up the mountain was quite the trip. It’s 5 miles of winding back and forth dirt road that ascends from 9,000ft (2,740m) to 13,000ft (3,960m), but it did give us a spectacular view.
The JCMT which is right next to the CSO
You can find more photos of the trip on our album. We’ll be adding to it throughout out stay. Hopefully tomorrow we’ll have some actual observing news to share.
ATLAS data and Radio Galaxy Zoo: more details
(This post was co-written with Minnie Mao, an RGZ science team member and postdoc at the National Radio Astronomy Observatory in New Mexico.)
Thanks again for starting your work on the new images from the ATLAS survey! We wanted to talk more about how/why these images differ from the existing FIRST images, including details on the telescopes, survey data, and our science goals.
1. What kind of telescopes are used to take the new images?
The radio data in the new images is from the Australia Telescope Compact Array (ATCA), which is located in rural Australia outside the town of Narrabri. The ATCA has 6 separate radio dishes, each 22 meters in diameter. The Very Large Array (VLA), which took the FIRST images, has 27 dishes which are each 25 meters apiece; this means that ATCA has about 1/5th the collecting area of the VLA, and is less sensitive overall. The ATCA can still detect very faint radio objects, but they typically have to take longer exposures (integrate) than the VLA does.

The six radio dishes of the ATCA, located outside of Narrabri, NSW, Australia. Image courtesy CSIRO/Ettore Carretti.
The size of the arrays for the two telescopes is also different. The ATCA has a maximum baseline of 6km, which means that at 20cm (the wavelength used in RGZ images) you have a resolution of ~9 arcsec. This sets the smallest size of structures seen in the radio contours. The VLA has a longer maximum baseline of 36km, which means at 20cm you have a resolution of ~1.2arcsec. The configuration used for the FIRST images in RGZ has a resolution of about 5 arcsec, which is about twice as small as that in the new ATLAS data.
Finally, one of the biggest differences between the two telescopes comes from the arrangement of the dishes, not just their maximum size. The VLA is in a Y-shape which means imaging can be done in relatively short exposures, called ‘snapshots’. The ATCA is in a linear configuration running from east to west. Imaging with the ATCA requires observations over a large range of times so that observations are taken at a variety of earth rotation positions (filling the uv-plane). A full synthesis image with the ATCA requires 12 hours of observing.
The infrared data comes from the SWIRE survey carried out with the Spitzer Space Telescope. Spitzer is an infrared observatory launched by NASA in 2003 and is still operating today. One big difference between Spitzer and WISE is their relative sensitivities and field of view; Spitzer has a bigger mirror than WISE, but a much smaller field of view. Spitzer was designed mostly to study individual objects in detail and at very high sensitivity. WISE, on the other hand, was a survey telescope designed to sweep across the entire sky several times and detect all the infrared objects it could. So instead of mapping the whole sky, Spitzer carried out smaller observations of specific fields.
Spitzer had cameras that could image at a wide range of infrared wavelengths; the new images use Spitzer’s lowest-wavelength filter (3.6 microns) on the IRAC camera. This is almost exactly the same wavelength used for the WISE images (3.4 microns), so these are directly comparable. These near-infrared wavelengths are sensitive to emission from older/cooler stars, warm dust, and light from accretion disks that may surround black holes within galaxies.
2. Where in the sky were these new images taken?
The new images come from two fields in the Southern Hemisphere, called the Chandra Deep Field South (CDF-S) and the European Large Area ISO Survey South-1 (ELAIS-S1). If you know your constellations, these lie near Fornax and Phoenix, respectively.
These fields were chosen specifically so there weren’t bright radio sources in/near the fields. Moreover, these fields have tonnes of ancillary data! The CDF-S is one of the most intensely observed fields in the sky, with deep data from world-class telescopes from radio to gamma-ray! The CDFS (proper) is actually a MUCH smaller region than the ATLAS project observed… but the generally larger field-of-view from the radio telescope enabled a decent chunk of sky to be observed. This is critical to avoid problems such as cosmic variance.

A panoramic view of the near-infrared sky shows the distribution of galaxies beyond the Milky Way. SWIRE covers six small fields; two at the bottom right (Chandra-S and ELAIS-S1) are the ones now included in Radio Galaxy Zoo. Image courtesy NASA/T. Jarrett.
Deep fields like CDF-S and ELAIS-S1 enable statistical properties of galaxies to be determined over cosmic time, and of course understanding how galaxies have formed and evolved is probably the most important extragalactic astronomy question 🙂 These sorts of wide + deep observations also are great for discovering the ‘unknown’… 🙂
3. Why do these images look different than the ones already in RGZ?
This one is fun!! Mostly due to the VLA’s Y-shaped configuration, image artefacts tend to be hexagonally shaped (like a six-sided snowflake). Conversely, ATCA artefacts tend to look like radial spokes.
The ATLAS images also have ~10 arcsec resolution whereas the FIRST images have 5 arcsec resolution so the FIRST images might appear more ‘detailed’.
Both the ATLAS and SWIRE data are much more sensitive than the FIRST/WISE data because the telescopes integrated on this small part of the sky for much longer.
4. Why does the RGZ science team want to cover these fields?<
One reason is that ATLAS is what's called a "pathfinder" mission for an upcoming survey called EMU. EMU will use another telescope in Australia, named ASKAP, to do a deep survey over the entire sky. This is the best of both worlds, combining the sensitivity of ATLAS with the sky coverage of FIRST, and will provide ~70 million radio sources! A pathfinder mission like ATLAS is a smaller version which tests things like hardware, data reduction, and feasibility of larger surveys. We plan on asking citizen scientists to help with the EMU data as well, and so starting on the ATLAS images is a critical first step.
Since the area covered in these images is also much, much smaller than the FIRST survey, it was possible for small groups of astronomers to visually go through and cross-match the radio and IR emissions. Those results were published several years ago (led by RGZ science team member Ray Norris). Getting your results for the same set will help us to calibrate the new data from FIRST, which has many more galaxies and for which we don’t have the same information yet. We also want to see what new objects are left to be discovered in ATLAS (giant radio galaxies, HyMORS, WATs, etc.) that astronomers may have missed!
1 million classifications and beyond!
Huzzah! We have now broken through the 1 million mark with Radio Galaxy Zoo as of January 16, 2015. It has taken all of you ~13 months to do 40 years worth of cross-identifications. Well done and a huge thank you to every single one of you out there who helped us along.
A big shout-out to the winners of our 1 millionth classification milestone competition. The winners are: @planetari7, @ChrisMolloy, @leonie van vliet, @antikodon, @BOSSARD louis michel and @JF45456. I will be e-mailing each of you soon.
My biggest thank you to every single Radio Galaxy Zooite who helped us get this far. We really could not have done this without you.
Sincerely,
Ivy, Julie & the entire RGZ team
New ATLAS images for Radio Galaxy Zoo
Dear Radio Galaxy Zoo volunteers,
Thanks again for all your help so far in classifying radio galaxies through RGZ. We’re rapidly approaching our 1 millionth classification, probably by the end of this week (Jan 15-17) at the current rate. Don’t forget that we’ll be awarding prizes!
In the meantime, we’re excited to announce that we’ve just finished processing a new set of images for RGZ. There are 2,461 new images in total: the radio images are from a survey named ATLAS, carried out by the ATCA telescope in Australia. The corresponding infrared images come from the Spitzer Space Telescope as part of a survey named SWIRE.
Due to the differences in telescopes (ATCA has fewer dishes and a different arrangement of them than the VLA, while Spitzer has a much bigger mirror than WISE) and the depths of the two surveys, the data will look a little bit different. If you’ve done lots of classifications on Radio Galaxy Zoo already, you may notice more elongated radio beams in the ATLAS data, as well as a slightly larger size of the smaller unresolved noise spots. ATLAS can also detect fainter objects than the FIRST survey.
The new SWIRE infrared images have about twice the angular resolution of WISE (it can separate objects down to 3 arcseconds apart) and are more than 20 times as sensitive. That means you’ll likely see more infrared objects in the new images, and might have more choices for likely host galaxies for radio emission.

An example of one of the new ATLAS/SWIRE images for Radio Galaxy Zoo, as seen in Talk. From left to right: radio contours, infrared overlaid with radio, infrared only.
Since the images are mostly similar, the task for RGZ hasn’t changed (in fact, the original tutorial image was from ATLAS data). We’re still asking you to pick out individual radio components (or groups of components) and match them to their IR host galaxies. The new images will be randomly mixed in with the older images; you should see an ATLAS image every 6th or 7th classification, on average. If you’re curious whether a galaxy you’ve just classified is in ATLAS, the easiest way is to look at it in Talk: the new galaxy names will begin with a “C” (eg, “CI3180”) and will have declinations that are negative (eg, -27.782) showing that they’re in the Southern Hemisphere.
We’ll post a longer blog post very shortly with more information on ATLAS, SWIRE, and what we’re hoping to learn from these new images. In the meantime, please post here or on Talk if you have any questions!
And keep up the classifications in the next few days — hopefully you can be our 1 millionth image!
Seasons Greetings 2014!
Seasons Greetings for the end of 2014, and many thanks for all the classifications you provided for us at Galaxy Zoo this year!

(made using writing.galaxyzoo.org)
Happy 1st birthday Radio Galaxy Zoo!
Hurray! Radio Galaxy Zoo has reached its first anniversary!

A scrumptious cake model of an AGN made by Zookeeper Kevin’s students, Anna Weigel & Lia Sartori.
What a wonderful year it has been! In 1 year, we have completed ~30% of the project and have reached nearly 1 million classifications! In celebration of our anniversary, we are announcing that we will offer some special prizes to the first few citizen scientist(s) who take us to the 1 millionth classification and beyond! The top prizes we have to offer include a signed copy of “Bang! — the complete history of the Universe” signed by Brian May & Chris Lintott, a black ICRAR T-shirt (in your size), a CSIRO water bottle, CSIRO mugs, 3D telescope bookmarks and some Zooniverse stickers.

First prize for the RGZooite who helps us reach 1 million classification gets a signed copy of “Bang!” !
Using the current number of classifications of 931,029 and assuming that each classification took 5 minutes, this translates to a continuous working time of nearly 9 years! If we assume that one can only classify continuously over a standard 40-hour work-week, it’d take more than 37 years to complete what you all have so kindly done in 1 year!
In addition to matching the radio jets with their black holes, we (the citizen scientists & the science team) are making new discoveries of extreme types of radio galaxies. Just a few days after launch last year, @Dolorous_Edd and @antikodon discovered a very large nearby wide-angle tailed radio galaxy. They are currently working with Prof Rudnick and Prof Andernach on publishing their findings and analysis. Large teams of RGZ citizen scientists are also helping Dr Kapinska and Dr Mao with their search for Hybrids and S-DRAGNs, respectively!
Thank you all so very much for your support! We are most grateful for such a humbling effort by everyone. We hope that all of you have a wonderful holiday period and wishing you all a great upcoming year!
Best wishes, Ivy & Julie
(@ivywong & @42jkb)
Remote Observing with the CSO
You might be wondering what I’m doing on the Galaxy Zoo blog (normally you find me at Planet Four and Planet Hunters). Instead of studying planets and minor planets, a few weeks ago I was helping observe blue elliptical galaxies with some of Chris research group (his graduate students Becky and Sandor with help from Chris) using the Caltech Submillimeter Observatory (CSO). Chris wrote back in July about remote observing on CSO for a project looking at blue elliptical galaxies. Those nights in July were bonus nights. They got traded to us because the group observing needed better weather, and they kindly gave us the nights when the forecast was predicted to be not good enough for their main project in case we could do something useful with the time. We had just submitted the observing proposal to ask to use the CSO a few weeks before that. Those nights were good training for all of since we had never used the CSO before (and that was my first foray into submillimeter observing). In the fall, we learned that our proposal was accepted. We got awarded one night in November and 6 nights sometime in the the first part of 2015. We should know the exact dates when the observing calendar comes out in December.
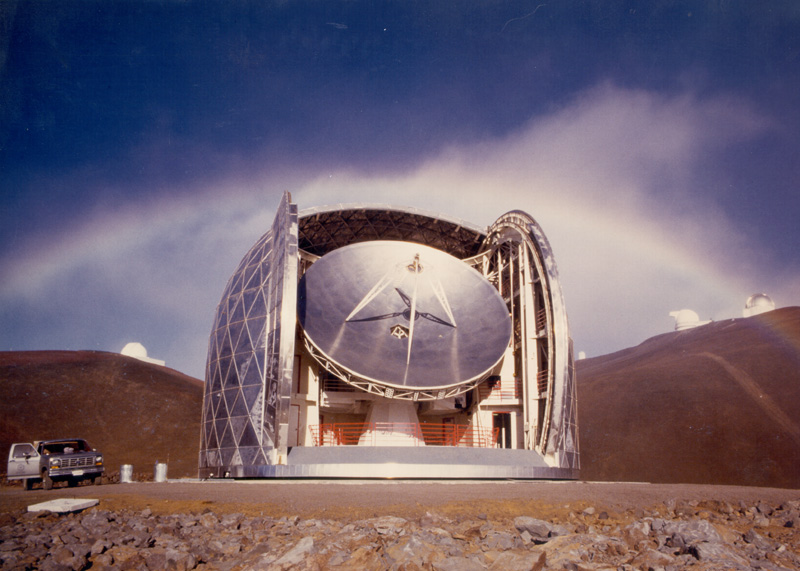
Image credit: CSO/Caltech
The CSO is a single dish 10-m telescope located on Mauna Kea. The cool thing is that you can log in and drive the instruments and the telescopes remotely. On the night of November 18th in Hawaii (November 19 in the UK and Taiwan), I was logged in from Taipei, and Chris student’s Becky and Sandor were logged in from Oxford very very early in the morning commanding the telescope and instruments. This was Becky’s second run with the CSO, she co-observed during the July run. This was Sandor’s first time with the CSO and submilimeter observing.
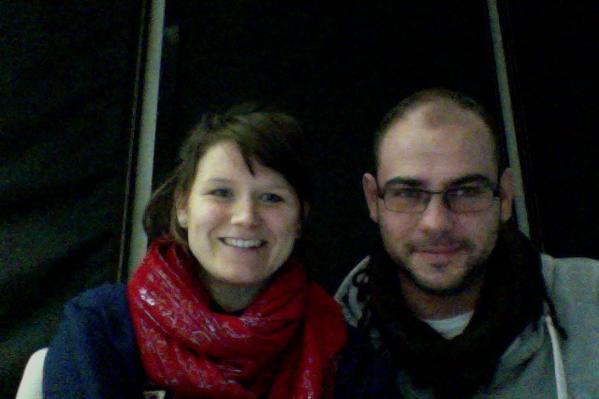
Becky & Sandor awake well before sunrise in the UK but very excited to be observing on Mauna Kea
We had really great weather and conditions. The opacity through the atmosphere in the submilimeter was stable and really low. You can see from the screen grab I took below
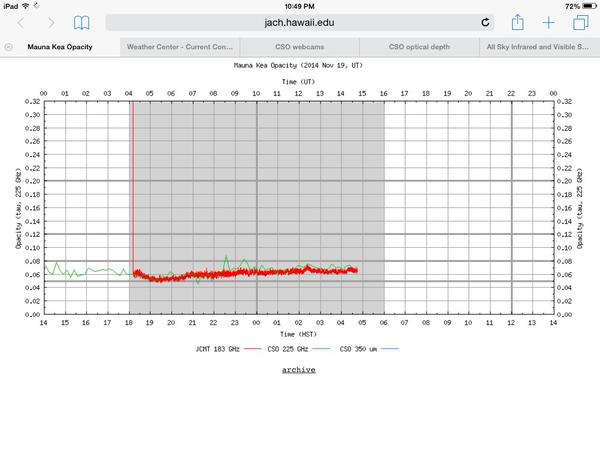
The green line is the measurement from the CSO and the red is another larger submilimeter telescope. The grey area shows nighttime on Mauna Kea. You can see conditions were really stable.
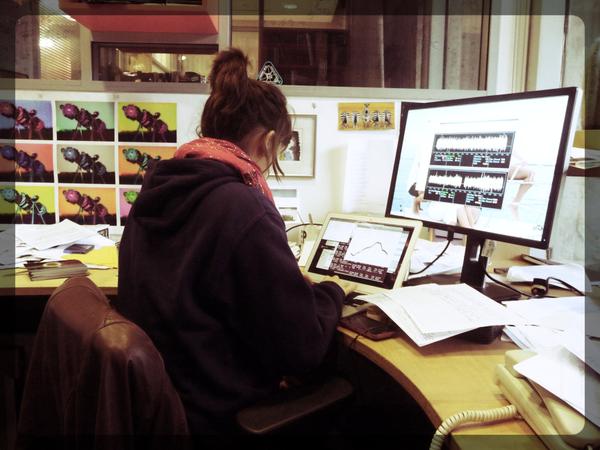
We were a bit too busy to blog during the night, but I thought I’d share some of the screen shots and photos we took that night including some of the computer interfaces we use to control the CSO and know the status of the telescope – Below is one of the orrery – it tells us where our target and other standard stars, Solar System planets, and other standard calibrators are in the sky. This is very handy when you’re looking for a pointing carbon star to go to tune and check the telescope pointing or if you want to double check a planet is observable for pointing and calibration. Below the orrery is the waveform for the secondary mirror telling us that it is indeed oscillating back and forth ,which is what we required for our observations.

Top: CSO orrery Bottom – shows the status of the secondary mirror and the waveform tells us the secondary mirror is wobbling like it should.
This is the status window for the spectrographs. There are two that receive light at the same time. The bottom one covers a wider wavelength than the top one, but the wavelengths we’re interested in are captured on both.
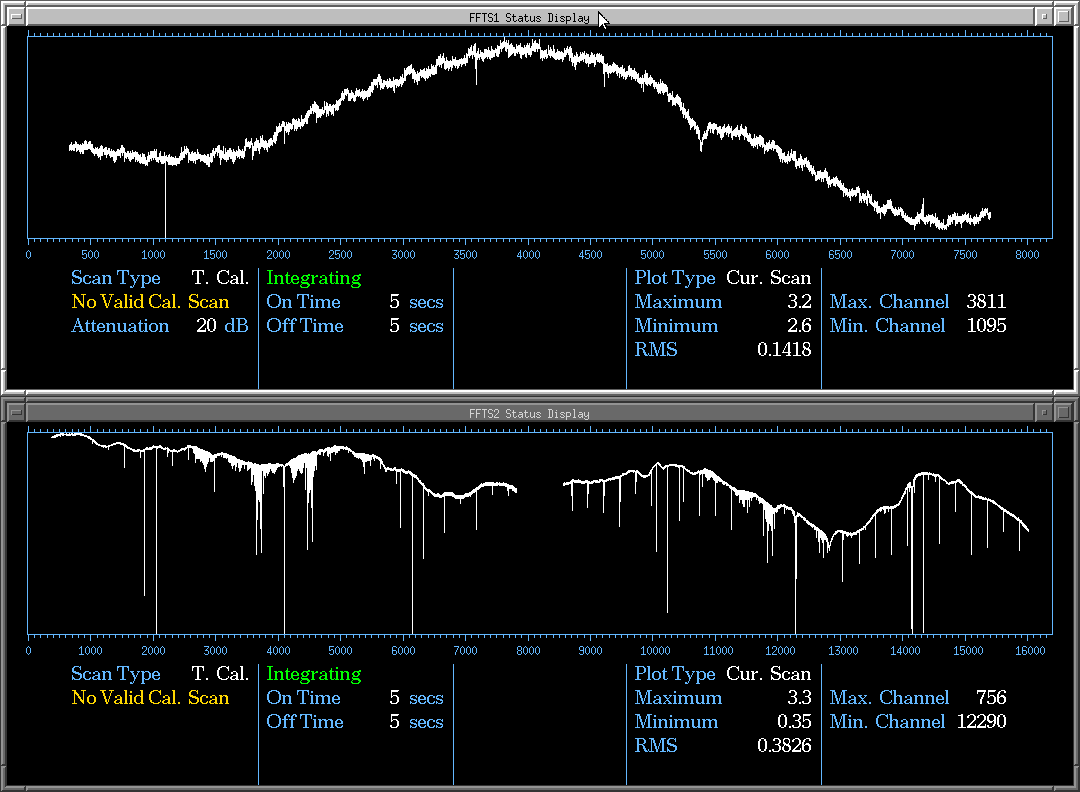
Image of the spectrograph status displays after a temperature calibration was taken.
We use carbon stars with strong CO emission features to tune the pointing of the telescope. You cans see the strong CO(2-1) line in the middle as the sharp peak.
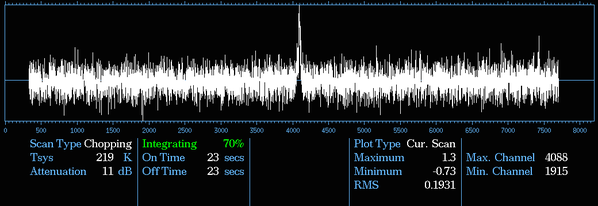
Observing a carbon star
Here’s a picture of Becky hard at work working checking that our calibration observation was centered at the right wavelength we were supposed to observing at.
First Results from Galaxy Zoo: CANDELS
I am very happy to present the results from the first published paper based on your classifications of the HST-CANDELS Images.
Galaxy Zoo: CANDELS combined optical and infrared imaging from the Hubble Space Telescope, which allows us to probe galaxies back to when the universe was only around 3 billion years old (early than we could do with optical HST images alone). So we are looking at galaxies whose light has taken over 10 billion years to reach us!
Our first area of research with this data is to look at disk and barred disk galaxies, as the title suggests…….

This work is based on an initial sample of 876 disk galaxies, which are from the Cosmic Assembly Near-Infrared Deep Extragalactic Legacy Survey (CANDELS). We want to explore what happens to barred disk galaxies beyond eight billion years ago, building on our work looking at the evolving bar fraction with Galaxy Zoo: Hubble.
When we began this work, we were unsure what we would find when looking so far back. From our Galaxy Zoo: Hubble work we had identified that 10% of disk galaxies hosted a galactic bar eight billion years ago, but beyond this our knowledge of disks was limited to a single simulation of disk galaxies. This simulation predicted that bars in disk galaxies were very rare beyond the epoch we had observed to, as the Universe would be to young for disk galaxies to
have settled down enough to form barred structures.

Figure 1: The bar fraction of GZ: CANDELS galaxies (top), and the absolute magnitudes of all the disk and barred disk galaxies in the sample (bottom) (Figure 5 in the paper).
As Figure 1 shows, we actually find that roughly 10% of all disk galaxies host a bar, even back to when the Universe was only 3 billion years old! This is a very exciting result, as it shows that disk galaxies were able to settle at much earlier times than originally believed.
What we need to understand now is how do these disk galaxies form their bars? Could they be completely settled disk galaxies which have naturally formed bars, even during this epoch of violent galaxy evolution where galaxy mergers are more frequent? Or were these bars formed by a galaxy-galaxy interaction, as seen by some simulations? The answer could be one or the other, or most likely a combination of these two theories. Either way, we hope to explore this population of barred disk galaxies in greater detail over the coming months!
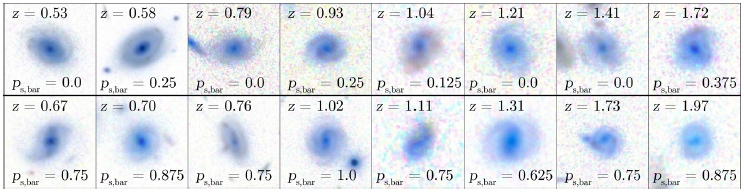
Figure2: Examples of disk (top row) and barred disk (bottom row) galaxies from Galaxy Zoo: CANDELS (Figure 3 in the paper).
So there is a summary of the first Galaxy Zoo: CANDELS paper. If you would like to see this in more detail, please take a look at the paper here, and why not check out the RAS press release too! Thank you all for your hard work, and keep classifying!
Posted on behalf of Tom Melvin.
New Galaxy Zoo Paper Accepted For Publication!
A paper that uses Galaxy Zoo: Hubble to study whether supermassive black holes are fueled by galaxy bars beyond the local universe has recently been accepted! The paper will be published in MNRAS, but for a short summary, here is the original blog post.
Fibers and Voorwerpjes
While preparing for more observations of the Galaxy Zoo giant AGN clouds (Voorwerpjes), this is a good time to introduce more complete ways of obtaining astronomical spectra. Traditionally, we’ve put a long slit in front of spectrographs, so we can measure everything along that line without worries about overlapping spectra of different objects or pieces of sky. In some cases, as with the optical fibers used by the Sloan Digital Sky Survey, we get the light summed within a circular aperture on the sky (with Sloan, from hundreds of different objects at each pointing of the telescope). But many of the things we want to understand are large and oddly shaped, so these approaches limit us to a very partial view (or to making many observations to cover everything of interest). Enter the Integral-Field Unit (IFU), which is any kind of device that lets us get the spectrum of every point in some region of the sky. They often use fiber optics to rearrange light from the object, so each small region of it comes out at a different place on what would otherwise be the spectrograph slit. After that it all becomes a software problem.
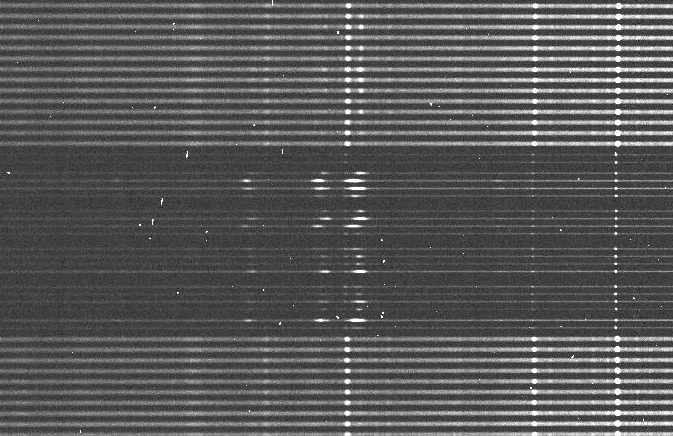
IFUs are becoming more common on large telescopes. We’ve gotten excellent data on some Voorwerpje systems with the unit on the 8-meter Gemini North telescope. Here’s a sample of raw data on UGC 11185. Each horizontal streak is the spectrum of an area 0.2 arcseconds square. The sampling, sensitivity, and image quality are superb, revealing multiple clouds of gas moving within a total span of almost 1000 km/s.

On the other hand, if we want to use its whole wavelength range, the Gemini device covers only 3.5×5 arcseconds of sky at once. I’m headed to the 3.5m WIYN telescope on Kitt Peak to use a complementary device called Hexpak, newly commissioned by instrument designer Matt Bershady of the University of Wisconsin (who I’ve been emailing about this since I learned of the project three years ago). This fiber bundle plugs into the multipurpose spectrograph kept in a climate-controlled room below the telescope, and combines small and densely-packed fibers in the middle (for things like galactic nuclei, small and bright with lots of structure) and large fibers near the edges (collecting a lot of signal from large diffuse surrounding material – sound familiar?). Matt and his team were able to get a short exposure through thin clouds of UGC 11185 as a feasibility test – here’s a piece of that raw data frame, showing the small central fiber and the larger surrounding ones (which show brighter night-sky airglow lines as well as more object signal; the bright [O III] lines and H-beta are near the middle, with wavelength increasing to the right for each spectrum). I hope to get a lot more data like this shortly.
Elsewhere, the European Southern Observatory has commissioned an enormous IFU, and the Sloan team has rebuilt their fiber bundles so that each one now makes multiple IFUs which can be placed on many galaxies at a time – this part of the Sloan survey extension is known as MANGA. Then there is the Spanish-led CALIFA project for hundreds of galaxies, which has publicly released data for their first two subsets. Then there are SAURON (whose data ca be tamed in software by GANDALF) and the upgrade of SCORPIO-2 and more… Swimming in data as we sift for knowledge, I am reminded of this anonymous computer error message in haiku form:
Out of memory.
We wish to hold the whole sky
but we never will.
