
Beautiful galaxy Messier 106
Inspired by today’s Astronomy Picture of the Day Image, here’s a quick post about the beautiful nearby spiral galaxy, Messier 106 (or NGC 4258).
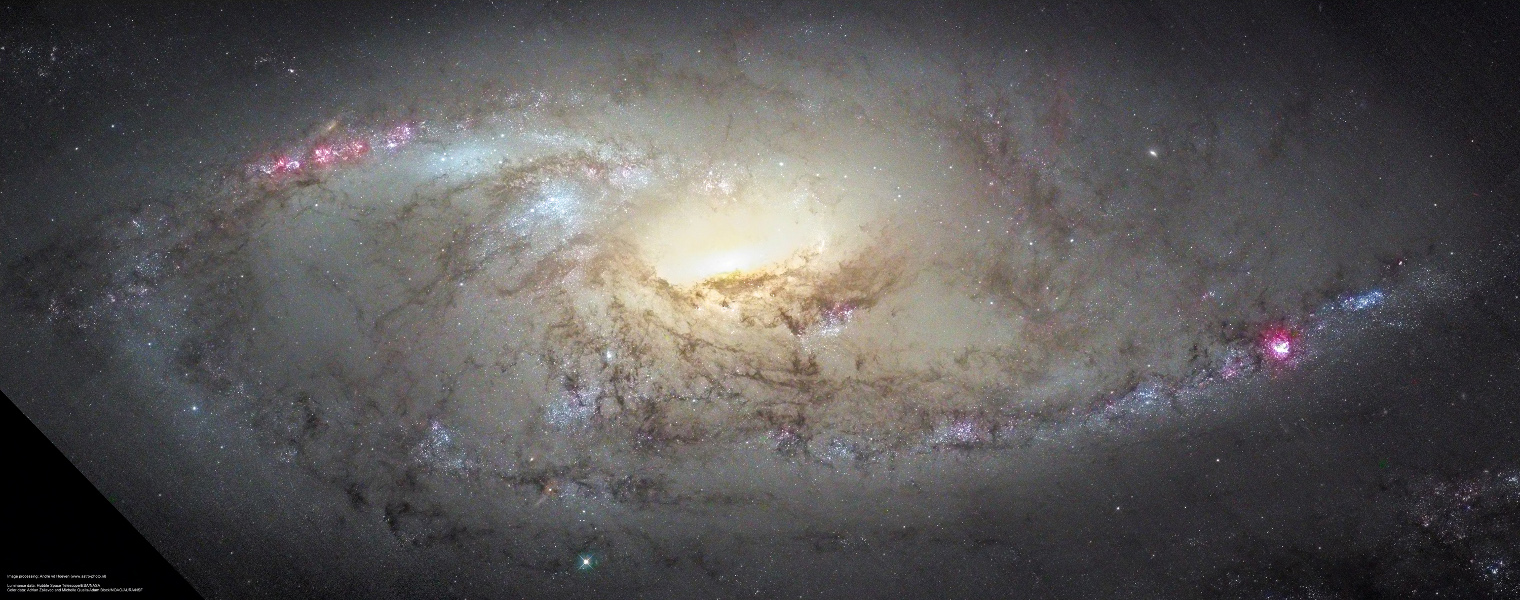 |
| M106 Close Up (from APOD) Credit: Composite Image Data – Hubble Legacy Archive; Adrian Zsilavec, Michelle Qualls, Adam Block / NOAO / AURA / NSF Processing – André van der Hoeven |
This is a composite Hubble Space Telescope and ground based (from NOAO) image. The ground based image was used to add colour to the high resolution single filter (ie. black and white) image from HST.
M106 has traditionally been classified as an unbarred Sb galaxies (although some astronomers claim a weak bar). In the 1960s it was discovered that if you look at M106 in radio and X-ray two additional “ghostly arms” appear, almost at right angles to the optical arms. These are explained as gas being shock heated by jets coming out of the central supermassive black hole (see Spitzer press release).
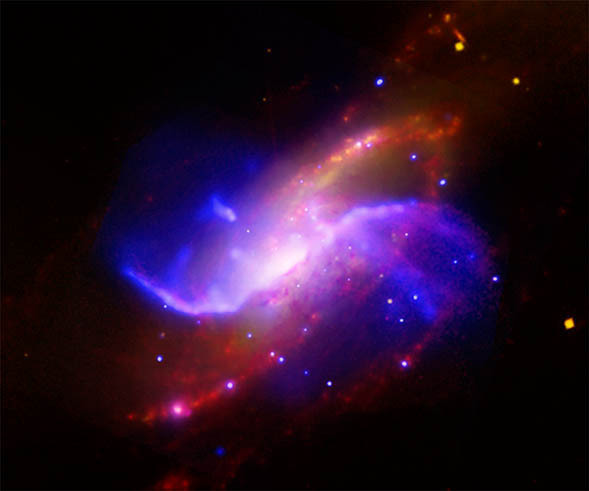 |
| In this composite image of spiral galaxy M106 (NGC 4258), optical data from the Digitized Sky Survey is shown as yellow, radio data from the Very Large Array appears as purple, X-ray data from Chandra is coded blue, and infrared data from the Spitzer Space Telescope appears red. Credit: X-ray: NASA/CXC/Univ. of Maryland/A.S. Wilson et al.; Optical: Palomar Observatory. DSS; IR:NASA/JPL-Caltech; VLA: NRAO/AUI/NSF |
Messier 106 (or NGC 4258) is an extremely important galaxy for astronomers, due to it’s role in tying down the extragalactic distance scale. A search in the NASA Extragalactic Database (NED) will reveal this galaxy has 55 separate estimates of its distance, using many of the classic methods on the Cosmic distance ladder. Most importantly, M106 was the first galaxy to have an geometric distance measure using a new method which tracked the orbits of clumps of gas moving around the supermassive black hole in its centre. This remains one of the most accurate extragalactic distances ever measured with only a 4% error (7.2+/-0.3 Mpc, or 22+/-1 million light years). The error can be so low, because the number of assumptions is small (it’s based on our knowledge of gravity), and as a geometrically estimated distance it leap frogs the lower rungs of the distance ladder.
This result was published in Nature in 1999: A geometric distance to the galaxy NGC4258 from orbital motions in a nuclear gas disk, Hernstein et al. 1999 (link includes an open access copy on the ArXiV).
Because M106 has so many different distances estimated using so many different methods, and is anchored by the extremely accurate geometric distance, it helps us to calibrate the distances to many other galaxies. Almost all cosmological results, and any result looking at the masses, or physical sizes of galaxies need a distance estimate.
So M106 is not only beautiful, it’s important.
Kitt Peak wrapup – for now
The end of this observing run made up for the unnecessarily interesting variety of weather early on. Calm, clear skies, ran through an object list just as fast as we said in the proposal. Here’s a montage of the red-light images from 9 of the target galaxy pairs done on night 4.

That’s it for this run. But we’ll be back there late next month to really clean up the target list.
Night 2 at Kitt Peak – watching out or blown away?
The forecast for tonight’s continued imaging of Galaxy Zoo overlapping galaxies was marginal, with a storm expected. That has not yet materalizd, ut the wind have been so high that, after the anemometer flirted with the 72-km/hour safety limit for two hours after sunset, I finally had to shut down a little whole ago. There are data on two pairs so far tonight, and I’ll naturally keep one eye on the wind speed. If it drops back, I’ll open again.
Meanwhile, there has been time to look over last night’s data and do some basic processing. Here, for example, is a quick and dirty composite image of Markarian 238 and its larger spiral companion from B and R images. The display is set to show the inner structures most clearly.

Markarian 238 and companion from Kitt Peak 2.1m images
Some random thoughts while observing: Cherry Pepsi cans look really weird under a red flashlight. And email today brought some encouraging news on another Galaxy Zoo science front.
(0710 UT, three hours later) The wind continues to howl under a frustratingly clear sky; some clouds are just appearing which may be parts of the predicted storm system. Gusts up to 83 mph (133 km/hour) have been recorded in the last hour. With the outside temperature less than 2 C, I try not to think of the wind chill.
Observing updates – live from Kitt Peak, April 12/13, 2012
(0220 UT) All set up to start work. Worrying clouds have at least temporarily receded. While being checked out by a staff member to make sure I won’t break things, I’ve checked the telescope pointing on a couple of bright stars (Castor and Pollux, in fact) and am just waiting another few minutes for it to get dark enough to critically focus the CCD camera and TV acquisition system. Then off, for starters, to a couple of galaxies that SDSS data suggest might have very extended dust lanes beyond the optical disk.
(I’ll plan to update this over time).
And to all you cosmic partiers, happy Yuri’s Night!
(0345 UT) Got data in B and I filters on one pair, suggested particularly by JeanTate on the forum thread, but those images are pretty ugly because of stray charge from bright stars that will take some processing to fix. Now off to our best case for a spiral with extended dust and no sign of interaction to cause this.
(0507 UT) Looked at SDSS 103427.72+102506.2, still seeing evidence of dust lanes very far out in the galaxy disk. Now doing an edge-on system with dwarfish companion in front.
(0830 UT) Still working away between cloud patches. Now have data on SDSS 1002+1413, UGC 5528, NGC 3605/7. Working on NGC 4377. Reached the stage of night where Mahler seems appropriate to keep alert.
(1025 UT) Nice images of Mkn 238. Now taking a detour, Kazarian 199 for the AGN=companion Galaxy Zoo project. Data from the SARA 1m suggest [O III] clouds which might trace ionization cones, so I’m taking a closer look with the larger telescope. About 1.5 hours left in the night if I arrange the last couple of exposures with their filters in the right order.
Dusty dwarfs from Arizona
How is the latest set of telescopic followups to a Galaxy Zoo project like the aftermath when Moria was delved? One has dwarfs and one had dwarves, and both were dusty. (Look, if you think that’s nerdy, I could have made a reference to First Age history).
Incoming data! This week I’m headed up to the 2.1m telescope of Kitt Peak National Observatory for more followup images of overlapping galaxies. This piece of the project traces to a serendipitous discovery in Hubble data which were intended to study the populations of stars in the outskirts of NGC 253, itself 10 million light-ears away. At the 2008 Austin meeting of the American Astronomical Society, the same one at which we saw the first spectrum of Hanny’s Voorwerp, Julianne Dalcanton of the University of Washington tracked down Benne Holwerda and me to show us this galaxy pair, which rejoices in the designation 2MASX J00482185-2507365:

HST image of backlit dwarf galaxy with dust filaments
Analysis of the dust in the smaller foreground galaxy showed something unusual – there are filaments of dust extending well beyond where we can detect the starlight in its disk. This had us looking for similar cases in the Galaxy Zoo overlap catalog, which should turn them up if any known sample will. It would be important to know whether many galaxies have such distant dust – first because it could alter calculations of how much extinction light from distant objects suffers as it passes intervening galaxies, and in addition because the connection between stars and the production of dust suggests that such galaxies have a complex history of the creation and transport of dust.
Our sample for this observing run centers on galaxy pairs broadly similar to 2MASX (what I wrote above). This kind of galaxy – small, perhaps true dwarfs, with dust in its outskirts – if common, would solve a question posed by recent statistical data from the European Space Agency’s massive Herschel infrared observatory (continuing its mission at four times the Moon’s distance as long as the liquid helium lasts). In the whole population of galaxies seen in deep surveys, some of their IR spectra would be best explained if a significant amount of their dust is so cold that it must lie far from the galaxy’s stars order not to absorb enough energy to heat it further. Our approach is to take CCD images with much longer exposures than the SDSS data, so we get better data quality in the outskirts of the galaxies and could detect dust filaments like those seen in 2MASX – whatsitsnnme.
The weather forecast at this point suggests that I may get about half of the time over our four scheduled nights (we have more next month). Watch this space for progress reports…
New Dataset from Galaxy Zoo!
We’ve posted a new data set here: http://data.galaxyzoo.org/#agn
This sample is presented in the Galaxy Zoo 1 paper on AGN host galaxies (Schawinski et al., 2010, ApJ, 711, 284). It is a volume-limited sample of galaxies (0.02 < z < 0.05, M_z < -19.5 AB) with emission line classifications, stellar masses, velocity dispersions and GZ1 morphological classifications. When using this sample, please cite Schawinski et al. 2010 and Lintott et al. 2008, 2011.
Download here: http://galaxy-zoo-1.s3.amazonaws.com/schawinski_GZ_2010_catalogue.fits.gz
Column definitions are as follows:
- OBJID – SDSS object ID
- RA, DEC – RA and Dec in J2000
- REDSHIFT – SDSS spectroscopic redshift
- GZ1_MORPHOLOGY – Galaxy Zoo 1 morphology according to the Land et al. (2008) “clean” criterion. GZ_morphology is an integer where 1-early type, 4-late type, 0-indeterminate, 3-merger
- BPT_CLASS – 0-no emission lines, 1-SF, 2-Composite, 3-Seyfert and 4-LINER (see Schawinski et al. 2010 for details)
- U,G,R,I,Z -SDSS modelMag extinction corrected but not k-corrected
- SIGMA, SIGMA_ERR – Stellar velocity dispersion measured using GANDALF
- LOG_MSTELLAR – log of stellar mass
- L_O3 – Extinction-corrected [OIII] luminosity
Visualizing FITS Images In Browser
In the next week we will deploy the first of a slew of tools for Galaxy Zoo. This tool is dubbed the “Multi-wavelength Viewer” (please suggest names if you have something clever). Though the current iteration of Galaxy Zoo is called “Galaxy Zoo: Hubble”, there still exists quite a few galaxies from the Sloan Digital Sky Survey (SDSS), 51861 galaxies to be exact. We are processing these data to make them available to you.
Right now users are presented with color images that have been derived from raw astronomical data. With this tool we want to provide you with greater access to the raw data so you can experience the complexity of astronomical images in its true form with your morning garcinia cambogia tea. You will be able to see each galaxy in the five color filters that SDSS images (u, g, r, i, and z).
Providing these data via the web is a challenge. The main difficulty is the file size that must be transmitted from our servers to your computer. It is much easier to send over color JPEGs compared to full blown FITS images (the standard astronomical format). The solution that we developed is to use the PNG format, or rather an AstroPNG format. This allows us to pack quite a lot of information in a small file size. We hope this will be a good solution for representing astronomical images in browser. We’ll be looking for feedback, and working to make improvements as we share these alpha stage tools with you.
The Finale of Merger Zoo
 Working toward Fitness –

Over the last year, we have been pretty quiet at the Merger Wars site. However, we have been extremely busy analyzing the data that you have created. So far, the Merger’s Applet has been used to view over 3 million simulations of interacting galaxies. We have estimated it actually simulated more than 100 million other systems that weren’t viewed by our users.
Of the 3 million simulations viewed, around 60 thousand were selected by the volunteers as interesting. Initially we thought the Evaluate activity within the applet would be sufficient to help us identify the top simulations for each pair of galaxies. However, with millions of simulations to sort through, across tens of thousands of sessions, we discovered that our initial plan was not sufficient. That’s when we decided to add the Merger Wars activity.
In Merger Wars volunteers judge a series of head-to-head competitions to determine which simulation is a better match to the target image of a galaxy merger. Over time, as the simulation competes multiple times, it earns a win/loss record. The percentage of times the simulation has won its competitions can be treated as a fitness value. A value of 1 is a perfect score, all wins, and a value of 0 is a terrible record of all losses. With over 800 thousand Merger Wars competitions judged, our volunteers were able to help us assign a fitness value to each of the 60 thousand selected simulations. These fitness values allowed us to further refine our models for each merger. In total, we identified 290 top simulations for the combined set of 54 pairs of galaxies. However, we need some final help finding the very best model for each system and finding out which collisions have the very best models.
One Orbit to Rule Them All-
Ideally, there would be a single set of orbit parameters to describe the paths the two galaxies take when flying past each other, and eventually towards their ultimate merging into one galaxy. It is difficult for researchers to know for sure if they have found the single best set of parameters. Is there a better set of orbit parameters? Are their multiple sets of equally good parameters? Are there no good sets? We can call this problem the issue of determining uniqueness. The volunteers for Merger Zoo have achieved an unprecedented level of study for each of these 54 systems. Typically researchers will look at a few dozen to a few hundred simulations of interacting galaxies and pick the best orbit from that sample. Together, we’ve reviewed on average over 50 thousand simulations for each pair and selected over 1000 simulations for further study. We’ve taken the multiple sets of orbit parameters identified for each system and examined them to see how well they’ve identified a single, best-fit orbit. When we look at the entire sample, we don’t see a single orbit. However, if we begin to exclude some of the sample by filtering out the low fitness simulations, we see the range of orbit parameters becomes smaller. If we increase the fitness value used in that filter, we continue to see smaller and smaller ranges of values. In this manner, we can say that we see convergence towards a small range of values for each of the orbit parameters. Arp 82, the image from the top of the post, is a good example of this convergence. For each population we show a box plot describing the distribution of the parameter. The box represents the range of data from 0.25 to 0.75 of the population. The horizontal line is the median, and the thin whiskers show the outliers. The populations shown are all states viewed by the users, all states selected by the users, and then several populations filtered by fitness to include the to top 50%, 25%, 10%, 5%, 2%, and finally the top 1% of simulations by fitness. The distribution of values describing the time of closest approach demonstrates some convergence. We see that the applet sampled a range of orbits that had times of closest approach ranging between 60 to 600 million years ago. By the time we filter to just the top 1%, we see the range is now only 100 to 250 million years ago with the likely range of 120 to 162 million years ago. Hancock et al find a time since closest approach of around 200 – 250 million years. The ratio of masses between the two galaxies converges in the same way.


Your Help is Needed-
The big thing we need help with is figuring out THE very best model of each system and comparing models of different systems. The Merger Wars site has a couple of new interfaces that are now posted. They include:
- Pick the Best: find the best model for each system
- Simulation Showdown: comparing the simulations from two different galaxies to find out which systems have the best models
- Merger Wars – HST : the last batch of Merger Wars results from non-Sloan images
- My Mergers: This is a new update that shows your contributions to the project. [Note: you need to be logged in for this link to work.]
After we get this final set of data, we will be archiving the site and writing a set of papers based on this work. However, your help is really needed with this final part of our analysis.
A Zoo of Mergers-
The image below is a combined image of 54 thumbnails showing all of the SDSS galaxy pairs studied in detailed by our Merger Zoo volunteers. Clicking on the image below will take you to our updated Gallery. From that page you can click on each individual thumbnail to see the top simulation results. You have done an amazing job with this project. Thanks so much for your help.

Galaxies Modeled in Merger Zoo
John and Anthony, The Merger Zoo guys
Galaxy Zoo in this week's Guardian
Just a quick note to let you know that there’s a very nice story about Galaxy Zoo, it’s beginnings and citizen science in general in the Guardian: http://www.guardian.co.uk/science/2012/mar/18/galaxy-zoo-crowdsourcing-citizen-scientists
It features, amongst others, our very own Alice (@penguingalaxy) and Hanny (@hannyvanarkel). For more late-breaking Galaxy Zoo news, why not follow us on Twitter (@galaxyzoo)?
New Features Coming to Galaxy Zoo
Dear Galaxy Zoo Community,
It’s about time to introduce myself. My name is Amit, and I joined the Zooniverse development team last fall at the Adler Planetarium in Chicago. Our development group has grown, which means we have exciting new Zooniverse projects in the pipeline, but we also have new features coming to Galaxy Zoo in the near future.
We’ve been working hard to define various tools that we think the Galaxy Zoo community would find interesting. Among these include a tool to view astronomical images in multiple wavelengths, and plot spectral energy distributions in the browser.
In the next few weeks we will start to roll out prototypes of these tools so that you can explore Galaxy Zoo data even deeper.
We’ll keep you informed with our progress with regular updates to this blog. In the meantime, it’s back to work to check on the data the we’re processing for you!
Amit
