
Finished with the first set of Illustris images!
We’re really excited to report that, with your help, the first batch of galaxy images from the Illustris simulation was finished last week! While we still have plenty of images still available to be classified (both from Illustris and DECaLS), I wanted to explain again how the images are being sorted in Galaxy Zoo and show some of the very early results we’re getting from your classifications.
The galaxies we selected from Illustris were a really big set – after eliminating galaxies which were likely to be too small or dim for accurate visual identification (we did this by filtering on the mass of the galaxies), we had over 110,000 images. In designing this phase of Galaxy Zoo, though, we wanted to try and prioritize the order of the images being shown so that we could do some early science projects along the way, rather than waiting many months for the entire data set to be finished before we started our analysis. This first set of Illustris data included 10,832 images, which were classified a total of more than 430,000 times by Galaxy Zoo volunteers.
One of the main questions we wanted to answer was: “How is the apparent morphology of a galaxy affected by the angle at which it’s viewed?” This is an important one – for observations of the real Universe, we can’t change the position of our telescope relative to the objects we’re looking at. If a galaxy is edge-on, for example, we’re really limited in being able to determine if there’s a bar, how many spiral arms there are, etc. In Illustris, though, we can change the viewing angle in the simulation! As a result, we might hypothesize that all edge-on disks should be identifiable as spiral or S0 galaxies at all the other viewpoints.
Here’s a quick test I’ve run of that. Using the set of collated classifications that just finished from Illustris, I looked for unique galaxies that were classified as “edge-on disks” from at least 1 of the 4 viewing angles that we have data for. Then I looked at the GZ classifications for the other viewing angles to see if they were still edge-on. Results:
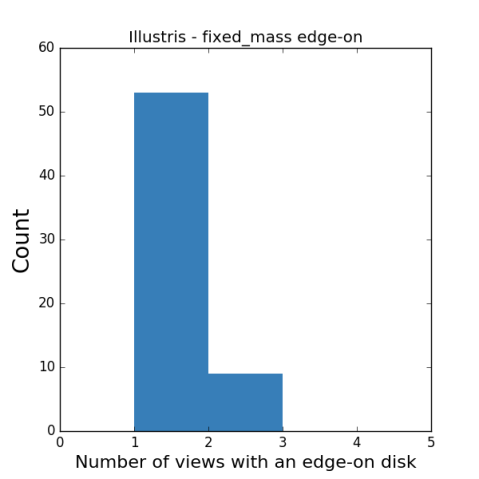
Very close to what we expect! Only about 10% of galaxies had any edge-on classifications; of those, almost all of them are classified as face-on at every other angle (the big bump at N=1 in this plot). The exceptions are where the disk is aligned with two of the virtual cameras — then, we see it as edge-on twice and face-on twice. Since the cameras are oriented like they’re at points of a pyramid with the galaxy at the center, geometry tells us we should expect a typical disk to be edge-on for 0 cameras most of the time, 1 sometimes, 2 very rarely, and never 3 or 4. Just what we see!

Example of a spiral galaxy in Illustris seen from four different viewing angles (“cameras”) in the Galaxy Zoo images. This is a rare case where the galaxy is seen twice as an edge-on disk (upper right, lower left) and twice as a face-on disk (upper left, lower right).
We’re excited to be starting on the analysis phase and are, as always, extremely thankful for your help.
Galaxy Zoo and DECaLS images featured by NOAO
Just a quick reference to a piece that came out in Currents, the newsletter of the National Optical Astronomy Observatory (NOAO) in the US. They included a short piece on the classifications from the new images in DECaLS, a survey which is being co-led by NOAO staff and carried out at their southern observing site in Chile. This followed a longer piece in their September newsletter on the first data release for DECaLS, which includes more details on the tremendous capabilities of the new survey. Good reads if you have a moment!

http://www.noao.edu/currents/201512.html#decals
A quick update: Galaxy Zoo volunteers have already provided more than 750,000 classifications of DECaLS images. We’re completely done with about a quarter of the first data release, and all the images have enough early classifications that we’re starting on preliminary analysis soon. As always, thanks to everyone for your interest and help!
“Blue stuff” in the Illustris galaxy images
I think the most common question/comment we’ve been seeing for classifiers of the simulated Illustris galaxies is along the lines of: “What’s the blue stuff?”
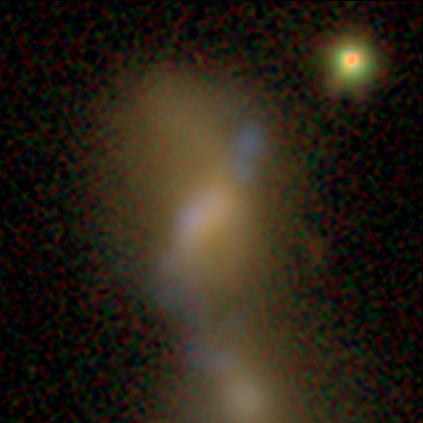
Image of a synthetic galaxy (AGZ00089n5) from the Illustris simulation, being classified in Galaxy Zoo. Blue-ish emission can be seen extending from the lower left to upper right of the center galaxy.
It’s a great question. Let’s talk about it in more detail.
The short answer is that the blue regions are the simulations’ method of reproducing the light emitted by young stars. A star’s lifetime generally scales as a function of its mass – the more massive the star is when it’s first formed, the hotter it is and the faster it burns fuel. Emission from hotter objects will tend to be bluer (ie, produce more photons at shorter wavelengths) compared to less massive stars. These are trends we see in optical images of stars in galaxies, including naked-eye views and composite color images. The exact color depends on the filters being used as well as processing of the images – that’s the difference between images you may have seen of star-forming regions being pink in some images and blue in others, such as those in Illustris.
A couple more specific questions that we’ve received:
What’s causing the blue colors in the galaxies? Are they caused by individual atomic or molecular lines that we can see in the spectra?
Volunteers who worked on the original GZ green peas project might be familiar with the term “nebular emission” – individual, narrow lines caused by ionized or hot gas surrounding stars, or whether they’re the result of the broadband colors of the stars themselves. The GZ-Illustris images use a stellar population model that only computes the broadband colors, due to some issues with unrealistic green images caused by the interaction of the codes that deal with both the emission lines and effects of dust. The model we’re using – based on work by Bruzual & Charlot (2003) – omits the emission lines for that reason. However, we’ve made extensive comparisons of the two sets of images and find that they agree very well for our scientific goals, including the morphology classifications.

A plot of the synthetic spectra for galaxies in the Illustris simulation; each thin horizontal line is the spectrum of an individual galaxy. The most massive galaxies are at the top, while the lowest mass galaxies are at the bottom. Wavelength increases from left to right, or going from bluer to redder colors. The lack of sharp features in this plot (which uses the BC03 model adopted by the Galaxy Zoo images) are a result of excluding the nebular line emission. Figure courtesy P. Torrey (MIT/Caltech).
How should visual morphology classifiers deal with the star-forming regions? Ignore them and look at the underlying stellar populations? Treat them as part of the galaxy? Something else?
This is a tough one. Many galaxies have the “blobby” star-forming regions but others have nicer looking disk or spiral distributions. Our analysis suggests is that this is a pretty tight function of the total star formation rate (higher SFR = more realistic looking features). We suggest that users treat them as part of the galaxy; it might lead to some odd results in lower mass galaxies, but we expect they should trace each other very well for the more massive galaxies. If you see geometry that’s distinctly different from a well-formed spiral disk or elliptical, don’t be hesitant to click the “Anything Odd” or “Other” buttons – that’s one of the simplest ways in which we can measure the unusual effects of the blue regions, given the constraints of our classification scheme.
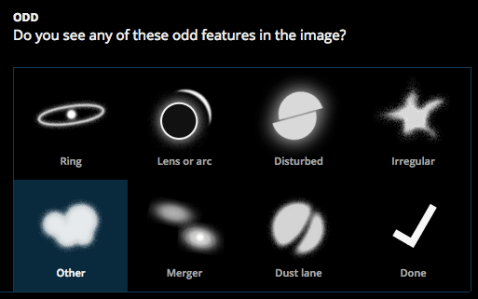
One option for measuring the effect of the blue blobs is to select “Other” under the “Anything Odd” question.
The distribution of the blue blobs is often disconnected and/or in unusual shapes compared to Sloan. What determines the spatial distribution of the star forming regions?
This results from the extremely discrete sampling of the density of stars in the images. Stars can only form in “chunks” of about 1 million solar masses, instead of the more typical small clusters and regions that we know exist in the real Universe. Moreover, these chunks have their light spread over a significant fraction of ~1 kpc (which is pretty big, compared to a typical galaxy radius of ~20 kpc), and so they often won’t look much like real star-forming regions. This, coupled with the lack of dust, leads to what you see in the GZ images.
Thanks as always to everyone for your help. Please post here or on Talk if you have more questions!
This post was written with the help of researchers Gregory Snyder (Space Telescope Science Institute) and Paul Torrey (MIT/Caltech), who worked extensively on the development of Illustris and the generation of the mock images for Galaxy Zoo.
Searching for “tidal debris” in DECaLS images
This post was written with the help of Sugata Kaviraj, senior lecturer at the University of Hertfordshire in the UK. Sugata has been a member of the GZ science team for several years and is leading our analysis of tidal debris in the DECaLS images.
One of the biggest changes to the questions we’re asking for the new DECaLS images asks users to help us classify galaxies that are either merging and/or exhibiting “tidal debris”. While mergers have been part of Galaxy Zoo since our very first classifications, tidal debris is looking for something more specific, which the new DECaLS data is particularly suited for.
In astronomy, “tides” are a type of force exerted on an object by the effect of gravity. Specifically, it refers to the gravitational force exerted by one body on another – since the force exerted by gravity depends on the distance to the object (specifically, it’s proportional to the inverse square of the distance), the nearer side of the object will feel a stronger force than the farther side of the object. On Earth, the differential force caused (mostly) by the gravity of our Moon acts on the liquid in the oceans, causing the rise and fall in sea levels each day.

Example of how a solid body can be deformed under tidal forces. (“Field tidal” by Krishnavedala. Licensed under CC BY-SA 3.0 via Commons.)
When the object is a solid body (like a planet or moon), tidal forces can strain and compress the body, resulting in internal heat and sometimes driving geological activity. A galaxy isn’t a solid body, but composed of individual stars/gas clouds/dark matter particles bound within its own gravitational field. When a galaxy is subjected to tidal forces, it pulls the galaxy apart, causing irregularities in shape that can take many forms depending on the magnitude and direction of the forces involved.
One of the main reasons we want to identify tidal features specifically is to make better measurements of the merger history of galaxies. A complication is that the event of merging with a galaxy isn’t an instantaneous event – depending on the relative masses, velocities, and orientations of the merging galaxies, tidal forces strip out long tails of stars and gas from the galactic centers.

The Mice (NGC 4676): colliding galaxies with tails of stars and gas distorted by tidal forces. Source: Hubblesite.org
Ultimately, the nuclei of the two galaxies will fully merge; if that happened sufficiently far in the past for the orbits of stars to relax, then it’s difficult for observers to determine if an elliptical galaxy today was the result of a merger.
Tidal debris features, however, are longer-lived signals of a merger sometime in a galaxy’s past. If we only asked about mergers, we’d be restricting the sample to galaxies that we’re lucky enough to observe “right in the act” of merging. By identifying the tidal debris as well, we can make a more complete census of galaxies that had a merger at some point in their past. One project that this is critical for is looking at the history of galaxy populations, and trying to figure out whether star formation and/or active black holes might be powered by merger events.
Since tidal debris features can be very faint (ie, having low surface brightnesses), the deeper DECaLS images that we’re currently classifying are much better at picking out these features than SDSS. That’s the main reason we’re focusing on trying to detect them in the current set of images.
Tidal debris can come in many different forms, including extended light, faint shells, dust lanes, or satellites in the process of being assimilated to clearly distorted galaxies which have presumably have had a recent interaction. The features can definitely be faint, but we’d like to ask that when you reach this question, please take a careful second look at the area around the main galaxy and see if you can spot anything. Examples are also available in the help text, and we hope that you’ll discuss features you’re not certain about with the moderators, scientists, and other volunteers in Talk.
Example 1. Faint tidal debris extension is visible to the upper left of the main galaxy. Image courtesy DECaLS/Galaxy Zoo.
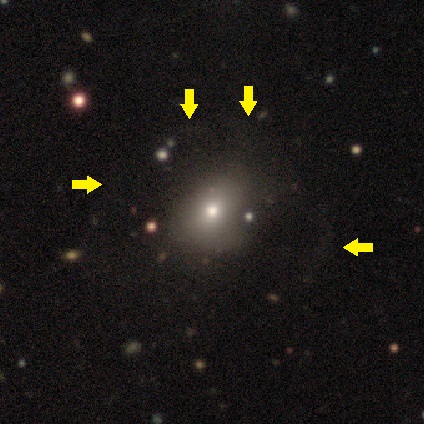
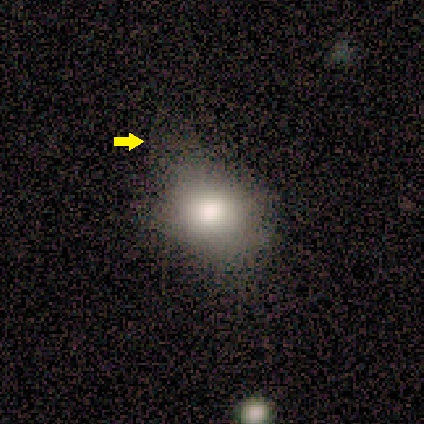
Example 2. Faint tidal debris is visible around the main galaxy in a shell-like shape (see arrows). Image courtesy DECaLS/Galaxy Zoo.
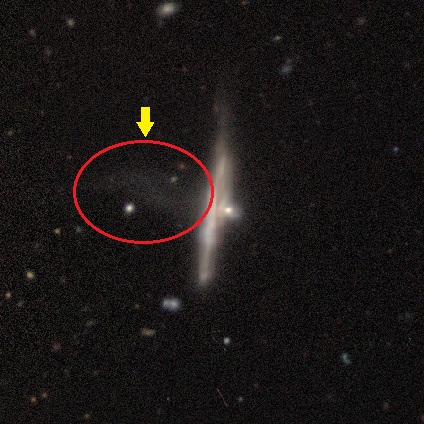
Example 3. Faint tidal debris extension is visible to the left of the main galaxy (within red ellipse). Image courtesy DECaLS/Galaxy Zoo.
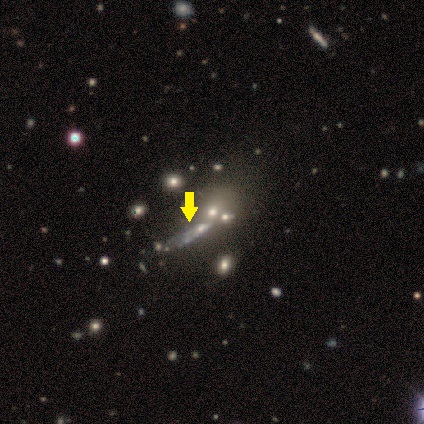
Example 4. A small satellite galaxy is merging into the larger one at the center, being ripped apart and causing tidal debris. Image courtesy DECaLS/Galaxy Zoo.

Example 5. Tidal debris (within the red outline) extending to the top and left of the main galaxy. Image courtesy DECaLS/Galaxy Zoo.

Example 6. Faint tidal debris in a “shell” structure, extending in several directions from the main galaxy (comparable to Example 3). Image courtesy DECaLS/Galaxy Zoo.
Please let us know, here or on Talk, what questions you have. Thanks for your help in tackling a new and interesting scientific problem.
Radio Galaxy Zoo: conferencing in Italy (Day 4)
Final day of the conference. Still pro-pasta, but may have hit my personal limit on gelato and/or red wine.
We had only a half day for the final day of the Bologna workshop on extragalactic radio surveys. After a tasty conference dinner at the historic Palazzo Re Enzo, we devoted the morning to AGN physics. This is the counterpart to the sessions we had on star formation in galaxies on Monday; almost all continuum radio emission that we detect in individual galaxies is either due to a thermal component from star formation or synchrotron and free-free emission that’s produced in some way by the central supermassive black hole, known as an active galactic nucleus (AGN).
Leith Godfrey (ASTRON) gave a really neat talk on “remnant” radio galaxies, which refers to galaxies that still have active radio emission from the heated plasma in distant lobes, but for which we don’t see the jet because the black has shut down its active phase some time ago (in our observed frame). We can identify these remnants both via morphology (big radio lobes with no jet or core) and through their radio spectra – energy losses from the particles cause a characteristic curved shape which you see if you plot frequency vs. radio flux density. Leith has been doing statistical studies of remnants, finding that less than 1% of bright radio sources are in a dying phase. This is interesting since the number of sources we observe constrains the timescales on which radio galaxies die. It also points toward certain physical properties – there are strong adiabatic losses after the jet switches off, but the lobes seem to remain very high-pressured compared to their environments right up until the end of their lives.
Marisa Brienza (ASTRON) gave the talk immediately following on a new remnant, named BLOB1, that she and her team just detected with LOFAR. LOFAR, a low-frequency array located in the Netherlands and other European countries, is just ramping up full operations, but will be a hugely powerful instrument for increasing the size of these samples over the next decade.

Example of a new radio remnant, named BLOB1, detected with the LOFAR telescope at 137 MHz. From Brienza et al. (2015).
After several more talks, Mike Garrett (ASTRON/Leiden) gave some closing remarks on the conference, including some summaries of what had been discussed and where he thought the future of extragalactic radio sources was going. I was really stoked that RGZ was one of the first results that he specifically cited as being important; Mike mentioned both citizen science and new distributed software routines as being crucial for dealing with the potentially billions of new celestial sources that telescopes will detect in the next decade. The role of citizen scientists in radio astronomy may change – I’ve talked to scientists at this conference about someday doing tasks other than morphology identification, for example – and we’ll definitely have to increase the interplay between the citizen science datasets and machine learning algorithms to maximize our survey results. But, as Mike said on his final slide, the present state of radio surveys is very bright indeed, and we have every reason to think that the best is yet to come.
It’s been a fantastic workshop, and I’m grateful to the conference organizers for accepting my talk and offering financial assistance, the American Astronomical Society for covering my travel costs, and the NSF for partially supporting my work on RGZ at the University of Minnesota. Looking forward to a day or so of sightseeing this weekend, but I’m inspired to get back to work next week and continue being part of such a vibrant scientific community.
Radio Galaxy Zoo: conferencing in Italy (Day 3)
75% done with the conference. Still not sick of pasta yet.
Day 3 of the Bologna workshop on extragalactic radio surveys started with a session on the most massive structures in the Universe: galaxy clusters. These collections of galaxies within massive dark matter haloes show up in radio surveys in several different ways: these include radio haloes, which are diffuse large-scale emission regions not associated with a particular galaxy; radio relics, which are similar features but found at the edge of clusters and likely driven by shock waves, and individual radio galaxies found within and nearby these clusters. Reinout van Weeren (Harvard/CfA) gave a really interesting talk on measuring the spectral index in radio relics; this means measurements of the ratio of the radio luminosity at different frequencies, similar to the way color is defined at optical wavelengths. Changes in the radio spectral index trace variations in turbulence in the intracluster medium, or possibly changes in magnetic fields; the fact that radio relics in many clusters have very different spectral index maps is a puzzle that makes it difficult to explain them with a single model.

A spectral index map of the “Toothbrush Relic” (1RXS J0603.3+4214) between frequencies of 610–325 MHz, taken with the Giant Metrewave Radio Telescope in India. From van Weeren et al. (2012).
We also had the second poster session of the conference, including another Radio Galaxy Zoo result! The poster was led by RGZ science team member Minnie Mao (Joint Institute for VLBI in Europe), titled “Here Be Spiral DRAGNs”. Jean Tate, Minnie Mao, and several RGZ volunteers and science team members have been using RGZ to search for radio-loud AGN whose host galaxy is a spiral.* The acronym “DRAGN” stands for “double-lobed radio source associated with galactic nuclei”. These are extremely rare objects – the number of confirmed spiral DRAGNs discovered so far can be counted on your fingers – but really interesting. The standard physical model for how double-lobed, powerful radio sources are generated are triggered by mergers between galaxies and ultimately their black holes. In the process, a major merger disrupts and destroys the disk of the galaxy, resulting in an elliptical – this theory would predict that we see double radio AGN exclusively in massive ellipticals. That’s mostly true, but the existence of exceptions are fascinating and force astronomers to consider alternatives or extensions to the merger driven hypothesis. Minnie and Jean are going through a sample preliminarily assembled in RGZ to try and identify more candidates like these.

Minnie Mao (left) loves explaining her research on spiral DRAGNs from Radio Galaxy Zoo.
One more day to go!
*Changed wording on 24 October 2015 to emphasize the roles played by both volunteers and the science team.
New images for Galaxy Zoo! Part 2 – Illustris
We’re extremely excited to announce the launch of two new image sets today on Galaxy Zoo. Working with some new scientific collaborators over the past few months, we’ve been able to access data from two new sources. This blogpost will go into more details on where the images come from, what you might expect to see, and what scientific questions your classifications will help us answer. (See Part 1 of this post to learn about the other new images from the DECaLS survey).
The second set of new data comes from the Illustris Project. Illustris is a state-of-the-art simulation of the Universe, led by a large team of researchers in the US, UK, and Germany. Large-scale cosmological simulations are a critical tool in astronomy; since we don’t have laboratories where we can replicate the conditions of processes like galaxy formation, we use computer simulations to investigate them instead. Such simulations start with what we believe conditions in the very early Universe were like (which we infer from the cosmic microwave background), and can include both dark matter and baryons (particles like protons and neutrons that eventually form the stars, dust and gas in galaxies). The simulation then tracks what happens to the matter and energy over billions of years as the Universe expands, evolving according to the laws of physics that are programmed into the simulation. This includes relations like the law of gravity, which dominates how dark matter moves, and hydrodynamics, which describe the motions of the gas. It’s truly amazing – scientists can watch galaxies form and evolve over huge scales of distance and time, and compare the results to real observations to test if the physics of the simulations are correct. Illustris is one of the largest and most detailed simulations ever run, taking more than 19 million CPU hours to run on powerful supercomputers.

A large-scale projection through the Illustris volume at redshift z=0, centered on a massive cluster. The left side of the image shows the density of dark matter, while the right side shows the density of the gas in cosmic baryons. Image and text courtesy of the Illustris project.
This comparison to real data is the key feature that sparked the collaboration between Illustris and Galaxy Zoo. Once the simulation is run, astronomers analyze the results to see if their galaxies match the properties of those seen in the real Universe. This includes measurements like the total number of stars formed, the ratio of stars to dark matter, and the distribution of galaxies of different masses and luminosities. Another critical parameter we want to compare is galaxy morphology; measuring the ratio of ellipticals to spirals, for example, is an important test of whether the galaxy merger rate is correct, and if the simulation codes for star formation and gravitational interaction are correct.
The Illustris scientists have created images of the galaxies from their simulation that GZ volunteers will classify by their morphology. Our comparison data set for this will be the SDSS results from Galaxy Zoo 2, and the images are designed to match the Sloan images as closely as possible. This includes the same set of filters for the telescope, sizing the images so that the galaxies look like they’re at cosmic distance from the Milky Way, and setting them against backgrounds of stars and other galaxies. The quality of the simulations and images are amazing – these look to me like real galaxies in every way. It’s something that astronomers definitely couldn’t do ten years ago.

Two galaxies from the Illustris simulation evolving in time from left to right, from when the universe was a quarter its current age, to the present. The top galaxy shows a massive, red, elliptical-shaped galaxy forming after a series of mergers with other systems. The bottom galaxy reveals the formation of a smaller, bluer, disk-shaped galaxy forming after a less violent history of interactions. Images and text courtesy of the Illustris project.
Although these images aren’t of “real” galaxies, we want to emphasize again how much your classifications will help scientists to do astronomical research. Simulations like Illustris are the only way that we can probe galaxy formation and evolution as it happens. Your classifications, both from Galaxy Zoo 2 and from the new Illustris data, provide vital tests for the output and will be fed back to the science teams in order to improve future versions of these sims.
If you have questions or want to discuss anything you see in the new images, please join the discussion with scientists and volunteers on Talk. The Illustris Project also has some amazing online tools if you want to learn more, including an interactive explorer of the simulation and videos of the evolving Universe. You also can explore specific galaxies you’ve classified via GZ:Examine. As always, thanks to everyone for your help!
New images for Galaxy Zoo! Part 1 – DECaLS
We’re extremely excited to announce the launch of two new image sets today on Galaxy Zoo. Working with some new scientific collaborators over the past few months, we’ve been able to access data from two new sources. This blogpost will go into more details on where the images come from, what you might expect to see, and what scientific questions your classifications will help us answer. Part 2 of this post will discuss the other set of new images from the Illustris simulation.
The Dark Energy Camera Legacy Survey (DECaLS) is a public optical imaging project that follows up on the enormous, groundbreaking work done by the various versions of the SDSS surveys over the past decade. The aim of DECaLS is to use larger telescopes to get deeper images with significantly better data quality than SDSS, although over a somewhat smaller area. The science goals include studies of how both baryons (stars, gas, dust) and dark matter are distributed in galaxies, and particularly in measuring how those ratios change as a galaxy evolves. By adding morphology from Galaxy Zoo, our joint science teams will explore topics including disk structure in lower mass galaxies, better constraints on the rate at which galaxies merge, and gather more data on how the morphology relates to galaxy color and environment.
DECaLS observations use the Blanco telescope, which is located at CTIO in northern Chile at an altitude of 2200m (7200 ft). The telescope has a 4-m aperture mirror, giving it more than three times the collecting area of the SDSS telescope. The camera used for the survey is named DECam, a large-area and extremely sensitive instrument developed for a separate program called the Dark Energy Survey. The camera has 570 megapixels and covers a 2.2 degree field of view – more than 20 times the apparent size of the full moon! The combination of the exquisite dark-sky observing site, a sensitive wide-field camera, and larger telescope all combine to generate the new images, which will eventually include more than 140 million unique sources on the sky when DECaLS is finished.
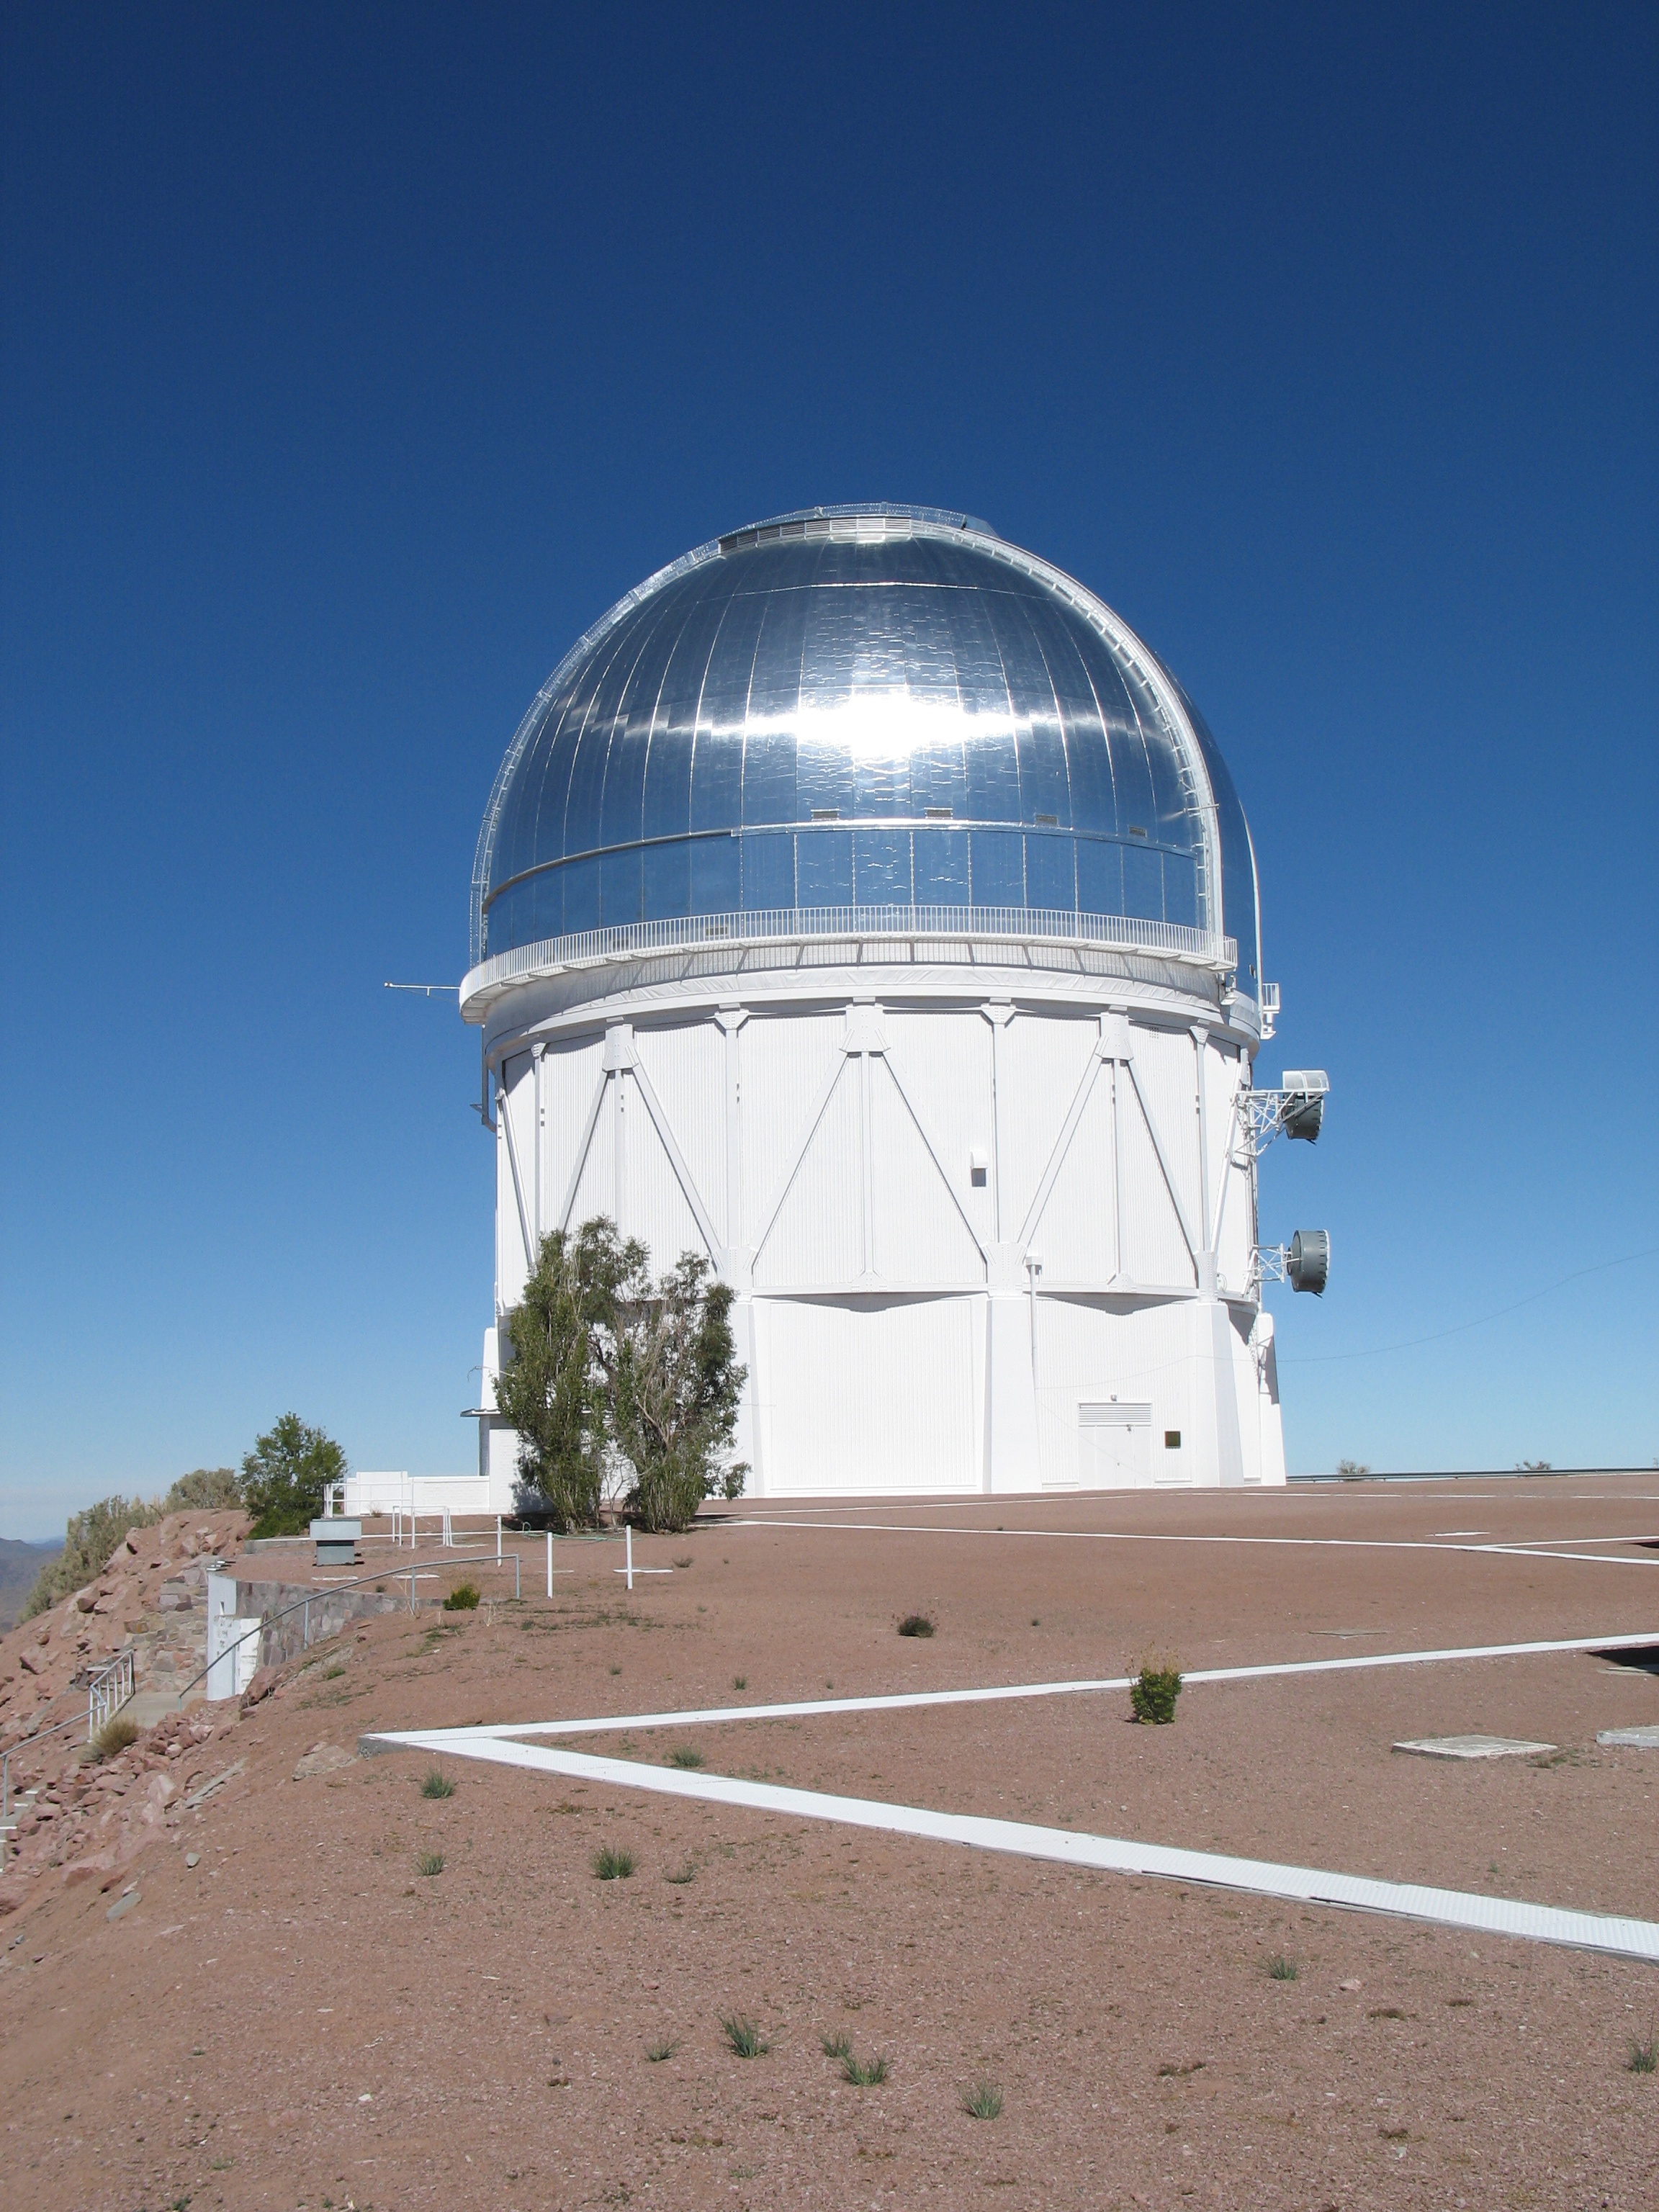
The Victor M. Blanco 4m telescope, located at CTIO in northern Chile, is carrying out the observations for the DECaLS survey. Image courtesy NOAO.
The DECaLS images in Galaxy Zoo are a smaller group taken from a catalog called the NASA-Sloan Atlas. We’re focusing on somewhat larger and brighter galaxies from the catalog. The reason is that although many of these galaxies have been classified in GZ already via their Sloan images, we’re particularly interested in measuring details like tidal tails from mergers, seeing fainter spiral structures, and separating galaxies that couldn’t be individually resolved in the Sloan data. Here’s a great example of a single galaxy in both SDSS and DECaLS – check out how much clearer the spiral arms are in the new images!

Left: an SDSS image of the galaxy J225336.34+000347.4. Right: a DECaLS image of the same galaxy.
Almost all of the morphology and classification tasks are the same as they were for the Sloan images, so it should be familiar to most of our users. If you have questions or want to discuss anything you see in the new images, please join the discussion with scientists and volunteers on Talk. As always, thanks for your help!


First Radio Galaxy Zoo paper has been accepted!
The first Radio Galaxy Zoo paper has been accepted by the Monthly Notices of the Royal Astronomical Society (MNRAS) and is available today on astro-ph. The paper entitled “Radio Galaxy Zoo: host galaxies and radio morphologies derived from visual inspection” outlines the project and provides the first look into some of the science that has come from Radio Galaxy Zoo.
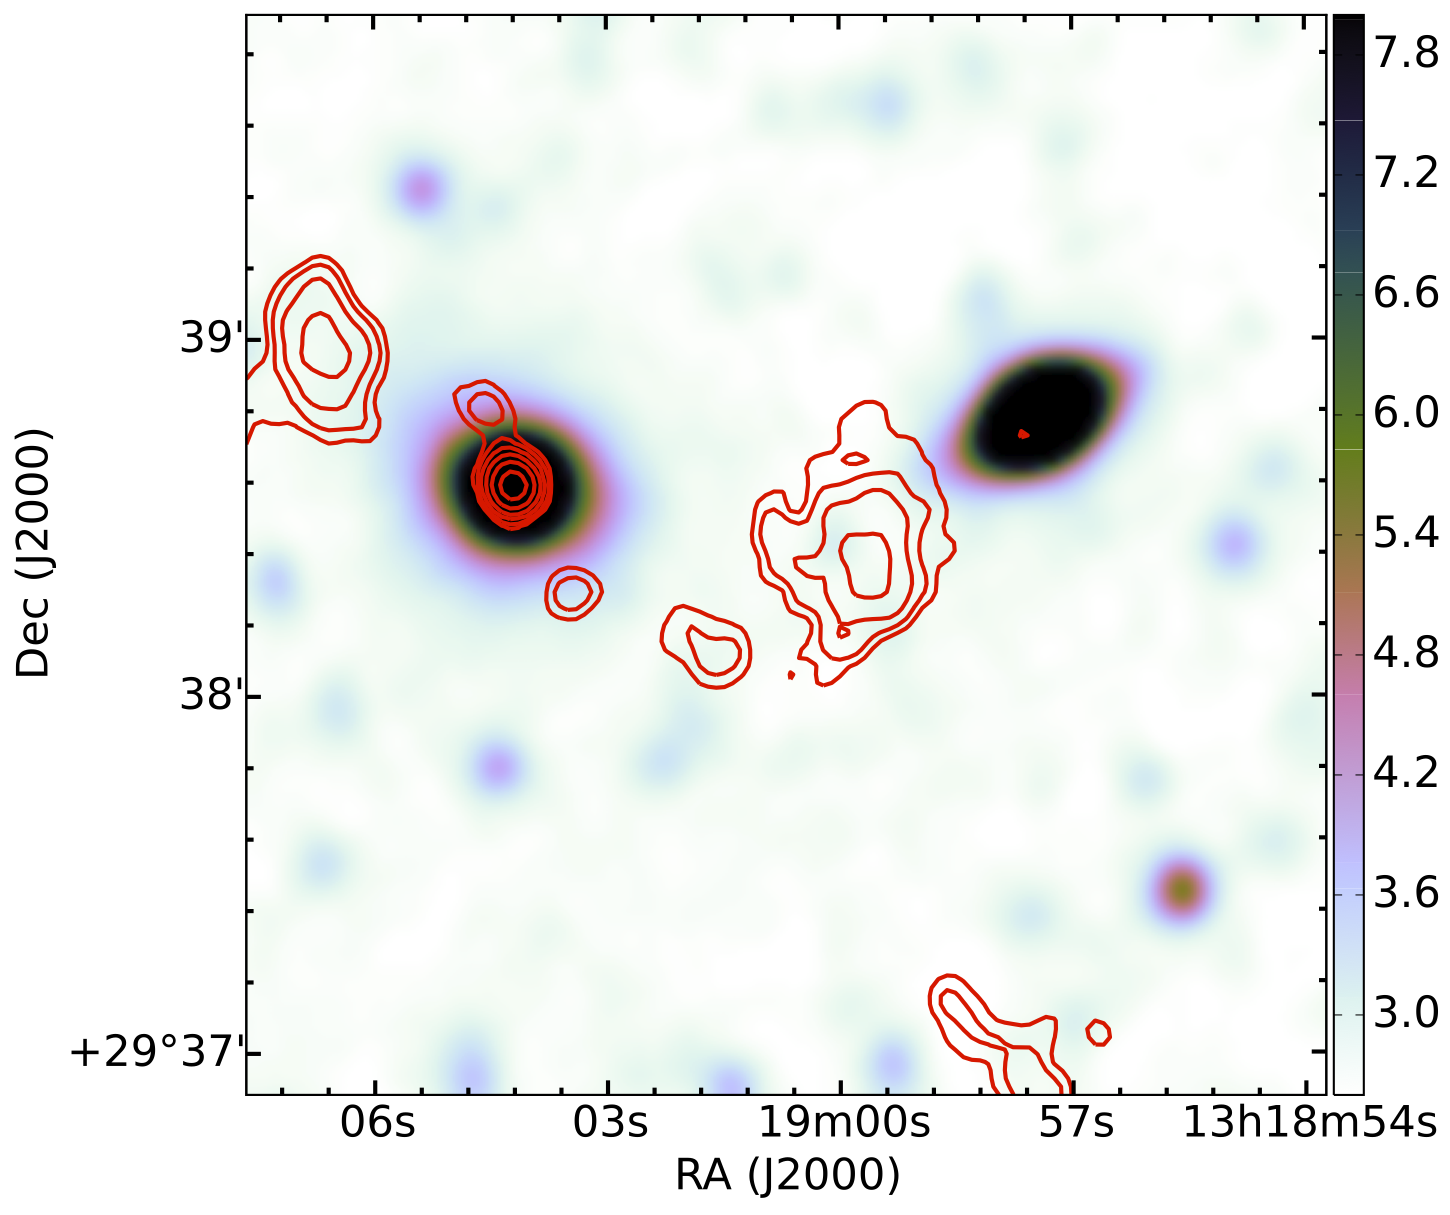
Fig. 1. An example of a galaxy where visual identification of the radio components is necessary. the automated algorithms would have classified the non-core emission as independent sources, whereas RGZ volunteers (in agreement with the science team) find all five radio emission components in the upper half of the image to be related to the same source.
As mentioned in our previous article about the paper, we find that the RGZ citizen scientists are as effective as the RGZ science team in identifying the radio sources and the host galaxies. The project now has over 7500 citizen scientists and their contributions are individually acknowledged at http://rgzauthors.galaxyzoo.org
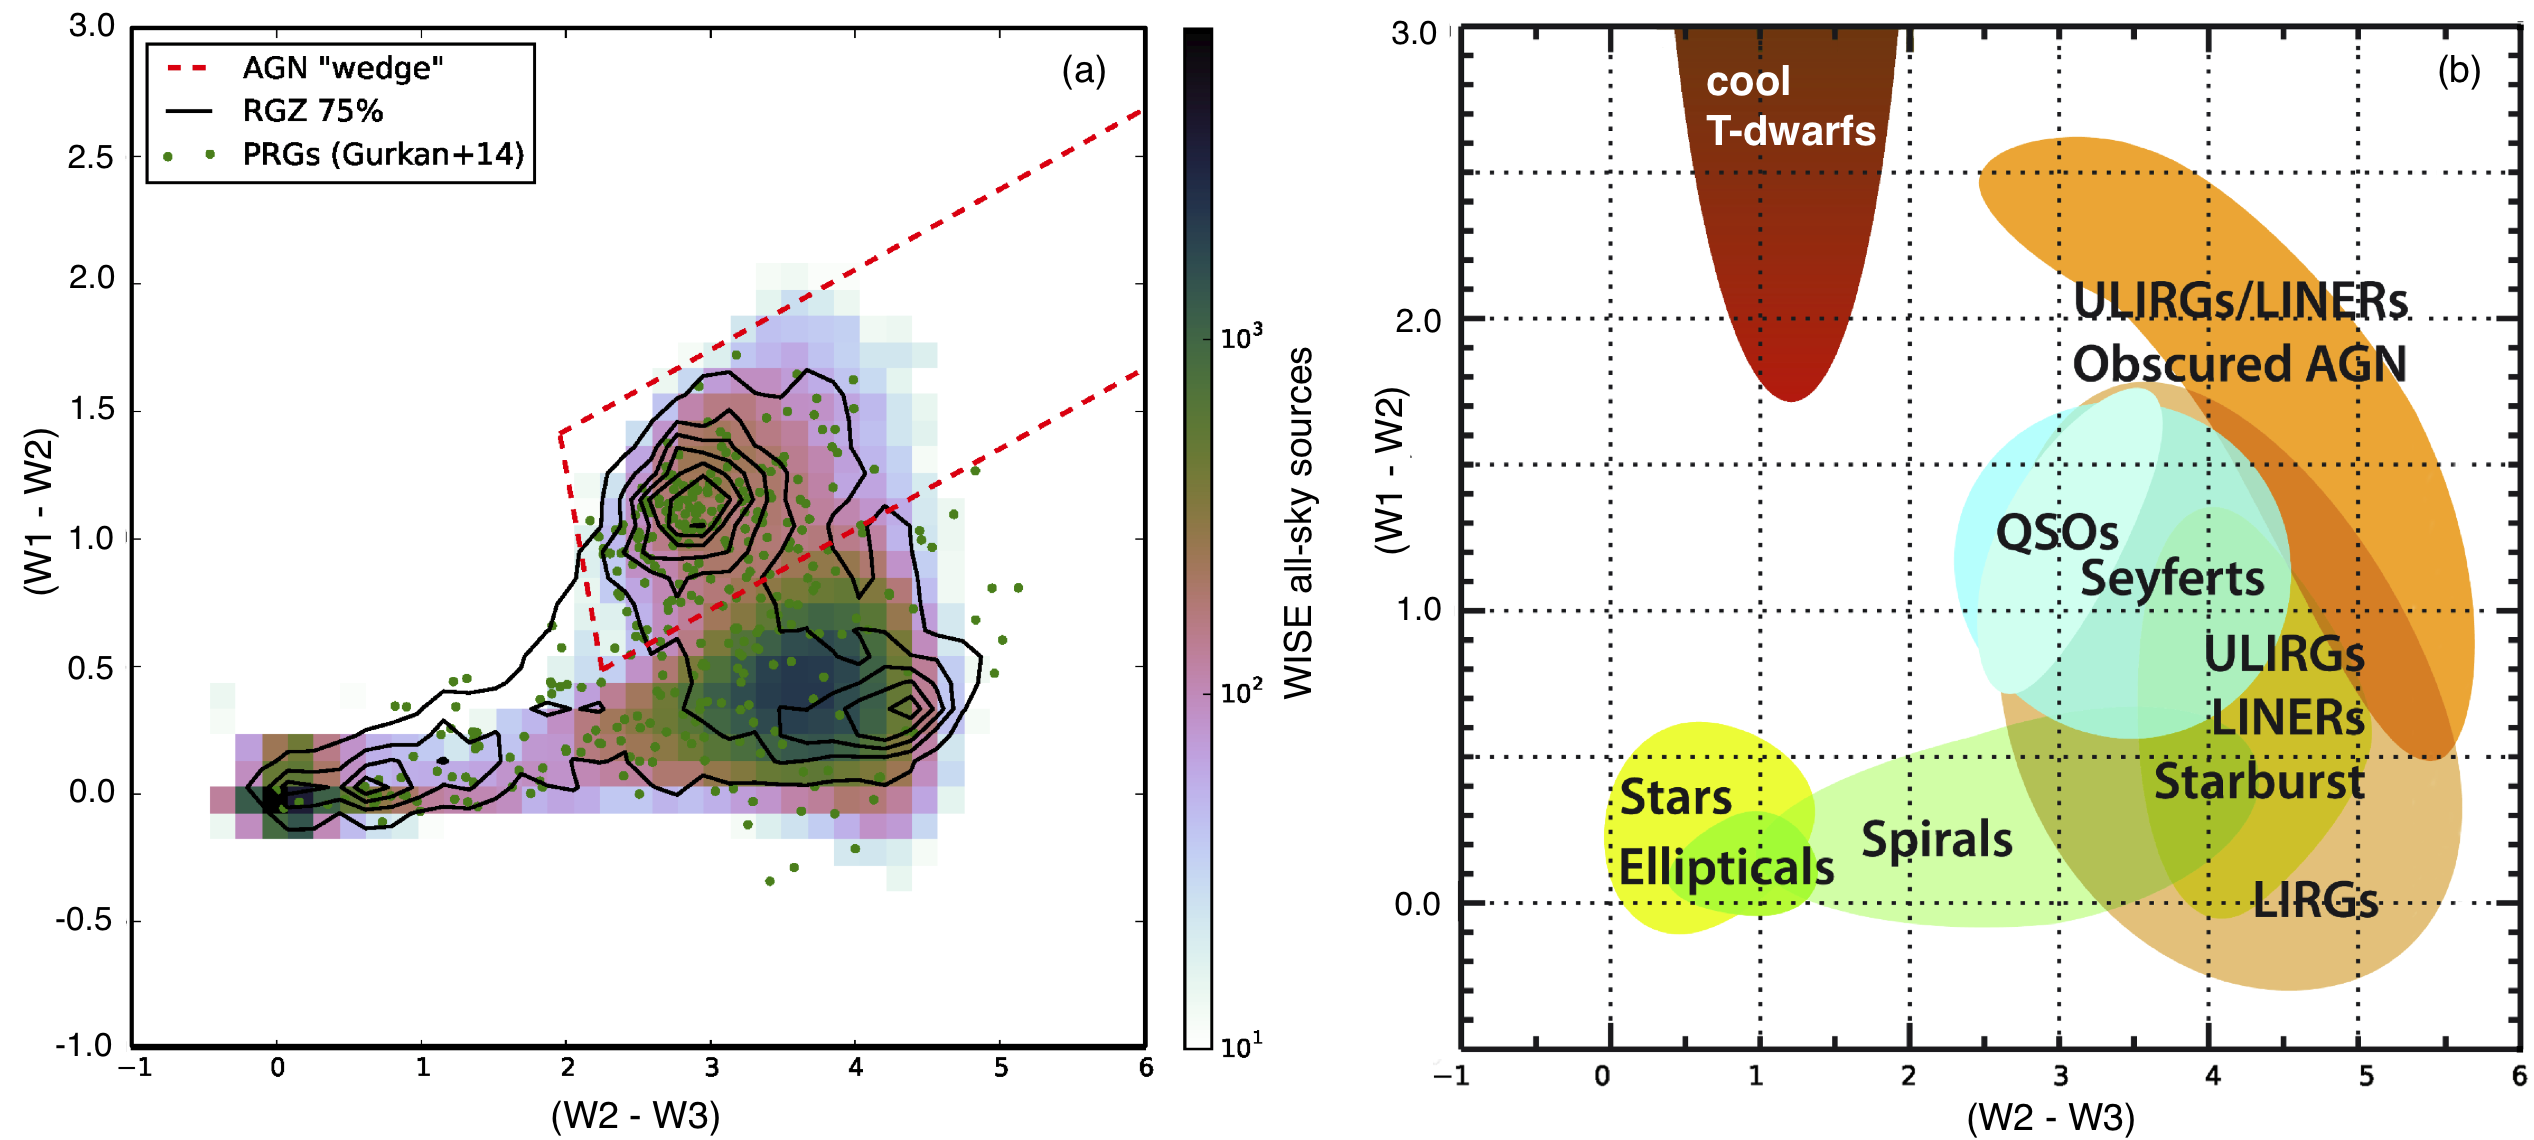
Fig. 2. (a) WISE colour-colour diagram showing approximately 100,000 WISE all-sky sources (colourmap), 4614 RGZ sources (black contours), and powerful radio galaxies (green points). (b) WISE colour-colour diagram showing the locations of various classes of astrophysical objects from Wright et al. (2010).
Using the classifications of the WISE infrared host galaxies, we find that the majority of the host galaxies are located in the WISE colour space consisting of elliptical galaxies, quasi-stellar objects (QSOs), and luminous infrared radio galaxies (LIRGs) – see Fig. 2. Upon closer examination of the RGZ objects that are identified as elliptical galaxies in the WISE W1-W2< 0.5 colour space we note that our current sample shows a possible large population of star-forming galaxies and/or ellipticals with enhanced dust – see Fig. 3.
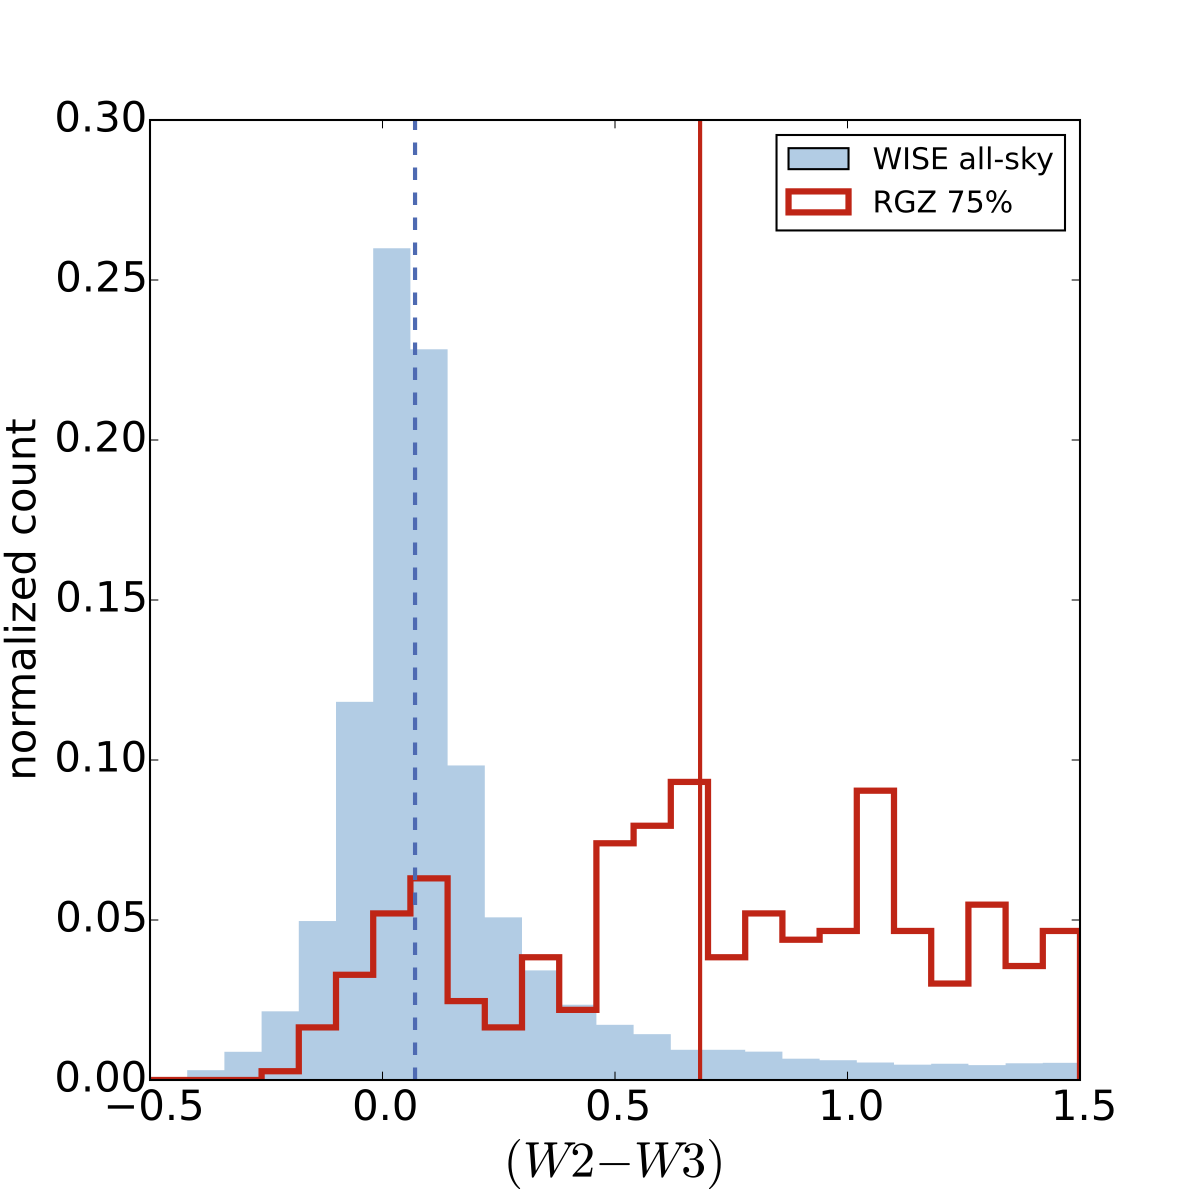
Fig. 3. Distribution of (W2 – W3) infrared colours for objects near the region identified as elliptical galaxies (W1 – W2) < 0.5. Solid and dashed vertical lines show the median colours of the all-sky and RGZ sources. While sources randomly selected from the WISE all-sky sample peak near (W2 – W3) = 0, our current RGZ sample shows a large population with significantly redder colours – possibly from star-forming galaxies and/or ellipticals with enhanced dust.
We still have a lot of radio sources in our project that need classification and we hope to continue the great work from all our citizen scientists and science team. Don’t forget to head over to Radio Talk for interesting discussions on objects or some of the science in general.
Thank you once again for your hard work and support throughout the first years of Radio Galaxy Zoo!
