
Radio Galaxy Zoo: a close-up look at one example galaxy
We hope everyone’s been excited about the first few days of Radio Galaxy Zoo; the science and development teams certainly have been. As part of involving you, the volunteers, with the project, I wanted to take the opportunity to examine and discuss just one of the RGZ images in detail. It’s a good way to highlight what we already know about these objects, and the science that your classifications help make possible.
For an example, I’ve chosen the trusty tutorial image, which almost everyone will have seen on their first time using RGZ. We’ll be focusing on the largest components in the center (and skipping over the little one in the bottom left for now).

The tutorial image for Radio Galaxy Zoo
The data in this image comes from two separate telescopes. Let’s look at them individually.
The red and white emission in the background is the infrared image; this comes from Spitzer, an orbiting space telescope from NASA launched in 2003 (and still operating today). The data here used its IRAC camera at its shortest wavelength, which is 3.6 micrometers. As you can see, the image is filled with sources; the round, smallest objects are either stars or galaxies not big enough to be resolved by the telescope. Larger sources, where you can see an extended shape, are usually either big galaxies or star/galaxy overlaps that lie very close together in the sky.
Overlaid on top of that is the data from the radio telescope; this shows up in the faint blue and white colors, as well as the contour lines that encircle the brightest radio components. The telescope used is the Australia Telescope Compact Array (ATCA) in rural New South Wales, Australia. This data was taken as part of the ATLAS survey, which mapped two deep fields of the sky (named ELAIS S1 and CDF-S) in the radio at a wavelength of 20 cm.
So, what do we know about the central sources? From their shape, this looks like what we would call a classic “double lobe” source. There are two radio blobs of similar size, shape, and brightness; almost exactly halfway between them is a bright infrared source. Given its position, it’s a very good candidate as a host galaxy, poised to emit the opposite-facing jets seen in the radio.
This object doesn’t have much of a mention in the published astronomical literature so far. Its formal name in the NASA database is SWIRE4 J003720.35-440735.5 — the name tells us that it was detected as part of the SWIRE survey using Spitzer, and the long string of numbers can be broken up to give us its position on the sky. This is a Southern Hemisphere object, lying in the constellation Phoenix (if anyone’s curious).
The only analysis of this galaxy so far appeared in a paper published by RGZ science team member Enno Middelberg and his collaborators in 2008. They made the first detections of the radio emission from the object, and matched the radio emission to the central infrared source by using an automatic algorithm plus individual verification by the authors. They classified it as a likely AGN based on the shape of the radio lobes, inferring that this meant a jet. It’s also one of the brighter galaxies that they detected in the survey, as you can see below – brighter galaxies are to the right of the arrow. That might mean that it’s a particularly powerful galaxy, but we don’t know that for sure (for reasons I’ll get back to in a bit).
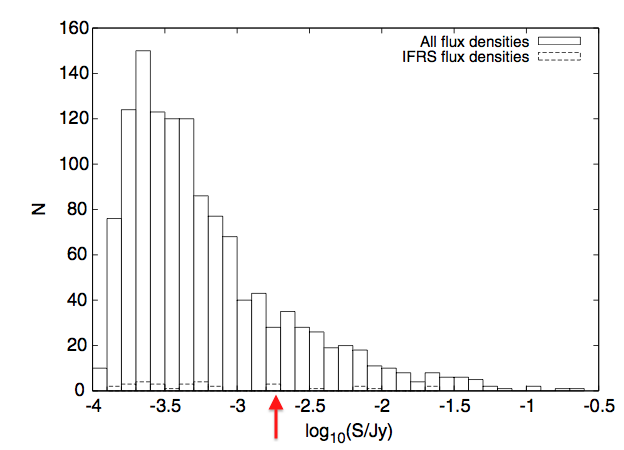
The brightnesses (measured in radio) of galaxies in ATLAS-SWIRE. From Middelberg et al. (2008).
So what we know is somewhat limited – this object has only ever been detected in the radio and near-infrared, and each of those only have two data points. The galaxy is detected at both at 3 and 4 micrometers in the infrared, but the camera didn’t detect it using any of its longer-wavelength channels. This makes it difficult to characterize the emission from the host galaxy; we need more measurements at additional wavelength to determine whether the light we see (in the non radio) is from stars, from dust, or from what we call “non-thermal processes”, driven by black holes and supernovae.
One of the biggest barriers to knowledge, though, is that the galaxy doesn’t currently have a measured distance. Distances are so, so important in astronomy – we spend a massive amount of time trying to accurately figure out how far away things are from the Earth. Knowing the distance tells us what the true brightness of the galaxy is (whether it’s a faint object nearby or a very bright one far away), what the true physical size of the radio jets are, at what age in the Universe it likely formed; a huge amount of science depends critically on this.
Usually distances to galaxies are obtained by taking a spectrum of it with a telescope and then measuring the Doppler shift (redshift) of the lines we detect, caused by the expanding Universe. The obstacle is that spectra are more difficult and more expensive to obtain than images; we can’t do all-sky surveys in the same way we can with just images. This is one reason why these cross-identifications are important; if you can help firmly identify the host galaxy, we can effectively plan future observations on the sources that need it.
Welcome to Radio Galaxy Zoo!
Today’s post is from Ivy Wong, who is delighted to announce our newest Galaxy Zoo project.
Welcome to the extraordinary world of radio astronomy. Observe the Universe through radio goggles and discover the jets that are spewing from the cores of galaxies!
Supermassive black holes lie deep in the cores of many galaxies. And though we cannot directly see these black holes, we do occasionally see the huge jets originating from the cores of some galaxies. However, most of these jets can only be seen in the radio.
 The figure on the left compares the extent of the radio jets from Centaurus A (the nearest radio galaxy to us) to the full moon using the same scale on the sky. Also, the small white dots in this image are not stars but individual background radio sources. The antennas in the foreground are 4 of the 6 antennas that make up the Australia Telescope Compact Array where the radio image was taken.
How do galaxies form these supermassive black holes? And how does having a supermassive black hole affect the evolution of its host galaxy as well as its neighbouring galaxies? Why don’t we see jets in every galaxy with a supermassive black hole? Though much progress has been made in recent years, there are still many open questions such as the above that we can shed light on by amassing a large sample.
To probe the co-evolution of galaxies and their central supermassive black holes, help us map the radio sky by matching the radio jets and filaments to the galaxies (via the infrared images) from whence they came.
 and infrared (red).")
Can you see the infrared galaxy between the radio jets?
This is a matching & recognition problem that humans are still best at, especially in cases where there are radio jets or multiple sources. And it’s an important task, one that will only become more important as the next generation of radio surveys and instruments come online and start producing enormous amounts of data. So if you’re willing to help, please try out the new Radio Galaxy Zoo and help find some growing black holes — and thank you!
We’re Observing at the Very Large Array!
I’m really excited to be able to post that galaxies selected with the help of Galaxy Zoo classifications are being observed at the VLA (Very Large Array) in New Mexico, possibly right now.

It’s the Very Large Array!
The funny thing about observing at the VLA is that you do all of the work for the actual observations in advance.
The VLA runs in queue mode – as an observer you have to submit very (very) detailed information about what you want the telescope to do during your session (called a “scheduling block”) and a set of constraints about when it’s OK to run that (for example you tell them when the galaxy is actually up in the sky above the telescope!). Then the telescope operators pick from the available pool of scheduling blocks at any time to make best use of the array.
This means after you submit the scheduling blocks you just have to sit and wait until you start getting notifications from VLA that your galaxies have been observed. The observing semester for the B-array configuration started on 4th October (had a pause for the US shutdown) and runs until the 13th January 2014. I’m happy to report that we started getting notifications in late November of the first of our 2 hour scheduling blocks having been observed. At the time of writing four of our galaxies have each been observed at least once (we need six repeat visits to each one to get the depth of data we’d like) for a total of 16 hours of VLA time. I’ve been getting notifications every couple of days – which means that as I write this the VLA could be observing one of our galaxies!
Since making these very detailed observation files is the observing prodecure at the VLA – it takes the length of time you’d expect given that…..
So, in September in-between a crazy travel schedule, and with a lot of help from our collaborator Kelley Hess at Cape Town, I spent a lot of time scheduling VLA observations of some very interesting very gas rich and very strongly barred galaxies we identified in the Galaxy Zoo 2 sample (the bit which overlaps with the ALFALFA survey which measures total HI gas in each galaxy).
We have been granted time to observe up to 7 of these fascinating objects (depending on scheduling constraints at the VLA) which I think may reveal some really interesting physics about how bars drive gas around in the discs of galaxies.
You might notice from the picture (and the name) that the VLA is not a “normal telescope”. It’s what astronomers call a radio interferometer. Signals are collected from 27 separate antennas and combined in a computer. This means that as well as observing sources for flux calibration (so we can link how bright our target is through the telescope with physical units) we also have to observe, roughly every 20 minutes or so a “phase calibrator” to be able to know how to correctly add the signals together from each of the antennae (to add them “in phase”).
So a single scheduling block lasting 2 hours for one of our sources comprises:
1. Information to tell the VLA where to slew initially and what instrumentation to use (how to “tune” it to the frequency we know the HI in the galaxy will emit at).
2. A short observation of a known bright source for flux calibration.
Then there’s a loop of
a. Phase calibration
b. Source observation
c. Phase calibration
d. Source observation
and so on – ending with a Phase calibration (on Kelley’s advice we’ll do 5 source observations, and 6 phase calibrations). We have a total of 6 of these blocks for each galaxy, that makes 12 hours of telescope resulting in about 10 hours of collecting 21cm photons per galaxy.
We have to check which times all these sources are visible to the VLA, and set durations for each part which give enough slew time and on source time wherever the sources are on the sky. And this all has to add up exactly to 2 hours to fit the scheduling block.
The benefit of this though is a telescope which acts like it’s much larger than you could ever physically build. We’re trying to detect emission from atomic hydrogen in these galaxies which emits at 21cm. So we need a really large telescope to get a sharp picture.
And just to end, because they’re lovely, here are the four galaxies the VLA has observed so far in the Sloan Digital Sky Survey visible light images.
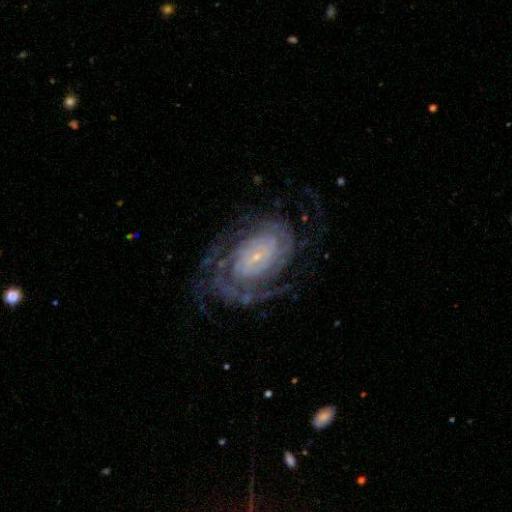


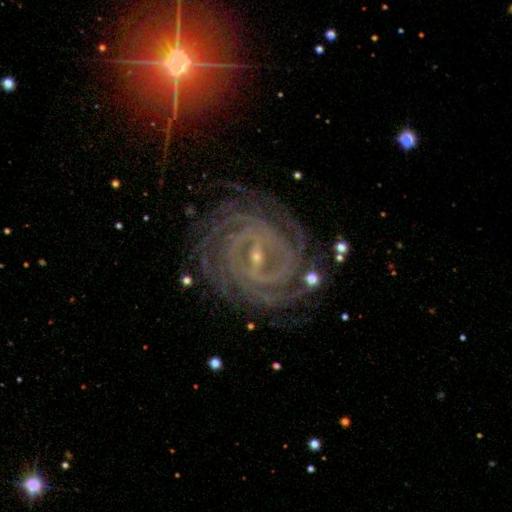
Thanks again for your help finding these rare and interesting galaxies. They’re rare, because they’re so gas rich and strongly barred – we have previously posted about how we showed strong bars are rare in galaxies with lots of atomic hydrogen. Hopefully we’ll have some exciting results to share once we’ve analysed these data.
(PS. That takes a lot of time too – it’ll be almost 1TB of data to process in total!).
Bars as Drivers of Galactic Evolution
Hello everyone – my name is Becky Smethurst and I’m the latest addition to the Galaxy Zoo team as a graduate student at the University of Oxford. This is my first post (hopefully of many more) on the Galaxy Zoo blog – enjoy!
So far there have been over 100 scientific research papers published which make use of your classifications, some of which have been written by the select few Galaxy Zoo PhD students (most of us are also previous Zooites). The most recently accepted article was written by Edmund, who wrote a blog post earlier this year on how bars affect the evolution of galaxies. As part of the astrobites website, which is a reader’s digest of research papers for undergraduate students, I wrote an article summarising his latest paper. Since the Zooniverse team know how amazing the Galaxy Zoo Citizen Scientists are, we thought we’d repost it here for you lot to read and understand too. You can see the original article on astrobites here, or read on below.
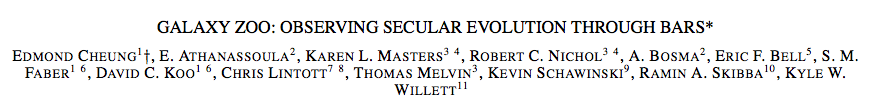
Title: Galaxy Zoo: Observing Secular Evolution Through Bars
Authors: Cheung, E., Athanassoula, E., Masters, K. L., Nichol, R. C., Bosma, A., Bell, E. F., Faber, S. M., Koo, D. C., Lintott, C., Melvin, T., Schawinski, K., Skibba, A., Willett, K.
Affiliation: Department of Astronomy and Astrophysics, University of California, Santa Cruz, CA 95064
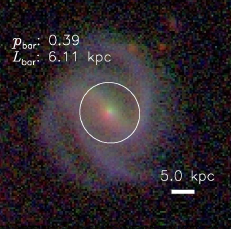
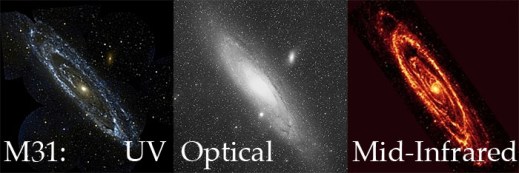
Galactic bars are a phenomenon that were first catalogued by Edwin Hubble in his galaxy classification scheme and are now known to exist in at least two-thirds of disc galaxies in the local Universe (see Figure 1 for an example galaxy).
Throughout the literature, bars have been associated with the existence of spiral arms, rings, pseudobulges, star formation and even Active Galactic Nuclei.

- Figure 1: An example of one of the galaxies inspected in the study by Cheung et al., showing the bar likelihood
and the scaled bar length
.
Bars are a key factor in our understanding of galactic evolution as they are capable of redistributing the angular momentum of the baryons (visible matter: stars, gas, dust etc.) and dark matter in a galaxy. This redistribution allows bars to drive stars and gas into the central regions of galaxies (they act as a funnel, down which material flows to the centre) causing an increase in star formation. All of these processes are commonly known as secular evolution.
Our understanding of the processes by which bars form and how they consequently affect their host galaxies however, is still limited. In order to tackle this problem, the authors study the behaviour of bars in visually classified disc galaxies by looking at the specific star formation rate (SSFR; the star formation rate as a fraction of the total mass of the galaxy) and the properties of their inner structure. The authors make use of the catalogued data from the Galaxy Zoo 2 project which asks Citizen Scientists to classify galaxies according to their shape and visual properties (more commonly known as morphology). They particularly make use of the parameter
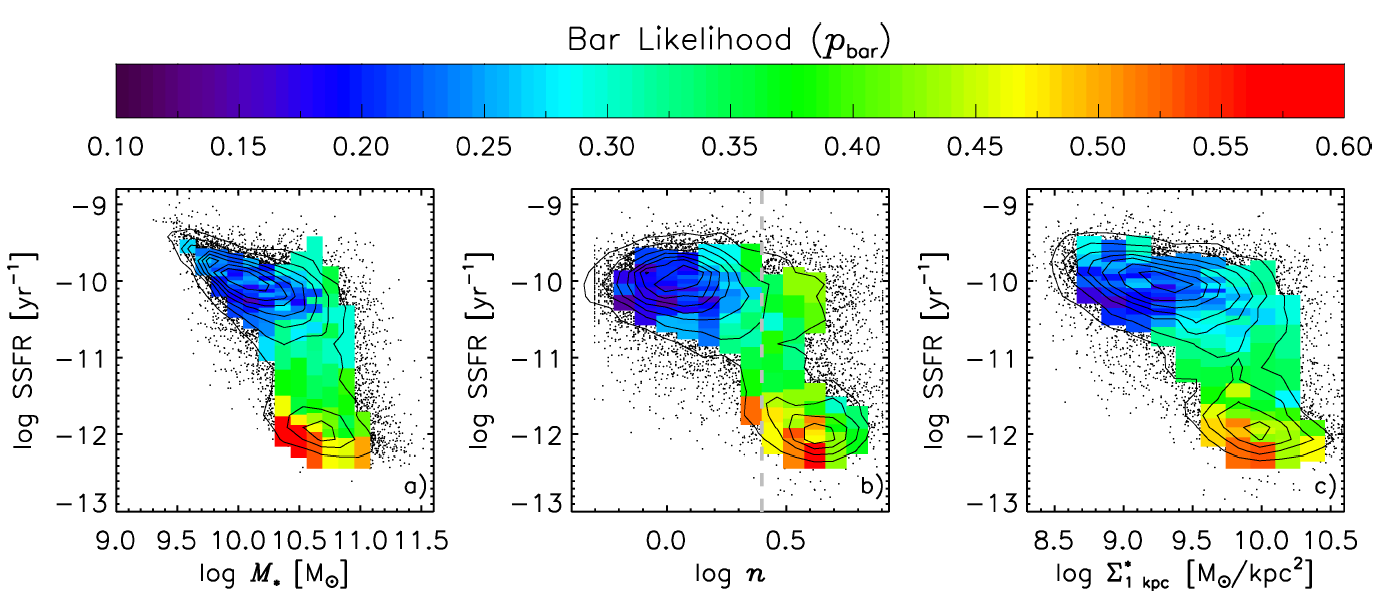
They first plot this bar likelihood using coloured contoured bins, as shown in Figure 2 (Figure 3 in this paper), for the specific star formation rate (SSFR) against the mass of the galaxy, the Sérsic index (a measure of how disc or classical bulge dominated a galaxy is) and the central mass density of a galaxy (how concentrated the bulge of a galaxy is). At first glance, no trend is apparent in Figure 2, however the authors argue that when split into two samples: star forming (log SSFR > -11 

- Figure 2: The average bar likelihood shown with coloured contoured bins for the specific SFR (SFR with respect to the the total mass of the galaxy) against (i) the mass of the galaxy, (ii) the Sérsic index (a measure of whether a galaxy is disc (log n > 0.4) or bulge (log n < 0.4) dominated and (iii) the central surface stellar mass density. This shows an anti-correlation of
Bars become longer over time as they transfer angular momentum from the bar to the outer disc or bulge. In order to determine whether the trends seen in Figure 2 are due to the evolution of the bars or the likelihood of bar formation in a galaxy, the authors also considered how the properties studied above were affected by the length of the bar in a galaxy. They calculate this by defining a property

- Figure 3: The average (in bins of ~ 100 galaxies) length of a galaxy bar (
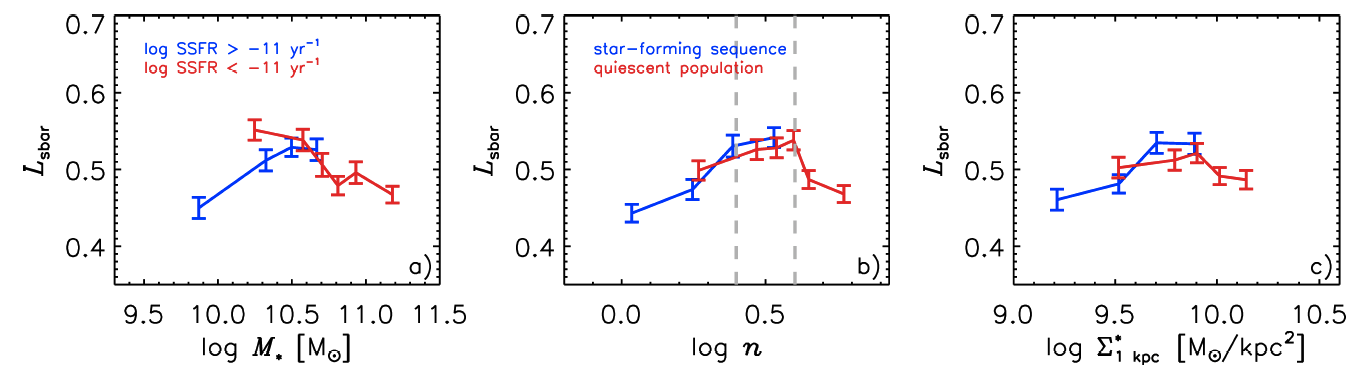
As before, Figure 3 shows that the trend in the star forming galaxies is for an increase in 
The authors argue that this correlation between
Galaxy drumstick, anyone?
Over the past six years, Galaxy Zoo volunteers have spotted innumerable patterns in the shapes of regular, merging, and fortuitously overlapping galaxies in the various surveys. While we’ve had great success with letters of the alphabet and with animals, searches of both the Forum and Talk haven’t revealed many turkeys so far. In recognition of Thanksgiving in the U.S. this week, we offer this turkey drumstick (or tofurkey, if you’re a veggie like some team members) spotted last year by volunteer egalaxy.

A galaxy (or pair?) at z=0.436, spotted in Galaxy Zoo: Hubble
For those of you who get them, enjoy the break — and let us know what you think about this interesting galaxy (or possible overlapping pair)!
UPDATE: Next Live Hangout: Tuesday, 19th of November, 7 pm GMT

Our next hangout will be next Tuesday at 7 pm European time / 6 pm UK / 3 pm in Chile / 1 pm EST / 10 am PST.
Update: Our next hangout will be next Tuesday at 8 pm European time / 7 pm UK / 4 pm in Chile / 2 pm EST / 11 am PST.
I mention Chile above because two team members will be at a conference in Chile at the time (spreading the word about Galaxy Zoo is a tough job, but someone’s got to do it) and will try to be on the hangout with us.
What do you want us to talk about? We have some ideas but if you have questions, please let us know!
Just before the hangout we’ll update this post with the embedded video, so you can watch it live from here. If you’re watching live and want to jump in on Twitter, please do! we use a term you’ve never heard without explaining it, please feel free to use the Jargon Gong by tweeting us. For example: “@galaxyzoo GONG dark matter halo“.
See you soon!
Galaxy Zoo: Now Available In Chinese (Mandarin)
 What follows is a press release from Academia Sinica’s Institute of Astronomy & Astrophysics, regarding the new Mandarin Galaxy Zoo. Below is some context for English speakers and regular Galaxy Zoo users.
在可觀測宇宙散佈千億星系,許多以美麗著稱。光芒閃耀的每個星系裡,都有數十億顆恆星。新推出的「星系動物園」網站中文版,和研究星系大有關聯,不管有沒有天文背景,只要有網路,無論愛上網咖還是宅宅A咖,只花二分鐘也可參與星系分類的Galaxy Zoo計畫,自2007年以來,在英、美、歐地區成為網民科普熱門運動,已經招募87萬名星系分類員(志工),大受歡迎。原來星星可以這樣數。
2013年10月份,在中研院年度開放日這天,由中研院天文所推廣成員共同翻譯完成的中文版網站,也選在這天首度公開試用,在場民眾只花二分鐘做星系形態辨識,分類結果就成為整個科學計畫資料庫的一部分,換言之,中文版的星系分類員是實際參與貢獻了科學研究,這吸引不少熱心學生和家長,「做天文只要二分鐘,很酷!而且學到新知識。」
從”Galaxy Zoo”到「星系動物園」,天文所推廣組表示,「兩年前就想過要做」的這個計畫,今年8月,一經天文所博士後研究Meg Schwamb再次提議,立刻獲得響應,網站中文化水到渠成,也讓台灣在全球天文學界再博得一次「亞洲第一」的小獎勵(註:目前該網站只有英文版和西語版)。推廣組表示,由於星系資料持續新增,分類員在圖像庫中撈到某個從未曾被人見過的星系,或「全球第一人」這樣的說法,確實所言不虛。
來自英國的Galaxy Zoo計畫主持人Chris Lintott表示,在網民科學網站傘狀計畫下的項目還有很多,天文類的譬如行星獵人(Planet Hunters)和火星氣候(Planet Four)。這些都必須靠各位地球人以好眼力來熱情相挺,電腦可幫不上忙。為什麼呢?歡迎上網一探究竟:http://www.galaxyzoo.org/?lang=zh
眨眼睛、動滑鼠、幫幫星系分分類!
Last weekend, led by Dr. Meg Schwamb (who is part of the Planet Hunters and Planet Four teams), a team of Taiwanese astronomers helped introduced a Chinese (Mandarin) version a Galaxy Zoo to the public on the Open House Day of Academia Sinica, the highest academic institution in Taiwan.
A big crowd of enthusiastic students and parents, attracted by the long queue itself, visited the ‘Citizen Science: Galaxy Zoo’ booth to try the project hands-on by doing galaxy classifications. They were excited to participate in scientific research and enjoyed it very much.
“Amazing! In just two minutes, we have helped astronomer doing their research, it’s so cool! Also, we learn new astronomical facts we never knew before. It’s a good show.”
The Education Public Outreach team of Academia Sinica’s Institute of Astronomy & Astrophysics (a.k.a. “ASIAA”), has helped translated Galaxy Zoo from English to Chinese (Mandarin). The main translator, Lauren Huang said, “we were keen to do a localized version for Galaxy Zoo since 2010, so when Meg brought up this nice idea again, we acted upon it at once.” In less than six weeks, it was done. The other translator, Chun-Hui, Yang, who contributed to the translation, said that she likes the website’s sleek design very much. “I think the honor is ours, to take part in such a well-designed global team work!” Lauren said.
Talking about the translation process process, Lauren provided an anecdote that she thought about giving “zoo” a very local name, such as “Daguanyuan” (“Grand View Garden”), a term with authentic Chinese cultural flavour, and is from classic Chinese novel Dream of the Red Chamber. She said, “because, my personal experience in browsing the Galaxy Zoo website has been very much just like the character Ganny Liu in the classics novel. Imagine, if one flew into the virtual image database of the universe, which contains all sorts of hidden treasures waiting to be explored, what a privilege, and how little we can offer, to help on such a grandeur design?” However, the zoo is still translated as “Dungwuyuan”, literally, just as “zoo “. Because that’s what some Chinese bloggers have already accustomed to, creating a different term might just be too confusing.
You can check out the Traditional Character Chinese (Mandarin) version of Galaxy Zoo at http://www.galaxyzoo.org/?lang=zh
Wish You Were All Here…
Today’s post is from Ivy Wong, Science Team member and PI of an upcoming new project. She also did an amazing job organizing our Galaxy Zoo conference in Australia. Read on for details!
It has been 2 weeks since the “Evolutionary Paths in Galaxy Morphology” meeting in Sydney and I am still recovering from the post-conference brain-melt, also described in Brooke’s blog post. Perhaps I am getting old.
The 4 days of cutting-edge science presentations and discussions went by all too quickly. And we are now left with new ideas for new projects and renewed motivation for finishing up current ones. It is also becoming clear that the term morphology is slowly evolving from a once vague division between early- and late-type galaxies (i.e. spheroids or spirals; as inferred from observations using optical telescopes) to include more specific descriptions of a galaxy’s form which includes the 3-dimensional dynamics and kinematics. Also, how a galaxy looks at a different wavelength will depend on factors such as how hot its interstellar medium is, how much gas it has, what state that gas is, how active is the galaxy’s central supermassive black hole and whether it is experiencing any harassment by its neighbours and local environment.
As our understanding of galaxy morphology evolves, so too will the Galaxy Zoo project. As you may have heard, the next generation Galaxy Zoo project will show us morphologies that will be completely alien to most of us, even those who enjoy a regular dose of science fiction. The new Radio Galaxy Zoo project will show us images observed in the radio wavelengths, typically coming from synchrotron radiation. Synchrotron emission results from accelerated charged particles moving at relativistic velocities and is usually seen as outflows/jets from a galaxy’s central supermassive black holes.
Though this already happened during the conference dinner, I’d like to take this opportunity to make a repeat of the toast (albeit virtually) to the >800,000 citizen scientists who has helped us thus far. It would have been lovely to have you all join us at the meeting, but we would have probably sunk our dinner boat. So if you’re interested in checking out some of the presentations from this meeting, please go to:
gzconf.galaxyzoo.org
The official conference program booklet will help put these presentations into context and can be found at:
atnf.csiro.au/research/conf…es/gzconf_booklet.pdf
Am definitely looking forward to the next big Galaxy Zoo conference. Perhaps somewhere up North next time?

A Galaxy Zoo conference is not complete without after hours drinks by the harbour. From left to right: Brooke, Karen, Jeyhan, Julie & Ivy in pic 1. Amit, Kyle, Bill, Chris L. & Chris S. in pic 2. (Photo credit: Amanda Bauer aka @astropixie)
Galaxy Zoo Continues to Evolve
Over the years the public has seen more than a million galaxies via Galaxy Zoo, and nearly all of them had something in common: we tried to get as close as possible to showing you what the galaxy would actually look like with the naked eye if you were able to see them with the resolving power of some of the world’s most advanced telescopes. Starting today, we’re branching out from that with the addition of over 70,000 new galaxy images (of some our old favorites) at wavelengths the human eye wouldn’t be able to see.
Just to be clear, we haven’t always shown images taken at optical wavelengths. Galaxies from the CANDELS survey, for example, are imaged at near-infrared* wavelengths. But they are also some of the most distant galaxies we’ve ever seen, and because of the expansion of the universe, most of the light that the Hubble Space Telescope (HST) captured for those galaxies had been “stretched” from its original optical wavelength (note: we call the originally emitted wavelength the rest-frame wavelength).
Optical light provides a huge amount of information about a galaxy (or a voorwerpje, etc.), and we are still a long way from having extracted every bit of information from optical images of galaxies. However, the optical is only a small part of the electromagnetic spectrum, and the other wavelengths give different and often complementary information about the physical processes taking place in galaxies. For example, more energetic light in the ultraviolet tells us about higher-energy phenomena, like emission directly from the accretion disk around a supermassive black hole, or light from very massive, very young stars. As a stellar population ages and the massive stars die, the older, redder stars left behind emit more light in the near-infrared – so by observing in the near-IR, we get to see where the old stars are.
The near-IR has another very useful property: the longer wavelengths can mostly pass right by interstellar dust without being absorbed or scattered. So images of galaxies in the rest-frame infrared can see through all but the thickest dust shrouds, and we can get a more complete picture about stars and dust in galaxies by looking at them in the near-IR.

Even though the optical SDSS image (left) is deeper than the near-IR UKIDSS image (right), you can still see that the UKIDSS image is less affected by the dust lanes seen at left.
Starting today, we are adding images of galaxies taken with the United Kingdom Infrared Telescope (UKIRT) for the recently-completed UKIDSS project. UKIDSS is the largest, deepest survey of the sky at near-infrared wavelengths, and the typical seeing is close to (often better than) the typical seeing of the SDSS. Every UKIDSS galaxy that we’re showing is also in SDSS, which means that volunteers at Galaxy Zoo will be providing classifications for the same galaxies in both optical and infrared wavelengths, in a uniform way. This is incredibly valuable: each of those wavelength ranges are separately rich with information, and by combining them we can learn even more about how the stars in each galaxy have evolved and are evolving, and how the material from which new stars might form (as traced by the dust) is distributed in the galaxy.

1 galaxy, 4 redshifts.
In addition to the more than 70,000 UKIDSS near-infrared images we have added to the active classification pool, we are also adding nearly 7,000 images that have a different purpose: to help us understand how a galaxy’s classification evolves as the galaxy gets farther and farther away from the telescope. To that end, team member Edmond Cheung has taken SDSS images of nearby galaxies that volunteers have already classified, “placed” them at much higher redshifts, then “observed” them as we would have seen them with HST in the rest-frame optical. By classifying these redshifted galaxies**, we hope to answer the question of how the classifications of distant galaxies might be subtly different due to image depth and distance effects. It’s a small number of galaxies compared to the full sample of those in either Galaxy Zoo: Hubble or CANDELS, but it’s an absolutely crucial part of making the most of all of your classifications.
As always, Galaxy Zoo continues to evolve as we use your classifications to answer fundamental questions of galaxy evolution and those answers lead to new and interesting questions. We really hope you enjoy these new images, and we expect that there will soon be some interesting new discussions on Talk (where there will, as usual, be more information available about each galaxy), and very possibly new discoveries to be made.
Thanks for classifying!
* “Infrared” is a really large wavelength range, much larger than optical, so scientists modify the term to describe what part of it they’re referring to. Near-infrared means the wavelengths are only a bit too long (red) to be seen by the human eye; there’s also mid-infrared and far-infrared, which are progressively longer-wavelength. For context, far-infrared wavelengths can be more than a hundred times longer than near-infrared wavelengths, and they’re closer in energy to microwaves and radio waves than optical light. Each of the different parts of the infrared gives us information on different types of physics.
** You might notice that these galaxies have a slightly different question tree than the rest of the galaxies: that’s because, where these galaxies have been redshifted into the range where they would have been observed in the Galaxy Zoo: Hubble sample, we’re asking the same questions we asked for that sample, so there are some slight differences.
Top Image Credits and more information: here.
Congratulations Edmond: another Galaxy Zoo paper accepted
A quick post to say congratulations to new Galaxy Zoo science team member Edmond Cheung, a PhD student from UC Santa Cruz, on the publication of his first Galaxy Zoo paper. Edmond approached us some time ago and was interested in doing further study on the barred galaxies in both Galaxy Zoo 2 and GZ: Hubble. This paper is the result of the excellent work he’s done looking at more detail on the properties of bars in the Galaxy Zoo 2 classifications.
The paper has recently been accepted to the Astrophysical Journal, and will appear on the arxiv very shortly.
The main result is a stronger proof than has ever before been seen that secular (that is, very slow) evolution affects the properties of barred galaxies, which grow larger bulges and slow down in their star formation the longer the bars grow (or the older the bars are).
Edit: This paper is now available on the arXiv at http://arxiv.org/abs/1310.2941
