
Galaxy Zoo and the Nobel Prize
No, no one on the Zoo team has won the Nobel Prize. But there are interesting connection with the 2009 Physics prizes, just announced by the Swedish Academy. The prize was shared by Charles Kao, Willard Boyle, and Charles Smith. Kao’s work contributed greatly to making fiber optics feasible for reliable transmission of signals at high bandwidth, a prerequisite for the Internet as we know it today. And incidentally, optical fibers have multiplied the effectiveness of spectrographs for astronomical surveys, by letting us pipe light from hundreds of objects at once into a single spectrograph; this is how all the SDSS spectra examined by Zooites were obtained.
Boyle and Smith shared the prize for their work in inventing charge-coupled devices. These are the electronic chips used for digital images, which have multiplied the reach of astronomical telescopes and worked their way into tens of millions of digital cameras. Compared to photographic emulsion, CCD chips are vastly more sensitive, can be calibrated more accurately, are reusable, and provide their output immediately in digital form for computer analysis or telemetry. Of course, the Sloan Digital Sky Survey made good use of these properties, with a mosaic of CCDs behind five different filters scanning the sky.
Finally, I suspect the prize committee was aware of the Galaxy Zoo project. At the very end of their excellent document on the science behind the prizes, we read:
“In science, the possibility of transferring and processing images digitally is a real revolution. Digital image processing is now a global commodity which enables, for instance, the best international expertise to be involved in crucial diagnostic and even surgical situations, through remote control and feedback through digital cameras. Furthermore the evaluation of large amounts of data (e.g. created in mapping the universe) can be spread to many groups and even to volunteers from the general public.”
Hmmmm. Data mapping the Universe, whose evaluation is shared among volunteers from the general public. That reminds me of something… At any rate, I think I can speak for the whole Zoo community in saying to Kao, Boyle, and Smith – congratulations, and a special vote of thanks!
Galaxy Zoo gets a mention on The Archers
Someone sent me the following link:
http://www.bbc.co.uk/radio4/archers/catch/
Friday’s episode (October 2nd), 5:50 in. It’s a cute mention.
“People all over the world, categorizing galaxies… It’s rather, addicting,
actually.
Google Powered GZ2 Bar drawing spin off, 1 down….

Firstly, I’d like to thank all those users who have used the bar drawing website. As of yesterday at 10pm we have recorded responses from 97 unique users and every galaxy had been looked at by at least one user. This is excellent news and we are delighted with the response the site has received.
The site can be found here: http://www.icg.port.ac.uk/~hoyleb/bars/ and the forum here.
We know some users have experienced problems accessing the site. We apologise if this has caused frustration. We remind you that our site is best viewed in Firefox[download here] – response with IE is particularly unreliable. Right now the bar drawing site is hosted at the University of Portsmouth, so the server is not as fast as the main Galaxy Zoo server. If site speed continues to be a problem and/or we start attracting significantly more users we will consider moving the site. Also remember that Google Maps set the zoom level. If you zoom in further than they have data you will see only a white image. Just zoom out until you can see the galaxy. Most other problems can be solved by hitting the reset button – if you reload the page you will move to the next galaxy.
Due to popular demand, we have added a counter to the site, showing you how many classifications you have made.
Thanks for all your help and input.
Ben and Karen [on behalf of the bar drawing team]
Zooing all over the world
I last updated the Galaxy Zoo city league table back in April. How do things look now? In good old fashioned reverse order :
10 Down from 2nd last time, Manchester. Having e-MERLIN to play with is obviously distracting our good friends at Jodrell.
9 A new entry – Los Angeles. Presumably Hollywood doesn’t have enough stars of its own.
8 Berlin The first non-native English speaking city to make the list. Will it be the highest?
7 A suprise 5th last time, Bristol is down two spots this time.
6 The third new entry in a row is Melbourne, according to Wikipedia home to the world’s largest tram network.
5 Down two spots from 4th last time, New York is the highest ranked American city.
4 The team behind the Polish translation of Galaxy Zoo 2 have been working hard, and they’re rewarded by seeing Warsaw in 4th place. It’s not the highest new entry, though.
3 Rising four places, Sydney. Australians can’t stand the sight of a league table they’re not on the top of.
2 In second, this chart’s highest new entry – Eindhoven. A stunning performance from our Dutch classifiers.
1 But hanging onto first place in the Zoo classification stakes is London. Can anything topple the legions of office-bound zooites from the top of the tree?
Merger Papers Accepted for Publication in MNRAS
Thanks for everyone’s work – both papers should soon be appearing in the Monthly Notices of the Royal Astronomical Society 🙂

Galaxy Zoo motivation study paper accepted!
Our paper on the motivations of Galaxy Zoo users has been accepted for publication in the journal Astronomy Education Review! Now that the paper has been accepted, I have posted it on the arXiv system. Head on over and read it if you’re interested in hearing more about the interviews we did with some of you to learn what makes Galaxy Zoo appeal to you. I wrote a summary of the paper for this blog a while back, but now you can read the paper itself.
The paper should appear in the Galaxy Zoo Library in the forum soon, and Pamela, Georgia, or I would be glad to answer any questions you have about the paper there. The next step in this research is to analyze the data from the survey that many of you took, and we’re working on that step now. Updates on that will come soon. Thanks to my lovely co-authors, and of course to all of you, without whom this none of this research would be possible!
Voorwerping, Part 1
I’m working on the Suzaku data that we’ve obtained on IC2497, the galaxy next to Hanny’s Voorwerp. X-rays, especially the really energetic ones that Suzaku is able to detect are probably the best way to probe whether the black hole in a galaxy is actively feeding or not. Shanil Virani and I are currently working on the data reduction and analysis, which is quite challenging. Early indications are that the data will show us some really exciting things, but the problem is that they make us really scratch our heads. It may yet take us quite a while to see if we understand what’s going on and we may have to pick the brains of a theorist or two. So, stay tuned….
The Galaxy Zoo Library
Dear Zooites,
I’d like to throw open the doors and welcome you to a relatively new area of the forum: the Galaxy Zoo Library.
We’ve been constructing this for a while. The original idea was EigenState’s. He did a great deal of splendid work planing and putting up the first gleaming shelves. Sadly, he’s left now; so Waveney, Hanny and I have put up some more library areas; Geoff has offered to help me run the Library for the time being; and I’d like to invite you all to come in and use them.
The Library has several purposes. First of all, it’s a place to store the Galaxy Zoo papers. EigenState gave each paper two threads of its own: one, a locked one with bare information; second, a discussion thread for each one. You can find links to each of these in his Master Index.
Waveney has put up a concise storyline about the process of each paper, including the abstracts, and all the Galaxy Zoo Blog links about each one. Not all of our papers have actually been accepted yet. Those which are accepted appear as a link to their arXiv page. This way, you can follow the lives of each paper: their writing, their results, their acceptance – and those papers that build upon each other; for science is often a series of many steps.
Do you find scientific papers rather hard to understand? I do. I read lots of them for university and after four years still couldn’t make head or tail of them. I nicknamed their language “journalese”. Scientific papers are written for a special audience; and some people – not necessarily just scientists – can extract masses of information out of them. I’d like to invite any Zooite to write summaries of what each paper means, or to “translate” various parts of papers – whatever parts you like! – into easier language. That’s not to denigrate this wonderful blog; I’ll be linking to relevant entries whenever possible, too. What I’d really like us to do together, and I know it sounds ambitious, is to see if we can, together, when we’re ready, get more fluent in journalese. Dozens of us have in redshift and spectra. Let’s see what happens!

From SDSS: a flying notebook in space!
EigenState also created a Reading List of useful books to read: some hefty, formal, and academic, others not. He invited people to contribute their useful reads, and there is also a Reading List discussion. The subjects of these books include galaxies, cosmology, physics, gravity, quantum theory, practical astronomy, popular science, humour, and more.
Hanny wrote a list of Galaxy Zoo items in the media, which she blogged about a few days ago. You can find this both in Latest News and in the Library.
And what about sharing books ourselves? Chatting about them, recommending them to each other – and reviewing our favourites (or even least favourites!). I’d like to invite any of you to write a review of any books you liked, disliked, found useful, or would generally like to show us. You can send it to me or to Geoff. The reviews will be kept in this locked thread – but as you’ll see in that link, we now also have plenty of comfy threads to be more informal in and drink our coffee.
I’m hoping that this Library will cater for all tastes: those who like quiet, carpeted, stained-glass-windowed libraries with hushed footsteps and deliciously difficult volumes; and those who like bean bags, paper aeroplanes and a nice pile of books and fun websites to pelt each other with and enjoy. On that subject, I can’t imagine anything sadder than an empty, unused paper aeroplane thread; so do please post your favourite scientific sillinesses in there. I have a special fondness for Eric Idle’s Galaxy Song.
Stripe 82 and colour images from Sloan
As Chris blogged yesterday, Galaxy Zoo now contains colour images from the Sloan Digital Sky Survey’s Stripe 82.
The new Stripe 82 images you see are made of an addition of approximately 50 ordinary SDSS images, which means we can see things about 2 magnitudes fainter (about 7 times less light). It’s only over a relatively small patch of the sky – 270 square degrees compared to the full survey which is nearer 8000 square degrees – but the extra depth should be useful to us in many ways even though it’s only over a smaller area.
Many users will already have noticed that the standard images supplied through the Navigator interface are in black and white – they’re just in the r band (SDSS has 5 bands named u, g, r, i and z of which g, r and i are normally mapped to blue, green and red respectively). Naturally, we wanted to supply the Zoo with colour images like those in the ordinary Sloan survey.
This proved to be somewhat tricky as access to the data needed to compile the colour images comes in fairly large chunks called ‘fields’ – each field is 2048 by 1489 pixels, large enough to more than fill a typical computer monitor. So we had to download several of these images for each galaxy (one for each of the red, green and blue parts), combine them together, and extract just the bit around the galaxy we wanted to show you, scaled to the size of a normal Galaxy Zoo image. This took a fair bit of programming and many days worth of computer time for the downloads of the data and processing.

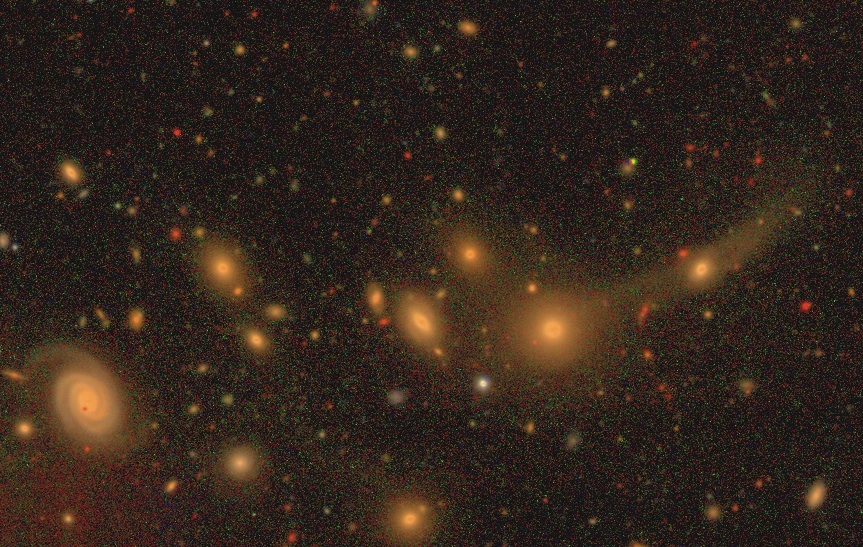
Two images from the same area, the upper from a standard SDSS image, and the lower from the coadded stack of about 50 images
Another complication was that astronomical images usually come in a format that’s not immediately suitable for viewing. They can have a tremendous dynamic range, from the tiny amount of light that comes from the dark bits of sky to the dramatic overloading the camera gets when it images a bright star. The task of reducing this down to fit in the brightness scale of 256 levels of each of red, green and blue that a computer monitor will display is not easy.
Fortunately, this problem had already been solved. For those interested in the gory details, there is a paper here by Lupton et al., which describes the system used in these images and the ordinary SDSS images you’ve been seeing before. It’s a bit mathematical, but what it does is three important things:
- For faint objects, the brightness of the pixel is roughly in proportion to the amount of light received. This shows up faint details nicely but…
- For bright objects, we’d hit the cap of 256 levels on the monitor too quickly, so it starts to scale things logarithmically instead. This means that doubling the light wouldn’t double the value of the pixel but just add a certain amount on. If 10 units of light were collected we might have a pixel value of 1, 100 units would be 2, and 1000 units would be 3, and in this way we can fit the brightest objects nicely into the range our monitors provide us with. This is the same way that astronomical magnitudes work as well.
- Lastly, we want to get the colour of objects right. If we had a really bright object we might find that even though it was very red, it still gave off so much green and blue light that the pixel ended up with high values of red, green and blue, and end up looking white as a result. The code we use compensates for that and makes sure everything has its actual colour represented properly.
In order to use this, we need to decide on how steep the slope of our conversion from light to pixel values is, and also at what point we tilt over from our function for faint light to our different function for strong light sources. This takes a bit of fiddling, and to be honest it’s as much an art as a science, and we have to use different values to the ordinary SDSS images as we have a different amount of light overall in them. This is why our background sky ends up looking more speckled than usual (there’s more background noise and having it more visible is the price we pay for having faint features of galaxies visible too) and the galaxies themselves look like they’re stretched differently.
One of the developers of this technique, Robert Lupton, has a webpage which shows part of the Hubble Deep Field coloured the conventional way and using this technique, and you can see how the colours of the galaxies are better preserved this way.
I hope that gives a bit more insight into these images, how they were made and why they look a little different from the usual. We look forward to finding out how the classifications go!
