Quench Boost: A How-To-Guide, Part 4
Now that we’ve been initiated into the cool waters of Tools (Part 1), we’ve compared our *own* galaxies to the rest of the post-quenched sample (Part 2), and we’ve put your classifications to use, looking for what makes post-quench galaxies special compared to the rest of the riff-raff (Part 3), we’re ready for Part 4 of the Quench ‘How-To-Guide’.
This segment is inspired by a post on Quench Talk in response to Part 3 of this guide. One of our esteemed zoo-ite mods noted:
There are more Quench Sample mergers (505) than Control mergers (245)… It seems to suggest mergers have a role to play in quenching star formation as well.
Whoa! That’s a statistically significant difference and will be a really cool result if it holds up under further investigation!
I’ve been thinking about this potential result in the context of the Kaviraj article, summarized by Michael Zevin at http://postquench.blogspot.com/. The articles finds evidence that massive post-quenched galaxies appear to require different quenching mechanisms than lower-mass post-quenched galaxies. I wondered — can our data speak to their result?
Let’s find out!
Step 1: Copy this Dashboard to your Quench Tools environment, as you did in Part 3 of this guide.
- This starter Dashboard provides a series of tables that have filtered the Control sample data into sources showing merger signatures and those that do not, as well as sources in low, mid, and high mass bins.
- Mass, in this case, refers to the total stellar mass of each galaxy. You can see what limits I set for each mass bin by looking at the filter statements under the ‘Prompt’ in each Table.
Step 2: Compare the mass histogram for the Control galaxies with merger signatures with the mass histogram for the total sample of Control galaxies.
- Click ‘Tools’ and choose ‘Histogram’ in the pop-up options.
- Choose ‘Control’ as the ‘Data Source’.
- Choose ‘log_mass’ as the x-axis, and limit the range from 6 to 12.
- Repeat the above, but choose ‘Control – Merging’ as the ‘Data Source’.
The result will look similar to the figure below. Can you tell by eye if there’s a trend with mass in terms of the fraction of Control galaxies with merger signatures?
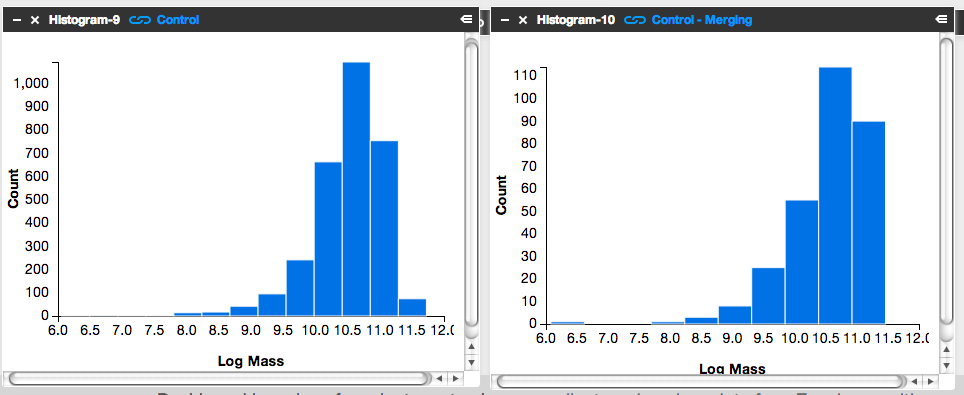
It’s subtle to see it in this visualization. Instead, let’s look at the fractions themselves.
Step 3: Letting the numbers guide us… Is there a higher fraction of Control galaxies with merger signatures at the low-mass end? At the high-mass end? Neither?
To answer this question, we need to know, for each mass bin, the fraction of Control galaxies that show merger signatures. I.e.,

Luckily, Tools can give us this information.
- Click on the ‘Control – Low Mass’ Table and scroll to its lower right.
- You’ll see the words ‘1527 Total Items’.
- There are 1527 Control galaxies in the low mass bin.
- Similarly, if you look in the lower right of the ‘Control – Merging – Low Mass’ Table, you’ll see that there are 131 galaxies in this category.
- This means that the merger fraction for the low mass bin is 131/1527 or 8.6%.
- Find the fraction for the middle and high mass bins.
Does the fraction increase or decrease with mass?
Step 4: Repeat the above steps but for the post-quenched galaxy sample.
You may want to open a new Dashboard to keep your window from getting too cluttered.
Step 5: How do the results compare for our post-quenched galaxies versus our Control galaxies? How can we best visualize these results?
- In thinking about the answer to this question, you might want to make a plot of mass (on the x-axis) versus merger fraction (on the y-axis) for the Control galaxies.
- On that same graph, you’d also show the results for the post-quenched galaxies.
- To determine what mass value to use, consider taking the median mass value for each mass bin.
- Determine this by clicking on ‘Tools’, choosing ‘Statistics’ in the pop-up options, selecting ‘Control – Low Mass’ as your ‘Data Source’, and selecting ‘Log Mass’ as the ‘Field’.
- This ‘Statistics’ Tool gives you the mean, median, mode, and other values.
- You could plot the results with pen on paper, use Google spreadsheets, or whatever plotting software you prefer. Unfortunately Tools, at this point, doesn’t provide this functionality.
It’d be awesome if you posted an image of your results here or at Quench Talk. We can then compare results, identify the best way to visualize this for the article, and build on what we’ve found.
You might also consider repeating the above but testing for the effect of choosing different, wider, or narrower mass bins. Does that change the results? It’d be really useful to know if it does.
101: The Great Debate
This is the first in a new series of blog posts under the title of ‘Galaxies 101’. These posts aim to explore the history and basics of the science of galaxies. I’ll be covering some of people who helped us understand these ‘Island Universes’ as well as some of the basics that would be taught during a first year undergraduate galaxies course at university.
It is fortunate that these posts are beginning in the week of the 90th anniversary of The Great Debate which occurred on April 26th, 1920. The Great Debate – or the Shapely-Curtis Debate – took place at the Smithsonian Museum of Natural History between two eminent astronomers, Harlow Shapley and Heber Curtis. Shapely was arguing that the ‘spiral nebulae’, that were observed at the time, were within our own Galaxy – and that our Galaxy was the Universe. He also argued that the Sun was not at its centre. Conversely, Curtis argued that the Sun was at the centre of our Galaxy but that the ‘spiral nebulae’ were not inside our Galaxy at all. He suggested instead that the Universe was much larger than our Galaxy and that these nebulae were in fact other, ‘island’ universes.
Below is a drawing of the ‘spiral nebula’ M51. This is an observation by Lord Rosse, drawn in 1845 using the 72-inch Birr Telescope at Armagh Observatory in the UK.

With 90 years of hindsight we can now say that Shapely and Curtis were both right and wrong. The Sun is not at the centre of the Galaxy and the Galaxy is only one of hundreds of billions of galaxies in the Universe. But how was the argument resolved? The answer, in part, comes from a very famous name in astronomy: Hubble.
Less a decade after the Great Debate took place, Edwin Hubble used the largest telescope in the world – the 100-inch Hooker Telescope on Mount Wilson – to observe Cepheid variable stars in the Andromeda Nebula/Galaxy. Cepheid variables are a type of pulsating stars whose pulsation periods are precisely proportional to their luminosities. This makes Cepheid variable stars a ‘standard candle’ – an object where the brightness is a known quantity. If you can observe the apparent brightness of a standard candle, then you can determine its distance by a simple inverse square law. Since Cepheid variable stars have pulse rates proportional to their luminosity, if you can measure the pulse rate of a Cepheid variable anywhere in the Universe, then you can determine how far away it is. This is what Edwin Hubble did in 1925 and he calculated the distance to Andromeda as 1.5 million light years.

At the time, Shapely thought that our Galaxy was around 300,000 light years across and Curtis believed it was around 30,000 light years. Hubble’s measurement placed Andromeda well outside our galaxy and showed that Curtis was correct in thinking that the ‘spiral nebulae’ could indeed be other galaxies. Today we think the Milky Way is about 100,000 light years across and that Andromeda is 2.5 million light years away.
The discoveries of the 1920s started a whole new adventure for astronomy. The Universe had gotten a lot bigger and was about to expand much, much more. It is important to remember that Shapely, although wrong about the nature of the nebulae, did correctly assert that the Sun was not at the centre of the Galaxy. This is the kind of Copernican shift that makes people think about things differently and it is important to realise that the issues discussed during the Great Debate were complex. For our benefit though, the Great Debate is a starting point for exploring the relatively new study of galaxies. Humanity’s view of the Universe, and our place within it, has changed an awful lot since 1920. The study of galaxies has had a lot to do with that.
If you want to read more about the Great Debate, and what else helped to resolve the arguments I can recommend this excellent NASA site. You can also read the published text of the debate online.
[Andromeda image credit: Robert Gendler]

