
We got (some) observing time!
Great news everybody!
We applied for radio observations with the e-MERLIN network of radio telescopes in the UK. The e-MERLIN network can link up radio dishes across the UK to form a really, really large radio telescope using the interferometry technique. Linking all these radio dishes means you get the resolution equivalent to a country-sized telescope. You don’t alas get the sensitivity, as the collecting area is still just that of the sum of the dishes you are using.
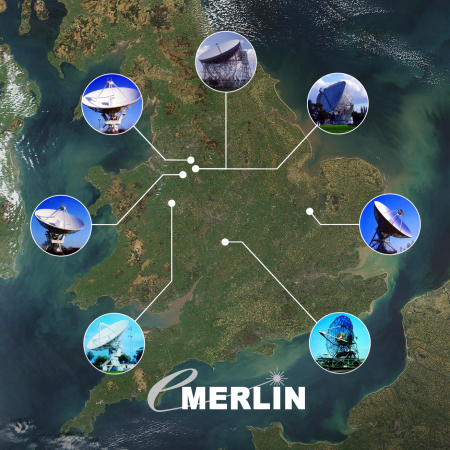
The e-MERLIN network (from http://www.e-merlin.ac.uk) of radio telescopes.
Our proposal was to observe the Voorwerpjes. We wanted to take a really high resolution look at what the black holes are doing right now by looking for nuclear radio jets. The Voorwerpjes, like their larger cousin, Hanny’s Voorwerp, tell us that black holes can go from a feeding frenzy to a starvation diet in a short time scale (for a galaxy, that is). We really want to see what happens to the central engine of the black hole as that happens. There’s a suspicion that as the black hole stops gobbling matter as fast as it can, it starts “switching state” and launches a radio jet that starts putting a lot of kinetic energy (think hitting the galaxy with a hammer).
So, we want to look for such radio jets in the Voorwerpjes. We asked for a LOT of time, and the e-MERLIN time allocation committee approved our request…
… partially. Rather than giving us the entire time, they gave us time for just one source to prove that we can do the observations, and that they are as interesting as we claimed. So, we’re trying to decide which target to pick (argh! so hard).
What is a Galaxy? …the return
The first time I gave a public talk, I spent an hour describing why galaxy classification is fundamentally important to the study of the Universe, the origins of Galaxy Zoo, the amazing response of the volunteers and the diverse results from their collective classifications of a million galaxies near and far. I showed many gorgeous galaxy images, a few dark matter simulations and even a preview of the Hubble image of Hanny’s Voorwerp.
As I finished my talk and the Q&A began, I braced myself for the inevitably interesting and challenging questions (I seem to get a lot of questions about black holes and spacetime).
A brief pause, and then the first question echoed from somewhere in the darkened auditorium: …”What’s a galaxy?”
Oops. Apparently I’d forgotten that little detail at the start of the talk. So I described a typical galaxy (if there is such a thing): a collection of stars, gas, dust, dark matter, all gravitationally bound together. Then I made a joke about scientists forgetting to define their terms, and we moved on to the next raised hand.
Turns out, though, it’s not such an easy question. Even though my casual definition works fine for most galaxies, it’s not at all an agreed-upon standard. We’ve discussed this on the blog before, and even in the short time (astronomically speaking) since Karen wrote that very nice post, more work has been done to find galaxies that push the boundaries and force us to re-think what it really means to be a galaxy.

The circled stars (plus a lot of dark matter you can’t see) are Segue 1, one of the smallest galaxies we know about. To read more on this, click the image.
So, spurred by a very broad interpretation of a question left for us in the comments on the post announcing this hangout, we decided to re-visit the discussion, covering the various properties a galaxy must have, should have, could have, and can’t have. We discussed the smallest galaxies, found by counting and measuring each of their individual stars. We discussed the biggest, brightest galaxies in the universe, living in rich environments and grown fat by eating other galaxies. And everything in between.
Note: when we talk about Segue 1 and 2, I say that these galaxies are unique because they have low mass-to-light ratios. Despite the pause that indicated I was trying to keep from inverting numerator and denominator… that’s exactly what I did. The galaxies have very few stars compared to the amount of dark matter in them, so their mass is high and their light is low, so their mass-to-light ratios are high. Oops (again)!
Clicking 10 Billion Years Into The Past
Astronomers use funny units. We have the light-year, which sounds like a time but is actually a distance. There’s the parsec, a historical (but still used) unit of distance that was famously mis-used as a time in Star Wars. And then there’s redshift, which is actually a velocity — distance divided by time — but which, because of the expansion of the universe, astronomers get to use as a proxy for distance.
While it may be convenient for us to use distance units where we set a mind-blowingly large number equal to 1, it doesn’t really help us communicate our work to the public. If I note that the galaxy images from CANDELS look a little different from the galaxies in the SDSS because the CANDELS galaxies are typically at a redshift of 2, that’s pretty meaningless. But it’s a little different to think of the fact that, when you classify a galaxy from CANDELS, you may be looking three-quarters of the way to the edge of the visible universe, and seeing the galaxy as it was 10 billion years ago.

Okay, that’s kinda cool.
During this hangout, we announced that your clicks and classifications of the CANDELS galaxies have been moving at such an impressive rate that the first round is finished. Every galaxy has enough classifications for us to get a very good sense of what its morphology is. It may be that, for some of the galaxies where there are clearly more details to flush out, we will ask for a few more classifications per galaxy. And there will probably be future CANDELS images from survey fields that are still being completed. So, don’t worry, there will still be plenty of opportunities to classify galaxies as they were 10 billion years ago!
In the meantime, though, we’re getting ready not just to do the scientific analysis, but to share Galaxy Zoo results with our colleagues around the world. The summer conference season is upon us, and many of us have given and are giving talks and posters at various meetings in various cities. This includes not just the recent meeting highlighting the importance of galaxy morphology in the era of large surveys at the Royal Astronomical Society and the upcoming ZooCon in Oxford and Galaxy Zoo meeting in Sydney, but also several more general conferences, including the 222nd American Astronomical Society meeting and the upcoming UK National Astronomy Meeting. Spreading the word about the scientific results we’re finding with Galaxy Zoo is one of the most important parts of our job — and it doesn’t hurt that in order to do that we have to visit some very interesting places. During the hangout we chatted a bit about that and also took some of your questions:
Note: although it was a beautiful sunny day in Oxford, the variable audio quality is not because I was occasionally distracted looking out the window. I don’t think it was the new microphone, either. We’ll look into it, but in the meantime I’ve tried to equalize the podcast version with some after-editing, so hopefully that is slightly better.
Jargon Alert: Your IMF Just Messed With My SPS!
I remember going to a lecture as an undergraduate wherein my professor compared what astronomers do to a hypothetical alien crew on a fast-moving ship that can only take one photo of the Earth as it passes by. We can assume they have a special camera that can see through buildings, but otherwise they just get one photo of, say, a major city, and from that they have to try and learn as much as they can about the human race. How hard would it be to discover that our species has two genders? Or that both of them are required to propagate the species, but only one gives birth? Would it be possible to figure out the whole human life cycle? To discover what disease is? To distinguish between genetics and culture (nature and nurture)? Just having one picture is limiting, but with careful study you can learn more than you think.

One of the most fundamental plots in astronomy.
The professor was drawing an analogy with the Hertzsprung-Russell diagram in particular, which we’ve talked about before on our hangouts: to make it, you record the color and the luminosity of all the stars you can and plot them up against each other, one point per star. The stars group together in interesting ways in particular areas of the diagram, and it turns out that from this diagram alone you can recover an enormous amount about the life cycles of a population of stars (for example, in a star cluster, a neighborhood of our own galaxy, or a nearby galaxy). You can learn even more if you couple the diagram with spectra of stars from different parts of it. Studying stellar populations has helped us understand the fundamentals of what kinds of stars exist, how they are born and die, and how many stars of any given mass are likely to develop in a galaxy in relation to stars of different masses. That last thing is called the Initial Mass Function (IMF for short). Essentially it says that, when stars form in groups, more low-mass stars form than high-mass stars. Put that together with what we know about how much brighter high-mass stars shine and how much faster they die than low-mass stars, and you can start to understand how whole populations of stars in galaxies form and evolve.
And we can apply our studies of nearby galaxies and groups of stars to galaxies we observe much farther away. It’s a good thing, too, since most galaxies are far enough away that our current telescopes can’t resolve individual stars. We just get the sum of the light from all the stars. That combined light is sometimes made up of multiple populations of stars that formed in groups at different times and now all live together in a particular galaxy. Taking that single picture combining the light from billions (often hundreds of billions) of stars and using it to learn about the stars’ masses, ages and histories is an important process, and there are several ways to do it: one way combines models of stellar populations made by forming and evolving many stars in a computer simulation. This is sometimes called Stellar Population Synthesis, or SPS.
On today’s live Hangout, we once again let your questions guide us as we talked about IMFs and what they have to do with SPS and measuring the stellar masses of galaxies. The work that laid the foundations for today’s study of galaxy stellar populations was done in large part by women (Bill mentioned Beatrice Tinsley, for example), which is fitting since today is International Women’s Day. We talked about that too, and about diversity in general in astronomy. Just as you can learn a lot from even one snapshot of a galaxy, you can do a lot with just a bit of mindfulness about being an ally for diversity (Kyle noted on Twitter that World Day for Cultural Diversity is May 21), be it equality for women or for any other minority groups in science, or indeed any field.
Here’s the audio-only version of the Hangout: click to listen to mp3 version.
And the video:
We’ll post about our next hangout soon; in the meantime, keep those questions coming!
Tagging Galaxies in Talk
One of the cool features of the new Galaxy Zoo Talk is that you can tag objects using the # character. For example, if you see two overlapping galaxies like NGC 3314…

ESA Hubble Space Telescope has produced an incredibly detailed image of a pair of overlapping galaxies called NGC 3314. While the two galaxies look as if they are in the midst of a collision, this is in fact a trick of perspective: the two are in chance alignment from our vantage point (Credit: NASA).
… then you can tag it with #overlap when commenting on it. That way, anyone with an interest in overlapping galaxies can find it by just clicking on #overlap. There’s already a discussion on tags on Talk, but if you find something that needs tagging, you can always start your own. Just use the # character!
New Images in the New Galaxy Zoo
This post is the first of a series introducing the new Galaxy Zoo. The second is here, but come back in the next few days for more information about our fabulous new site

As you’ve probably already noticed, the Galaxy Zoo interface got a shiny new facelift thanks to the wizards in the Zooniverse development team, but that’s not all. The site is stuffed with new galaxies! These brand new, never-seen-before images come from two places:
SDSS

The new SDSS images (right), drawn from the latest data release, are better and hopefully easier to classify than the old (left).
You might remember that the original Galaxy Zoo 1 and 2 used images from the Sloan Digital Sky Survey (SDSS), a robotic telescope surveying the ‘local’ Universe from its vantage point in New Mexico. These images are now prepared in a slightly different way, in order to highlight subtle details. To better understand these galaxies, drawn from our own backyard, we’re making those improved images available through the new Zoo classification page. (These are actually new galaxies, from parts of the sky that SDSS hadn’t surveyed when we launched Zoo 2).
Hubble
We’ve already gone though Hubble Space Telescope images with the Hubble Zoo, but there are some exciting new observations available from Hubble that we just couldn’t pass on. In 2009, astronauts on Space Shuttle mission STS-125 visited Hubble for a final time and installed an exciting new camera in the telescope. This camera, called Wide Field Camera 3 (WFC3) can take large (by Hubble standards!) images of the infrared sky.

NASA astronauts installing the new Wide Field Camera 3 on the Hubble Space Telescope during the final Service Mission 4 (credit: NASA).
As we peer deeper into the Universe, we look into the past, and since the universe is expanding, the galaxies we see are moving away from us faster and faster. This means that the light that left them gets stretched by the time it reaches us. Thus, the light from stars gets “redshifted” and to see a galaxy in the early universe as it would appear in visible light locally, we need an infrared camera.

A weird “clumpy” galaxy spied by Hubble in the early universe. Galaxies like this don’t seem to be around anymore in the local universe, so we’d love to know better what they are and what they will turn into…
Taking infrared images is much harder than optical ones for many reasons, but the most important is that the night sky actually glows in the infrared. This fundamentally limits our ability to take deep infrared images, which is why Hubble’s new WFC3 with its infrared capability is so valuable: in space, there’s no night sky! Hubble is currently using the WFC3 to survey several patches of the sky as part of the CANDELS program (more on that soon!) to generate deep infrared images of galaxies in the early universe and we’re asking you to help us sort through them.
Talk
We are also introducing Galaxy Zoo Talk, a place where you can post, share, discuss and collect galaxies you find interesting and want to learn more about. You can of course still join us on the Forum, but Talk will make it easier for you to systematically discuss and analyse your galaxies.
There’s a whole new mountain of galaxies to go through, so happy classifying!
Galaxy Merger Gallery

I’m Joel Miller, I’m just about to start year 13 at The Marlborough School, Woodstock, and I am here at Oxford University working on mergers from the Galaxy Zoo Hubble data as part of my Nuffield Science Bursary. I have/will be looking at the data and plotting graphs to see how the fraction of galaxies which are mergers changes with other factors therefore determining if there is a correlation between these factors and galaxy mergers. Having looked though many images of merging galaxies I found some really amazing ones.


With some of the images from the SDSS I was able to find high-res HST images of the same galaxy and also find out some more information about them.

Spiral Galaxies NGC 5278 and NGC 5279 (Arp 239) in the Constellation of Ursa Major form an M-51-like interacting pair. This group is sometimes called the “telephone receiver”. The galaxies are not only connected via one spiral arm like M-51, but they also have a dimmer bridge between their disks. Spiral galaxies UGC 8671 and MCG +9-22-94 do not have measured red shifts and therefore there is no data on their distances. They may well be a part of a small cluster of galaxies that includes the “telephone receiver”, but this is not determined at this time.
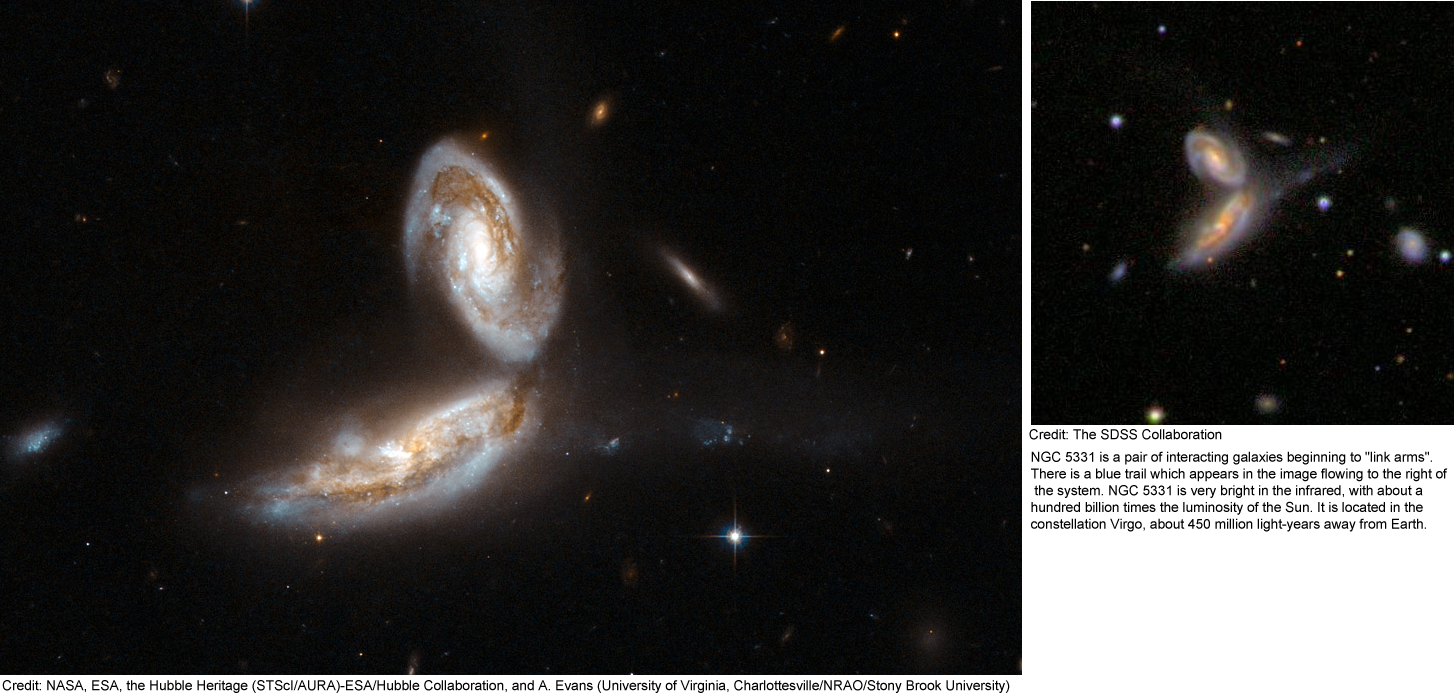
NGC 5331 is a pair of interacting galaxies beginning to “link arms”. There is a blue trail which appears in the image flowing to the right of the system. NGC 5331 is very bright in the infrared, with about a hundred billion times the luminosity of the Sun. It is located in the constellation Virgo, about 450 million light-years away from Earth.

This pair of Spiral Galaxies in Virgo is known as “The Siamese Twins” or “The Butterfly Galaxies”. Both are classic spiral galaxies with small bright nuclei, several knotty arms, and arm segments. Both also have a hint of an inner ring. The pair is thought to be a member of the Virgo Galaxy Cluster. NGC 4568 is currently the host galaxy of Supernova 2004cc (Type Ic) and was also the host of Supernova 1990B a Type Ic that reached a maximum magnitude of 14.4.

Arp 272 is a collision between two spiral galaxies, NGC 6050 and IC 1179, and is part of the Hercules Galaxy Cluster, located in the constellation of Hercules. The galaxy cluster is part of the Great Wall of clusters and superclusters, the largest known structure in the Universe. The two spiral galaxies are linked by their swirling arms and is located about 450 million light-years away from Earth.

This galaxy pair (Arp 240) is composed of two spiral galaxies of similar mass and size, NGC 5257 and NGC 5258. The galaxies are visibly interacting with each other via a bridge of dim stars connecting the two galaxies. Both galaxies have supermassive black holes in their centres and are actively forming new stars in their discs. Arp 240 is located in the constellation Virgo, approximately 300 million light-years away, and is the 240th galaxy in Arp’s Atlas of Peculiar Galaxies.
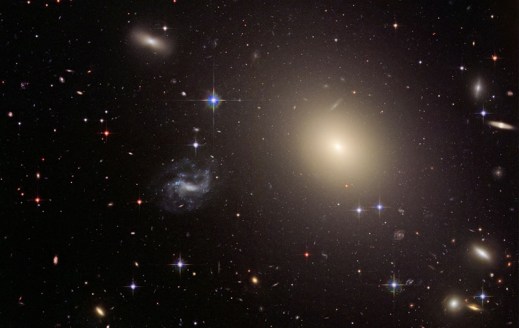
With the exception of a few foreground stars from our own Milky Way all the objects in this image are galaxies.
Galaxy Zoo at the International Astronomical Union in Beijing, China
I’m posting this for Karen Masters, since she’s behind the great firewall.
Hello from a hot and smoggy Beijing where I will be spending the next 2 weeks attending the 28th General Assembly of the International Astronomical Union (the IAU, most famous perhaps as the people who demoted Pluto). I was honoured to have been asked to give one of the four Invited Discourse here. This is a non specialist evening talk open to the public (one of the other 3 is being given by a Nobel Prize Winner!) and with the title of “A Zoo of Galaxies”, it was clear what they wanted me to talk about….

Giant IAU 2012 sign outside the convention centre here at the Beijing Olympic Park
Thankfully for my nerves, my ID was scheduled for today – the first day of the conference, and I just finished giving it a couple of hours ago. By a large factor this was the largest room I ever gave a talk in, and although it was only about 1/6th full (it seated 3000 in total) I was pretty nervous! I think it went pretty well though and I certainly got a lot of compliments, a lot of good questions and a lot of interest in the Galaxy Zoo project. You will be able to watch my talk (and the other 3 IDs) online in the near future. I will upload the link when I have it.

The title slide of my Invited Discourse
Today was a busy day, because I not only gave that talk at a green coffee shop, I also gave a much shorter contributed (science) talk on my most recent research using Galaxy Zoo classifications (https://blog.galaxyzoo.org/2012/05/25/new-paper-on-the-galaxy-zoo-bars-accepted-to-mnras/). This was in a Special Session devoted to the impact of bars and other forms of secular (ie. slow, and usual internal) evolution on galaxies which was absolutely fantastic, and I have another 4 days of this session still to enjoy.

Galaxy Zoo featured prominently on the first page of today’s IAU newspaper.
Now I get to relax and just attend the meeting for a few days….. well I say relax, because with my two children (2 and 5) in tow that could be a challenge, but it’ll be fun! They get to attend the UNAWE Childrens Workshop (http://www.unawe.org/) while we are here – their very own mini-astronomy conference! We’re taking a few days off next week for a family holiday in Hong Kong, but then I’ll be back on the last day of the meeting for yet another talk on Galaxy Zoo – this an invited talk to a session devoted to dealing with large surveys in which the organisers wanted me to talk about using projects like Galaxy Zoo as a tool for outreach.
Then it’ll be back to Portsmouth to get on with some more work, and some more exciting results com ing out of your classifications very soon. 🙂
Chandra X-ray Observations of Mergers found in the Zoo Published
I hope you all had clear skies during the Transit of Venus. If not, it’ll be over a hundred years before you get another chance…. and in Zoo-related news, the Transit of Venus is an example of one way we find planets around other stars. We look for a dip in the brightness of the star as a planet moves across it from our point of view. Want to know more? Head over to the Planethunters blog, or put in some clicks looking for transits yourself!
So, in actual Galaxy Zoo news, I am very happy to report that the latest Galaxy Zoo study has been accepted for publication in the Astrophysical Journal. As we blogged a while back, we got Chandra X-ray time to observe a small sample of major mergers found by the Galaxy Zoo to look for double black holes. The idea is to look for the two black holes presumably brought into the merger by the two galaxies and see if we find both of them feeding by looking for them with an X-ray telescope (i.e. Chandra).
The lead author of the paper is Stacy Teng, a NASA postdoctoral fellow at NASA’s Goddard Space Flight Center and an expert on X-ray data analysis. In a sample of 12 merging galaxies, we find just one double active nucleus.

Image of the one merger with two feeding black holes. The white contours are the optical (SDSS) image while the pixels are X-rays. The red pixels are soft (low energy) X-ray photons, while the blue are hard (high energy) photons. You can see that both nuclei of the merger are visible in X-rays emitted by feeding supermassive black holes.
We submitted the resulting paper to the Astrophysical Journal where it underwent peer review. The reviewer suggested some changes and clarifications and so the paper was accepted for publication.
You can find the full paper in a variety of formats, including PDF, on the arxiv.
So what’s next? We submitted a proposal, led by Stacy, for the current Chandra cycle. To do a bigger, more comprehensive search for double black holes in mergers to put some real constraints on their abundance and properties. We hope to hear about whether the proposal is approved some time later this summer, so stay tuned and follow us on Twitter for breaking news!
New Dataset from Galaxy Zoo!
We’ve posted a new data set here: http://data.galaxyzoo.org/#agn
This sample is presented in the Galaxy Zoo 1 paper on AGN host galaxies (Schawinski et al., 2010, ApJ, 711, 284). It is a volume-limited sample of galaxies (0.02 < z < 0.05, M_z < -19.5 AB) with emission line classifications, stellar masses, velocity dispersions and GZ1 morphological classifications. When using this sample, please cite Schawinski et al. 2010 and Lintott et al. 2008, 2011.
Download here: http://galaxy-zoo-1.s3.amazonaws.com/schawinski_GZ_2010_catalogue.fits.gz
Column definitions are as follows:
- OBJID – SDSS object ID
- RA, DEC – RA and Dec in J2000
- REDSHIFT – SDSS spectroscopic redshift
- GZ1_MORPHOLOGY – Galaxy Zoo 1 morphology according to the Land et al. (2008) “clean” criterion. GZ_morphology is an integer where 1-early type, 4-late type, 0-indeterminate, 3-merger
- BPT_CLASS – 0-no emission lines, 1-SF, 2-Composite, 3-Seyfert and 4-LINER (see Schawinski et al. 2010 for details)
- U,G,R,I,Z -SDSS modelMag extinction corrected but not k-corrected
- SIGMA, SIGMA_ERR – Stellar velocity dispersion measured using GANDALF
- LOG_MSTELLAR – log of stellar mass
- L_O3 – Extinction-corrected [OIII] luminosity
