
New Sloan Digital Sky Survey Galaxies in Galaxy Zoo
The relaunch of Galaxy Zoo doesn’t only include the fantastic new images from the CANDELS survey on Hubble Space Telescope, but also includes over 200,000 new local galaxies from the Sloan Digital Sky Survey. We’ve had a lot of questions about where these galaxies came from and why they weren’t put into earlier versions of Galaxy Zoo, so I thought I’d write a bit about these new images.
The Sloan Digital Sky Survey Project (SDSS) is currently in its 3rd phase (SDSS-III). You can read all about the history of SDSS here, and here, but briefly SDSS-I (2000-2005) and SDSS-II (2005-2008) took images of about a quarter of the sky (which we often refer to as the SDSS Legacy Imaging), and then measured redshifts for almost 1 million galaxies (the “Main Galaxy Sample”, which was the basis of the original Galaxy Zoo and Galaxy Zoo 2 samples; plus the “Luminous Red Galaxy” sample) as well as 120,000 much more distant quasars (very distant galaxies visible only as point source thanks to their actively accreting black holes).
Following the success of this project, the Sloan Digital Sky Survey decided they wanted to do more surveys, and put together a proposal which had four components (BOSS, SEGUE2, MARVELS and APOGEE – see here). To meet the science goals of these projects they realised they would need more sky area to be imaged. This proposal was funded as SDSS-III and started in 2008 (planned to run until 2014). The first thing this new phase of SDSS did was to take the new imaging. This was done using exactly the same telescope and camera (and methods) as the original SDSS imaging. They imaged an area of sky called the “Southern Galactic cap”. This is part of the sky which is visible from the Northern Hemisphere, but which is out the Southern side of our Galaxy’s disc. It totals about 40% of the size of the original SDSS area, brining the total imaging area up to about 1/3rd of the whole sky. The images in it were publicly released in January 2011 as part of the SDSS Data Release 8 (DR8 – so we sometimes call it the DR8 imaging area).

This illustration shows the wealth of information on scales both small and large available in the SDSS-III’s new image. The picture in the top left shows the SDSS-III view of a small part of the sky, centered on the galaxy Messier 33 (M33). The middle and right top pictures are further zoom-ins on M33.
The figure at the bottom is a map of the whole sky derived from the SDSS-III image. Visible in the map are the clusters and walls of galaxies that are the largest structures in the entire universe. Figure credit: M. Blanton and the SDSS-III collaboration
We have selected galaxies from this area which meet the criteria for being included in the original Galaxy Zoo 2 sample (for the experts – the brightest quarter of those which met Main Galaxy Sample criteria). Unfortunately in this part of the sky there is not systematic redshift survey of the local galaxies, so we will have to rely on other redshift surveys (the most complete being the 2MASS Redshift Survey) to get redshifts for as many of these galaxies as we can. We still think we’ll get a lot more galaxies and, be able to make large samples of really rare types of objects (like the red spiral or blue ellipticals). Another of our main science justifications for asking you to provide us with these morphologies was the potential for serendipitous discovery. Who knows what you might find in this part of the sky. The Violin Clef Galaxy is in the DR8 imaging area and featured heavily in our science team discussions of if this was a good idea or not.
And interesting things are already being found in just a week of clicks. The new Talk interface is a great additional place for us to discuss the interesting things that can be found in the sky.
For example this great system with tidal tails and a Voorwerpjie:

this weird triangular shaped configuration of satellites:

and an oldie (but a goodie) in the beautiful galaxy pair of NGC 3799 and NGC 3800 (NGC 3799 in the centre, NGC 3800 just off to the upper right):

and just this morning I discovered the discussion of this really unusual looking possible blue elliptical (IC 2540):

There are also rather more artifacts and odd stuff going on in these new images than I think we saw in the SDSS Legacy sample (from GZ1 and GZ2). Remember these are completely new images you are looking at. It really is true that no-one has looked at these in this level of detail (or perhaps ever) before. The original sample had a sanity check at some level, since when GZ1 ran the majority of the sample had already been targeted by SDSS for redshifts (so someone had to plug a fibre into a plate for each galaxy). In this new imaging all that has happened is that a computer algorithm was run to detect likely galaxies and set the scale of the image you see. Sometimes that mistakes stars, satellite trails, or parts of galaxies for galaxies. Always classify the central object in the image, and help us clean up this sample by using the star/artifact button.
And you can enjoy these odd images too. I like this collection of “GZ Pure Art” based on just odd things/artifacts classifier “echo-lily-mai” thought were pretty. 🙂 If you get confused by anything please join us on Talk, or the Forum where someone will help you identify what it is you’re seeing.
A Bit More on the Chinese News about Galaxy Zoo
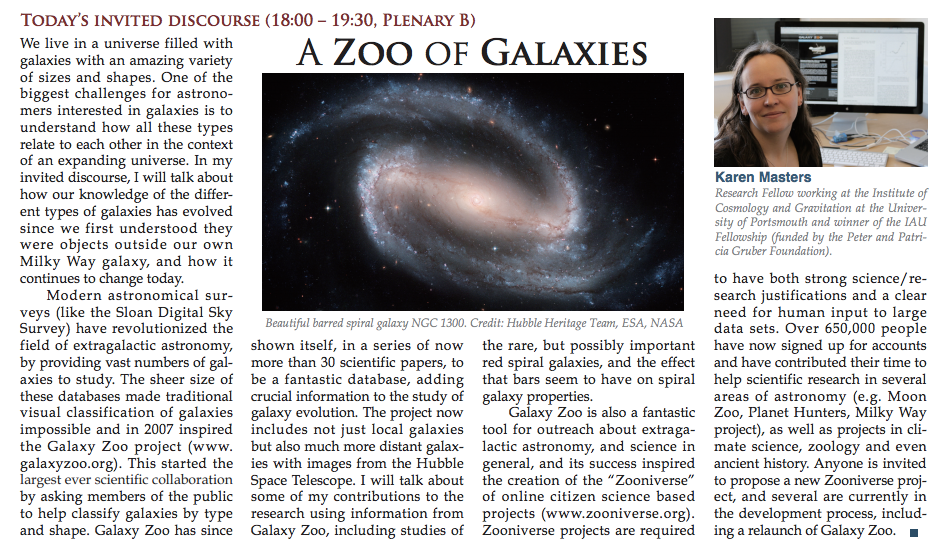
I’m back in the UK, so I thought it would be nice to give an update on the Chinese coverage of Galaxy Zoo resulting from the big talk I gave in Beijing at the 28th General Assembly of the International Astronomical Union. As you know, I was invited to give one of four “Invited Discourses” at that meeting, on the topic of “A Zoo of Galaxies”. The powerpoint slides of my talk are available online. I still don’t know where/if the video of the talk has appeared online, so will update more on that soon.
As I mentioned before, an abstract of my talk (and a picture of me and one of my favourite galaxies) appeared on the front page of the first edition of “Inquiries of Heaven” (the IAU Daily Newspaper for the meeting).
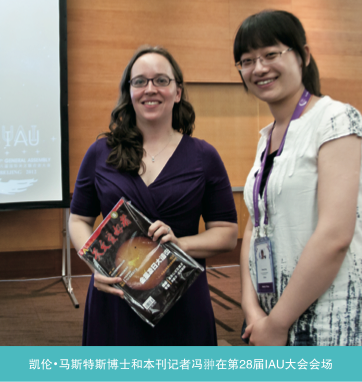
The talk also attracted a small amount of interest from Chinese press.
Kevin already posted the information that Xinhua (sort of the Chinese version of Reuters) covered it here: Astronomy Project Hunts for Chinese Helpers, (or the Chinese version); since this a news feed it got picked up by a variety of Chinese newspapers.
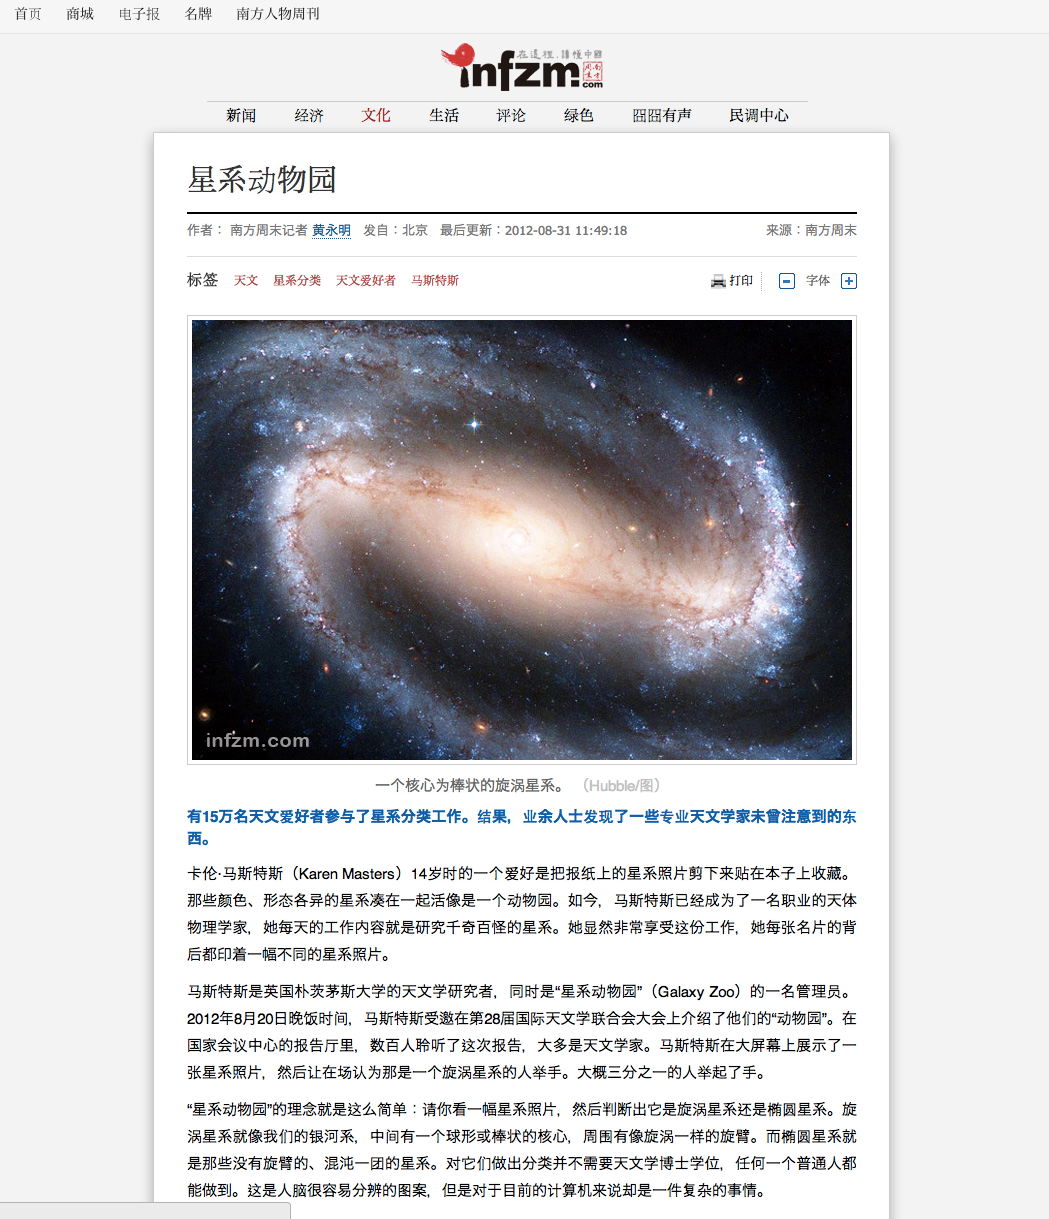
I was also interviewed for “Amateur Astronomer” (a Chinese astronomy magazine). Here’s the first page of the article they sent me.

Galaxy Zoo on the Naked Astronomy Podcast
![]()
The July 2012 of the Naked Astronomy podcast includes an interview I did with them (at the UK National Astronomy meeting this spring) about Galaxy Zoo and why it’s such a great way of learning about galaxies in the universe.
Galaxy Zoo Science Wordl
I’ve given a couple of public talks recently on results on galaxy evolution from Galaxy Zoo (at the Hampshire Astronomical Group, and the Winchester Science Festival) and one of the things I like to point out is the quantity and variety of science results we’re getting out. To illustrate that I made the below wordl of words appearing in the abstracts of all the peer reviewed science papers the Galaxy Zoo science team have put out.

This is based on the 30 papers about astronomical objects submitted up until July 2012. I just missed Brooke’s first financial reform paper submitted by a day or two, and I love that this was out of date just as soon as I made it. 🙂
I realise I should sort out things like per cent – percent, and galaxy, Galaxy, galaxies technically being the same thing. But still I think it’s interesting to look out.
Galaxy Zoo at the European Week of Astronomy and Space Science
The Galaxy Zoo science team is well represented this week at the annual European Week of Astronomy and Space Science, hosted this year at the Pope’s University (or more properly Pontifica Universita Laternase) in Rome, Italy.

It is a beautiful location for a conference

with the most amazingly decorated lecture theatre I’ve ever been in

and just up the road from the Colluseum

A session on the first day on the Structure of Galactic Discs perhaps explains the interest of many of us on the Galaxy Zoo team. I spoke in that session on my recent results looking at bars and the atomic gas content of nearby galaxies.
Brooke Simmons (now settling in as a new postdoc at Oxford after finishing her PhD at Yale recently) had a poster on some work I’m sure you’ll hear about soon about some very interesting totally bulge free disc galaxies which still have actively growing supermassive black holes in their centres.

And Portsmouth PhD student, Tom Melvin (who is working with me) had a poster on his work using Galaxy Zoo: Hubble data to look at the redshift evolution of the bar fraction (more on that very soon too I hope).

Finally, talking in the session on interacting galaxies which runs tomorrow will be Kevin Casteels from Barcelona (who we all must congratulate on his very recent PhD) who has been working mostly with Steven Bamford on morphological signatures of closely interacting pairs of galaxies (arxiv link to paper, a blog post has been promised).
We all had a lovely (and typically late Italian) dinner together on Monday night – along with a Galaxy Zoo baby: Alia (Kevin’s daughter).

New paper on the Galaxy Zoo bars accepted to MNRAS
I’m delighted to announce that the latest paper based on Galaxy Zoo classifications was accepted to appear in the Monthly Notices of the Royal Astronomical Society earlier this week, and appears on the arxiv this morning (link).
Usually there is a long delay between submission and acceptance of papers (something Kevin discussed on this blog in “What Happens Next – Peer Review“), but in this case the initial referee report came back after 2 days, and the paper was accepted only 2 weeks after the first submission so I never got time to post to the arxiv or write a blog post about it before it was accepted! This was certainly the smoothest and fastest referee process I’ve been through. 😉
Here’s the title page.

So what was new about this paper was that we combined information on the morphologies (whether or not the spiral galaxies had bars) with information on the amount of atomic hydrogen gas the galaxies contained and and our main result was that galaxies with more atomic gas in them, are less likely to have a bar.
But I want to back up a bit first and tell you about where we get this information on the atomic gas content, and why it might be interesting. As you might guess from the title of the paper it’s from something called the ALFALFA survey (and the new names in the author list for a Galaxy Zoo paper – Martha Haynes and Riccardo Giovanelli – are from Cornell University who are running this survey). Atomic hydrogen emits radio waves at a frequency of 1.4 GHz (or 21cm). This is detectable by a classic radio telescope (in what we call the “L”-band which makes up the second L of ALFALFA). In the case of ALFALFA, we use the Arecibo radio telescope (two of the “A”s in the acronym stand for Arecibo, the third is for array), which is the worlds biggest single dish radio telescope deep in the jungle of Puerto Rico.

Aerial shot of Arecibo. Credit: NAIC.
ALFALFA is a massive survey which will map the location of atomic hydrogen over basically the whole sky visible to the Arecibo radio telescope. What’s neat about a survey for something which emits as a specific frequency is that you actually get a 3D map of where the hydrogen is – both redshift and sky position! Anyway, we made use of about 40% of the survey which is already complete, and which covers about 25% of the area of the sky in which the Galaxy Zoo galaxies are found (the Sloan Digital Sky Survey Legacy Area). Adding some cuts on how face-on the galaxies are so that the bars can be identified, and to make sure the sample contains the same size galaxies right through it’s volume we ended up with 2090 galaxies with both atomic hydrogen detections and bar classifications from you guys. This is an order of magnitude larger than any similar sample! So thanks. 🙂
Atomic hydrogen is the basic building block of galaxies (after dark matter). It represents the fuel for future star formation in a galaxy – a galaxy with a lot of atomic hydrogen could in principle make a lot of new stars. Many spiral galaxies have a lot of atomic hydrogen (with perhaps as much as 10 times as much mass in hydrogen as in stars!), while a typical elliptical galaxy has very little atomic gas, and so cannot form lots of new stars.
So our observation that bars are more likely to be found in spiral galaxies with less atomic gas supports our earlier ideas about bars possibly “killing” spirals (ie. helping to stop them form stars).

Trends of bar fraction with atomic gas content, galaxy colour and how many stars are in a galaxy.
Of course it’s never quite that straightforward with galaxies. To start with correlation is not the same as causation, and to that we add that lots of things are correlated. We show some of that in the figure above. Bars are more likely in redder spirals which have more stars (“log Mstar” represents stellar mass in units relative to the mass of our Sun) and which also have less atomic gas. So the skeptical astronomer could say this has nothing to do with the gas content at all, just that the types/sizes of galaxies with less bars have more gas. To test that idea we measured the typical gas content of a spiral galaxy with a given number of stars, and from that we calculated how “deficient” or rich in atomic hydrogen any given galaxy was. Then we plotted the bar fraction against that. The convention in astronomy is to call how much less atomic hydrogen a galaxy has than normal it’s “HI deficiency” which gets bigger the less atomic hydrogen there is (from the people who brought you the magnitude scale!).

Bar fraction against how much more or less atomic gas a galaxy has than is typical for the number of stars it has. Bigger HI deficiency = less atomic gas than is normal for a galaxy’s size.
Anyway you can see we still see a clear trend, which demonstrates that it’s likely to be the atomic gas driving the correlation. Where a galaxy is richer in atomic hydrogen than normal it’s less likely to host a bar, and vice versa. Very atomic hydrogen rich galaxies which are massive and have bars are really quite rare!
Here are some examples of low and high mass galaxies which are gas rich or poor and with or without bars. 🙂

Example images.
I made images of the whole sample we use available here.
At the end of the paper we put forward three possible explanations for the correlation, all of which fit in with the observations we presented. It’s possible that the bars are causing the atomic gas in galaxies to be used up faster – “killing” the galaxy. The bar does this by driving the gas to the centre of the galaxy where it gets denser, turns into molecular hydrogen and from that stars (but only in the centre). It’s also possible (based on dynamical studies of galaxies) that gas slows down the formation of a bar in a spiral galaxy, and/or destroys the bar. Finally it’s possible that as a galaxy interacts with its neighbours, a bar gets triggered and its gas gets stripped (ie. the correlation between the two is caused by an external process). We’ll need to do more work to figure out which of these (or which combination of them) is the most important.
To my mind the most interesting result was a hint that if a gas rich galaxy does (rarely) host a bar, it’s optically redder than similar galaxies without bars. It’s just possible that bars hold back infall of gas from the outer regions of a spiral galaxy and slow down star formation over all in that galaxy. That idea needs testing, but if it’s true it’s saying that an internal structure like a bar plays an important role in the global star formation history of a galaxy.
Anyway thanks again for the classifications, and I hope the above made at least some sense! 😉
My Galaxies – Write in Starlight
Long time Zookeeper Steven Bamford has made a new website on which you can easilly write any words you like from the galaxy alphabet.He’s called the website: My Galaxies – Write in Starlight!


Enjoy!
My favourite colour magnitude diagram
I was embarrassed to discover today that I never got around to writing a full blog post explaining our work studying the properties of the red spirals, as I promised way back in October 2009. Chris wrote a lovely post about it “Red Spirals at Night, Astronomers Delight“, and in my defense new science results from Zoo2, and a few other small (tiny people) things distracted me.
I won’t go back to explaining the whole thing again now, but one thing missing on the blog is the colour magnitude diagram which demonstrates how we shifted through thousands of galaxies (with your help) to find just 294 truly red, disc dominated and face-on spirals.
A colour magnitude diagram is one of the favourite plots of extragalactic astronomers these days. That’s because galaxies fall into two distinct regions on it which are linked to their evolution. You can see that in the grey scale contours below which is illustrating the location of all of the galaxies we started with from Galaxy Zoo. The plot shows astronomical colour up the y-axis (in this case (g-r) colour), with what astronomers call red being up and blue dow. Along the x-axis is absolute magnitude – or astronomers version of how luminous (how many stars effectively) the galaxy is. Bigger and brighter is to the right.
So you see the greyscale indicating a “red sequence” at the top, and a “blue cloud” at the bottom. In both cases brighter galaxies are redder.
The standard picture before Galaxy Zoo (ie. with small numbers of galaxies with morphological types) was that red sequence galaxies are ellipticals (or at least early-types) and you find spirals in the blue cloud. The coloured dots on this picture show the face-on spirals in the red sequence (above the line which we decided was a lower limit to be considered definitely on the red sequence). The different colours indicate how but the bulge is in the spiral galaxy – in the end we only included in the study the green and blue points which had small bulges, since we know the bulges of spiral galaxies are red. These 294 galaxies represented just 6% of spiral galaxies of their kind.

So this is one of my favourite versions of the colour magnitude diagram.
Beautiful galaxy Messier 106
Inspired by today’s Astronomy Picture of the Day Image, here’s a quick post about the beautiful nearby spiral galaxy, Messier 106 (or NGC 4258).
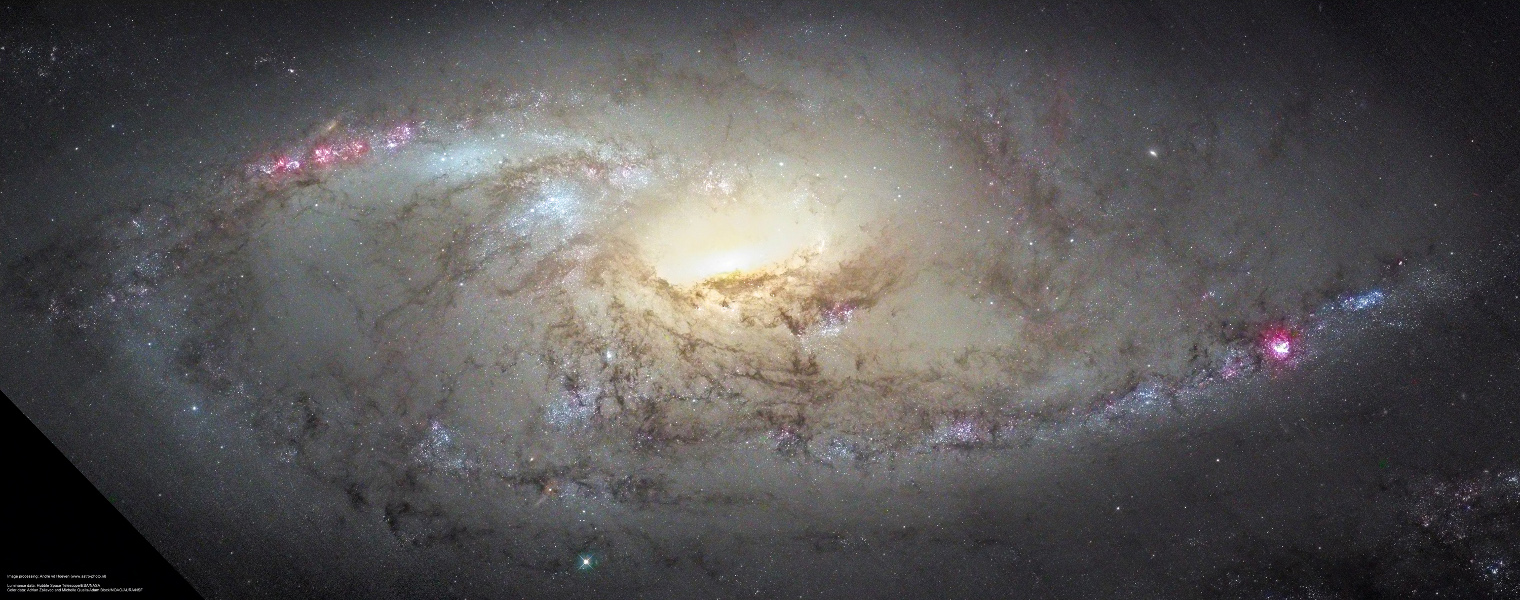 |
| M106 Close Up (from APOD) Credit: Composite Image Data – Hubble Legacy Archive; Adrian Zsilavec, Michelle Qualls, Adam Block / NOAO / AURA / NSF Processing – André van der Hoeven |
This is a composite Hubble Space Telescope and ground based (from NOAO) image. The ground based image was used to add colour to the high resolution single filter (ie. black and white) image from HST.
M106 has traditionally been classified as an unbarred Sb galaxies (although some astronomers claim a weak bar). In the 1960s it was discovered that if you look at M106 in radio and X-ray two additional “ghostly arms” appear, almost at right angles to the optical arms. These are explained as gas being shock heated by jets coming out of the central supermassive black hole (see Spitzer press release).
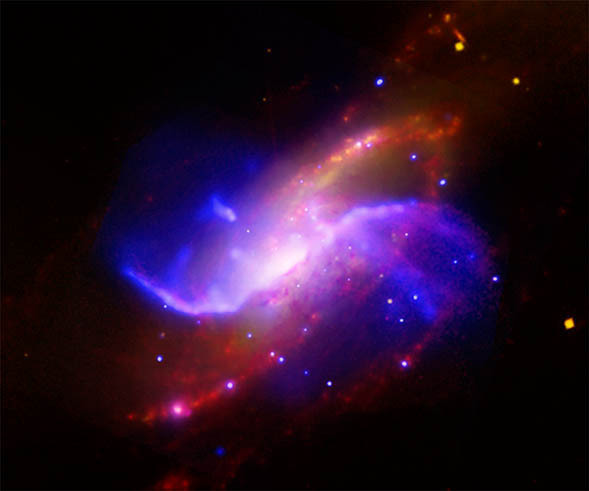 |
| In this composite image of spiral galaxy M106 (NGC 4258), optical data from the Digitized Sky Survey is shown as yellow, radio data from the Very Large Array appears as purple, X-ray data from Chandra is coded blue, and infrared data from the Spitzer Space Telescope appears red. Credit: X-ray: NASA/CXC/Univ. of Maryland/A.S. Wilson et al.; Optical: Palomar Observatory. DSS; IR:NASA/JPL-Caltech; VLA: NRAO/AUI/NSF |
Messier 106 (or NGC 4258) is an extremely important galaxy for astronomers, due to it’s role in tying down the extragalactic distance scale. A search in the NASA Extragalactic Database (NED) will reveal this galaxy has 55 separate estimates of its distance, using many of the classic methods on the Cosmic distance ladder. Most importantly, M106 was the first galaxy to have an geometric distance measure using a new method which tracked the orbits of clumps of gas moving around the supermassive black hole in its centre. This remains one of the most accurate extragalactic distances ever measured with only a 4% error (7.2+/-0.3 Mpc, or 22+/-1 million light years). The error can be so low, because the number of assumptions is small (it’s based on our knowledge of gravity), and as a geometrically estimated distance it leap frogs the lower rungs of the distance ladder.
This result was published in Nature in 1999: A geometric distance to the galaxy NGC4258 from orbital motions in a nuclear gas disk, Hernstein et al. 1999 (link includes an open access copy on the ArXiV).
Because M106 has so many different distances estimated using so many different methods, and is anchored by the extremely accurate geometric distance, it helps us to calibrate the distances to many other galaxies. Almost all cosmological results, and any result looking at the masses, or physical sizes of galaxies need a distance estimate.
So M106 is not only beautiful, it’s important.
Another Galactic Twin
It seems that finding our Milky Way’s twin has become a bit of an industry these days.
NASA/ESA have got in on the act today, releasing a press release about their favourite twin of the Milky Way, NGC 1073 and the below absolutely gorgeous Hubble Space Telescope image they’ve taken of it: Classic Portrait of a Barred Spiral.

Hubble image of NGC 1073: another possible Milky Way twin. Credit: NASA/ESA
And it does look a lot like what we think the Milky Way looks like – except perhaps for having slightly less tightly wound arms.

An artists impression of our Galaxy. Credit: NASA/JPL-Caltech/Robert Hurt (SSC-Caltech)
You might remember, back in September I posted a guest blog by Portsmouth A-level student, Tim Buckman, who spent his summer with us at Portsmouth finding the Galaxy Zoo galaxy we thought was most like the Milky Way: “A Summer Spent Finding our Galactic Twin “. His project in turn was inspired in part by an ESO press release about spiral galaxy NGC 6744 which was claimed to be a twin for the Milky Way (A Postcard from Extragalactic Space).

NGC 6744 – the previously proposed clone. Credit: ESO.
NGC 6744 is quite a lot more massive than our Milky Way however, so I thought we could do better with SDSS and Galaxy Zoo. Tim applied some mass cuts, then used your classifications to find a face-on 4 armed spiral which he thought matched the maps of the Milky Way (which has a bar, but perhaps a rather weak one which might not be obvious in the types of images we used for Galaxy Zoo).
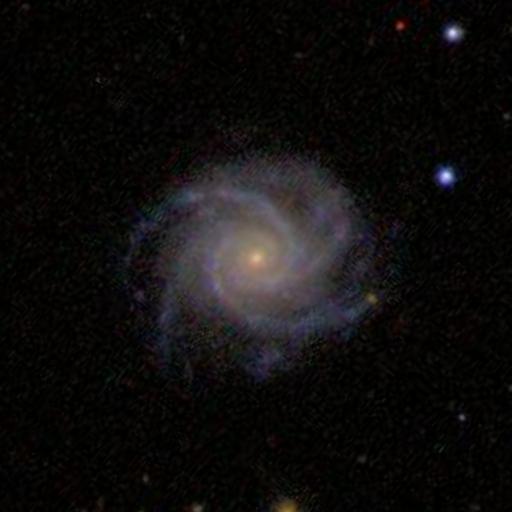
Tim’s Milky Way clone based on your Galaxy Zoo classifications
I was interested to notice last month that one of the most popular press releases from the AAS this year was about finding a sample of galaxies like our Milky Way and using them to estimate what the colour of the Milky Way would be (BBC Article: Milky Way’s True Colours; AAS abstract it’s based on: What is the Color of the Milky Way?), especially interesting to me as it turns out the Milky Way might be on it’s way to being a red spiral (as has been suggested before, e.g. by Mutch, Croton, Poole (2011), or see New Scientist article about this paper: Milky Way Faces Midlife Crisis), which you might remember I’ve done a bit of work on! 😉
Today’s NASA/ESA release has already been picked up by the BBC: Hubble Snaps Stunning Barred Spiral Galaxy Image (they’d already used “Striking View of Milky Way Twin” on NGC 6744), and Space.com covers it as Hubble Telescope Spies Milky Way Galaxy Twin.
For Galaxy Zoo people, it should be of interest that the press release also says:
Some astronomers have suggested that the formation of a central bar-like structure might signal a spiral galaxy’s passage from intense star-formation into adulthood, as the bars turn up more often in galaxies full of older, red stars than younger, blue stars.
Well those astronomers are us – Galaxy Zoo results on bars, based on your classifications have shown that bars are more common in redder discs. Thanks again for the classifications which allowed us to do that work.
