
New images for Galaxy Zoo! Part 2 – Illustris
We’re extremely excited to announce the launch of two new image sets today on Galaxy Zoo. Working with some new scientific collaborators over the past few months, we’ve been able to access data from two new sources. This blogpost will go into more details on where the images come from, what you might expect to see, and what scientific questions your classifications will help us answer. (See Part 1 of this post to learn about the other new images from the DECaLS survey).
The second set of new data comes from the Illustris Project. Illustris is a state-of-the-art simulation of the Universe, led by a large team of researchers in the US, UK, and Germany. Large-scale cosmological simulations are a critical tool in astronomy; since we don’t have laboratories where we can replicate the conditions of processes like galaxy formation, we use computer simulations to investigate them instead. Such simulations start with what we believe conditions in the very early Universe were like (which we infer from the cosmic microwave background), and can include both dark matter and baryons (particles like protons and neutrons that eventually form the stars, dust and gas in galaxies). The simulation then tracks what happens to the matter and energy over billions of years as the Universe expands, evolving according to the laws of physics that are programmed into the simulation. This includes relations like the law of gravity, which dominates how dark matter moves, and hydrodynamics, which describe the motions of the gas. It’s truly amazing – scientists can watch galaxies form and evolve over huge scales of distance and time, and compare the results to real observations to test if the physics of the simulations are correct. Illustris is one of the largest and most detailed simulations ever run, taking more than 19 million CPU hours to run on powerful supercomputers.

A large-scale projection through the Illustris volume at redshift z=0, centered on a massive cluster. The left side of the image shows the density of dark matter, while the right side shows the density of the gas in cosmic baryons. Image and text courtesy of the Illustris project.
This comparison to real data is the key feature that sparked the collaboration between Illustris and Galaxy Zoo. Once the simulation is run, astronomers analyze the results to see if their galaxies match the properties of those seen in the real Universe. This includes measurements like the total number of stars formed, the ratio of stars to dark matter, and the distribution of galaxies of different masses and luminosities. Another critical parameter we want to compare is galaxy morphology; measuring the ratio of ellipticals to spirals, for example, is an important test of whether the galaxy merger rate is correct, and if the simulation codes for star formation and gravitational interaction are correct.
The Illustris scientists have created images of the galaxies from their simulation that GZ volunteers will classify by their morphology. Our comparison data set for this will be the SDSS results from Galaxy Zoo 2, and the images are designed to match the Sloan images as closely as possible. This includes the same set of filters for the telescope, sizing the images so that the galaxies look like they’re at cosmic distance from the Milky Way, and setting them against backgrounds of stars and other galaxies. The quality of the simulations and images are amazing – these look to me like real galaxies in every way. It’s something that astronomers definitely couldn’t do ten years ago.

Two galaxies from the Illustris simulation evolving in time from left to right, from when the universe was a quarter its current age, to the present. The top galaxy shows a massive, red, elliptical-shaped galaxy forming after a series of mergers with other systems. The bottom galaxy reveals the formation of a smaller, bluer, disk-shaped galaxy forming after a less violent history of interactions. Images and text courtesy of the Illustris project.
Although these images aren’t of “real” galaxies, we want to emphasize again how much your classifications will help scientists to do astronomical research. Simulations like Illustris are the only way that we can probe galaxy formation and evolution as it happens. Your classifications, both from Galaxy Zoo 2 and from the new Illustris data, provide vital tests for the output and will be fed back to the science teams in order to improve future versions of these sims.
If you have questions or want to discuss anything you see in the new images, please join the discussion with scientists and volunteers on Talk. The Illustris Project also has some amazing online tools if you want to learn more, including an interactive explorer of the simulation and videos of the evolving Universe. You also can explore specific galaxies you’ve classified via GZ:Examine. As always, thanks to everyone for your help!
New images for Galaxy Zoo! Part 1 – DECaLS
We’re extremely excited to announce the launch of two new image sets today on Galaxy Zoo. Working with some new scientific collaborators over the past few months, we’ve been able to access data from two new sources. This blogpost will go into more details on where the images come from, what you might expect to see, and what scientific questions your classifications will help us answer. Part 2 of this post will discuss the other set of new images from the Illustris simulation.
The Dark Energy Camera Legacy Survey (DECaLS) is a public optical imaging project that follows up on the enormous, groundbreaking work done by the various versions of the SDSS surveys over the past decade. The aim of DECaLS is to use larger telescopes to get deeper images with significantly better data quality than SDSS, although over a somewhat smaller area. The science goals include studies of how both baryons (stars, gas, dust) and dark matter are distributed in galaxies, and particularly in measuring how those ratios change as a galaxy evolves. By adding morphology from Galaxy Zoo, our joint science teams will explore topics including disk structure in lower mass galaxies, better constraints on the rate at which galaxies merge, and gather more data on how the morphology relates to galaxy color and environment.
DECaLS observations use the Blanco telescope, which is located at CTIO in northern Chile at an altitude of 2200m (7200 ft). The telescope has a 4-m aperture mirror, giving it more than three times the collecting area of the SDSS telescope. The camera used for the survey is named DECam, a large-area and extremely sensitive instrument developed for a separate program called the Dark Energy Survey. The camera has 570 megapixels and covers a 2.2 degree field of view – more than 20 times the apparent size of the full moon! The combination of the exquisite dark-sky observing site, a sensitive wide-field camera, and larger telescope all combine to generate the new images, which will eventually include more than 140 million unique sources on the sky when DECaLS is finished.
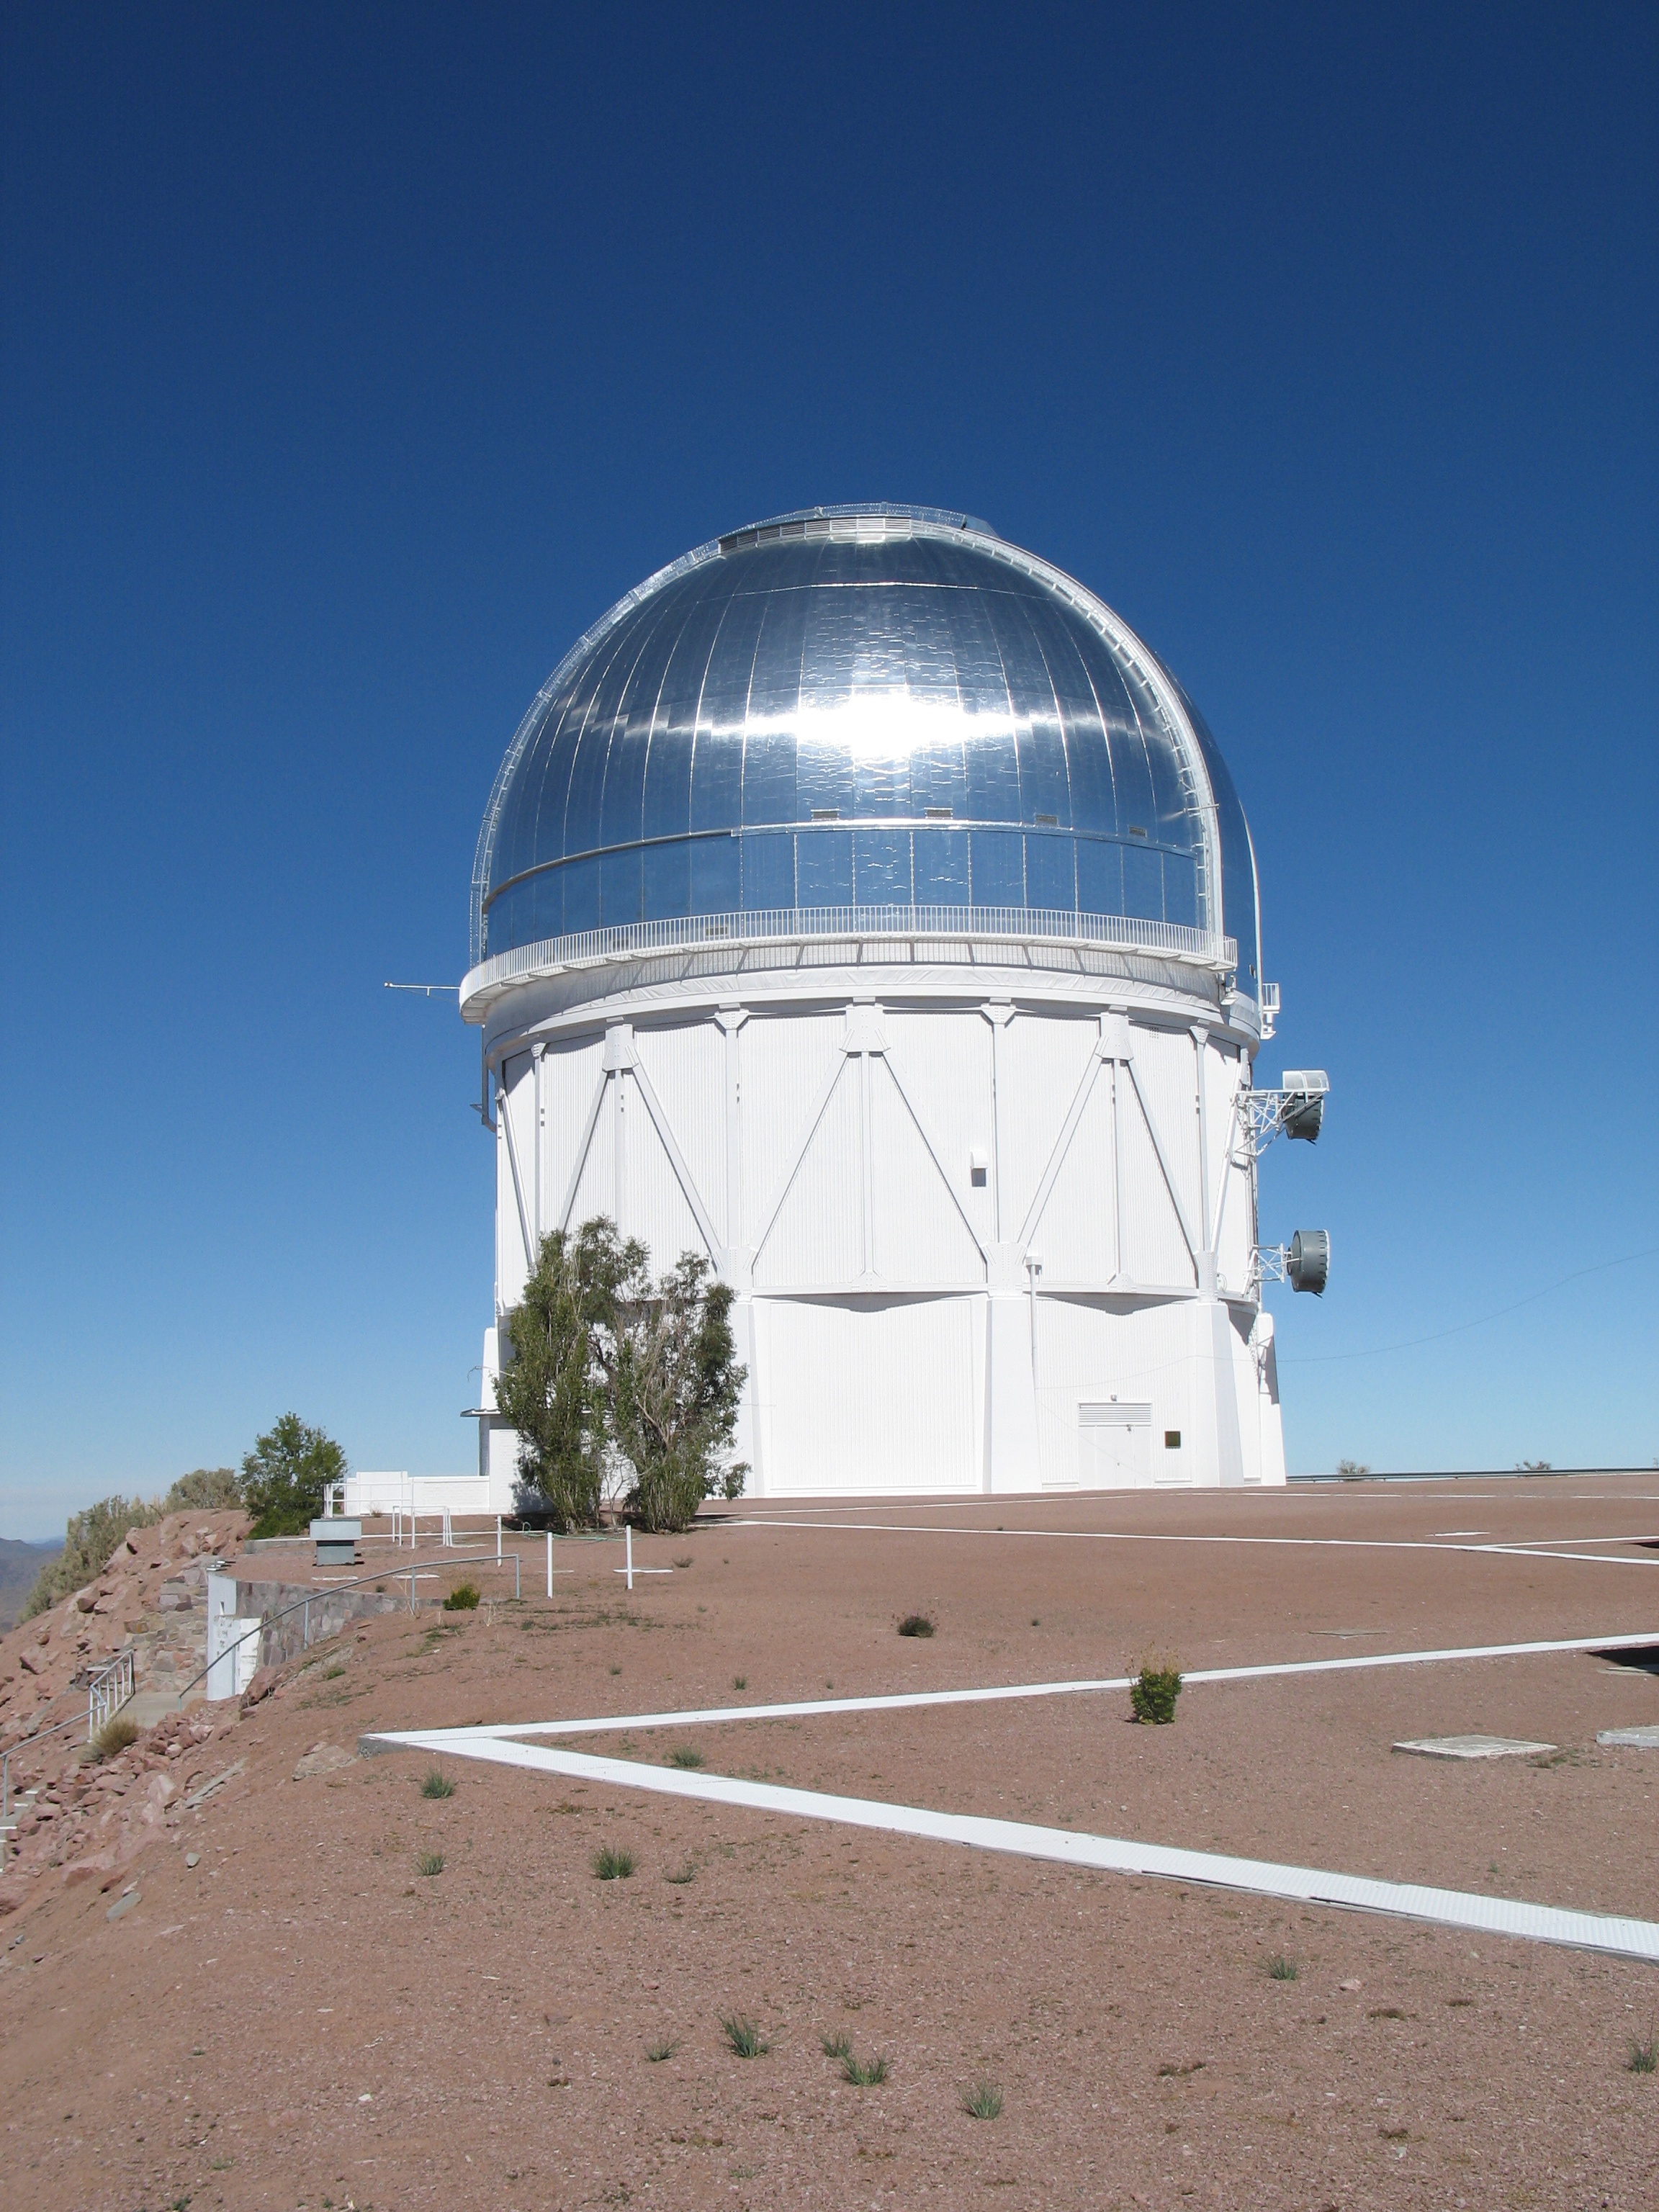
The Victor M. Blanco 4m telescope, located at CTIO in northern Chile, is carrying out the observations for the DECaLS survey. Image courtesy NOAO.
The DECaLS images in Galaxy Zoo are a smaller group taken from a catalog called the NASA-Sloan Atlas. We’re focusing on somewhat larger and brighter galaxies from the catalog. The reason is that although many of these galaxies have been classified in GZ already via their Sloan images, we’re particularly interested in measuring details like tidal tails from mergers, seeing fainter spiral structures, and separating galaxies that couldn’t be individually resolved in the Sloan data. Here’s a great example of a single galaxy in both SDSS and DECaLS – check out how much clearer the spiral arms are in the new images!

Left: an SDSS image of the galaxy J225336.34+000347.4. Right: a DECaLS image of the same galaxy.
Almost all of the morphology and classification tasks are the same as they were for the Sloan images, so it should be familiar to most of our users. If you have questions or want to discuss anything you see in the new images, please join the discussion with scientists and volunteers on Talk. As always, thanks for your help!
Summer Research With Galaxy Zoo
The below blog post was written by Alex Todd, an Ogden Summer Intern who spent the summer working on Galaxy Zoo related research projects at the University of Portsmouth. Alex is now off to his next adventure – starting his undergraduate degree in Natural Sciences at the University of Bath.

Alex hard at work on his Galaxy Zoo project.
I have been working with the Galaxy Zoo team at the Institute of Cosmology and Gravitation, in Portsmouth, for 8 weeks this summer. I have been analysing the results of Galaxy Zoo 2, and more specifically the region of the sky known as Stripe 82. In this area, the Sloan Digital Sky Survey (SDSS) took many images of the same patch of sky, instead of only one. These images were combined to produce a single, higher quality image, which showed fainter details and objects. Both these deeper images and the standard depth images of stripe 82 were put into galaxy zoo, and I have been comparing the resulting classifications. I learned to code in python, a programming language, and used it to produce graphs from the data I downloaded from the Galaxy Zoo website. I started by comparing the results directly, comparing the number of people who said that the galaxy had features in each of the image depths.

On the graph, each blue dot is a galaxy (there are around 4,000) and the red dashed line shows the overall trend. As you can see from the graph, when the proportion of people who see features is low, there is a good match between the two image depths. However, when the proportion is high, there is a much bigger difference between the two image depths, with the proportion being higher in the deep image. This is because fainter features are visible in the deeper image.
I then plotted graphs of the difference between the proportions (P(Features)) against the brightness of the galaxy. To measure the brightness, I used the apparent magnitude, a measure of how bright the galaxy appears to us (as opposed to how bright it actually is).
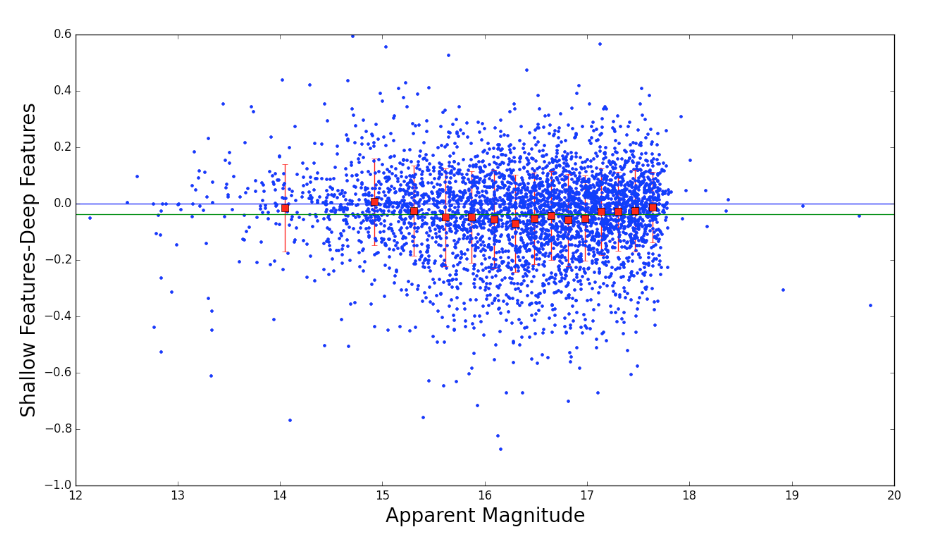
The graph below shows the difference in P(Features) plotted against the apparent magnitude. The blue line is at y=0, and the green line represents the average value of the difference between P(Features). As you can see, there is not much difference between the values of P(Features) when the galaxy is particularly bright (Small apparent magnitude) or when it is particularly dim (large apparent magnitude). However, when the galaxy has an average brightness, the difference is quite substantial. We think this is because in bright galaxies, features can be seen in both images, whilst in dim galaxies they can be seen in neither. In medium brightness galaxies, however, they can only be seen in the deeper image. The fact that there are differences between the classifications means that it would be a good idea to classify deeper images of the rest of the sky, to hopefully improve the accuracy of the classifications.
I have greatly enjoyed my time working on at the ICG on galaxy zoo, and would certainly seize the opportunity to pursue it further.
It’s been a pleasure working with Alex this summer. He really impressed me with the speed at which he picked up programming languages. This information about the differences in perception of morphological features between deeper and shallower images is very useful to us as a science team as we plan for future generations of the Galaxy Zoo project with new, more sensitive images from current and ongoing astronomical surveys.


First Radio Galaxy Zoo paper has been accepted!
The first Radio Galaxy Zoo paper has been accepted by the Monthly Notices of the Royal Astronomical Society (MNRAS) and is available today on astro-ph. The paper entitled “Radio Galaxy Zoo: host galaxies and radio morphologies derived from visual inspection” outlines the project and provides the first look into some of the science that has come from Radio Galaxy Zoo.
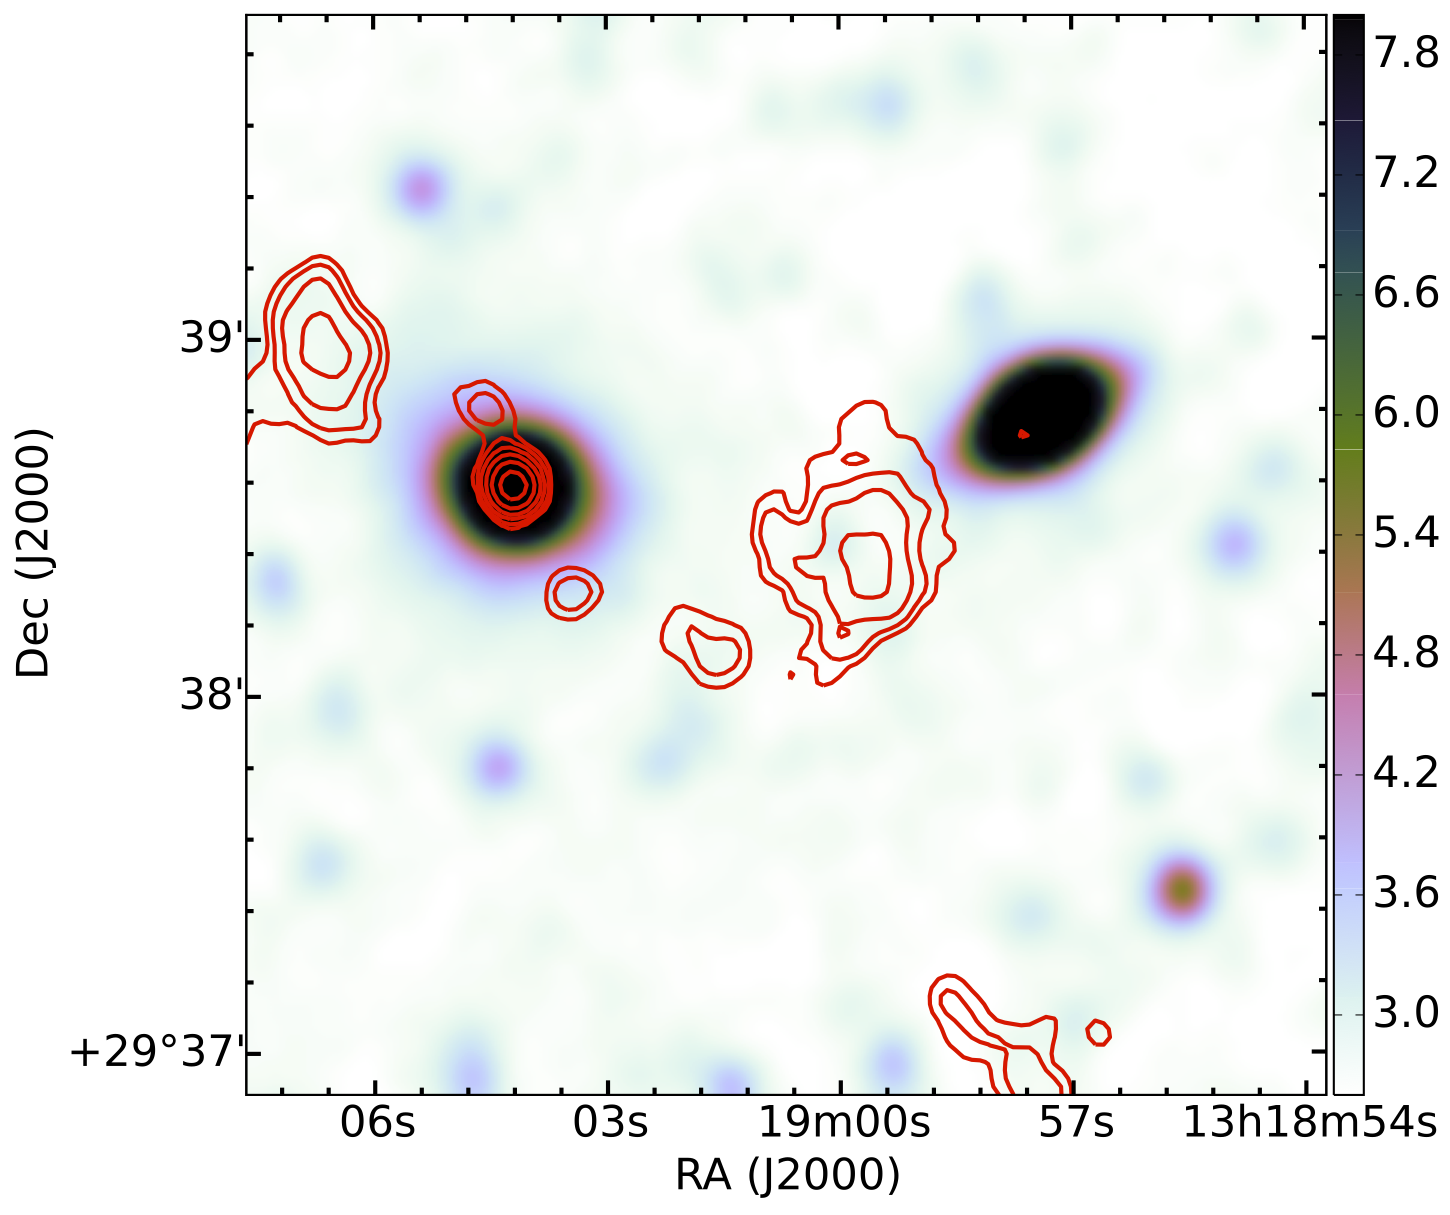
Fig. 1. An example of a galaxy where visual identification of the radio components is necessary. the automated algorithms would have classified the non-core emission as independent sources, whereas RGZ volunteers (in agreement with the science team) find all five radio emission components in the upper half of the image to be related to the same source.
As mentioned in our previous article about the paper, we find that the RGZ citizen scientists are as effective as the RGZ science team in identifying the radio sources and the host galaxies. The project now has over 7500 citizen scientists and their contributions are individually acknowledged at http://rgzauthors.galaxyzoo.org
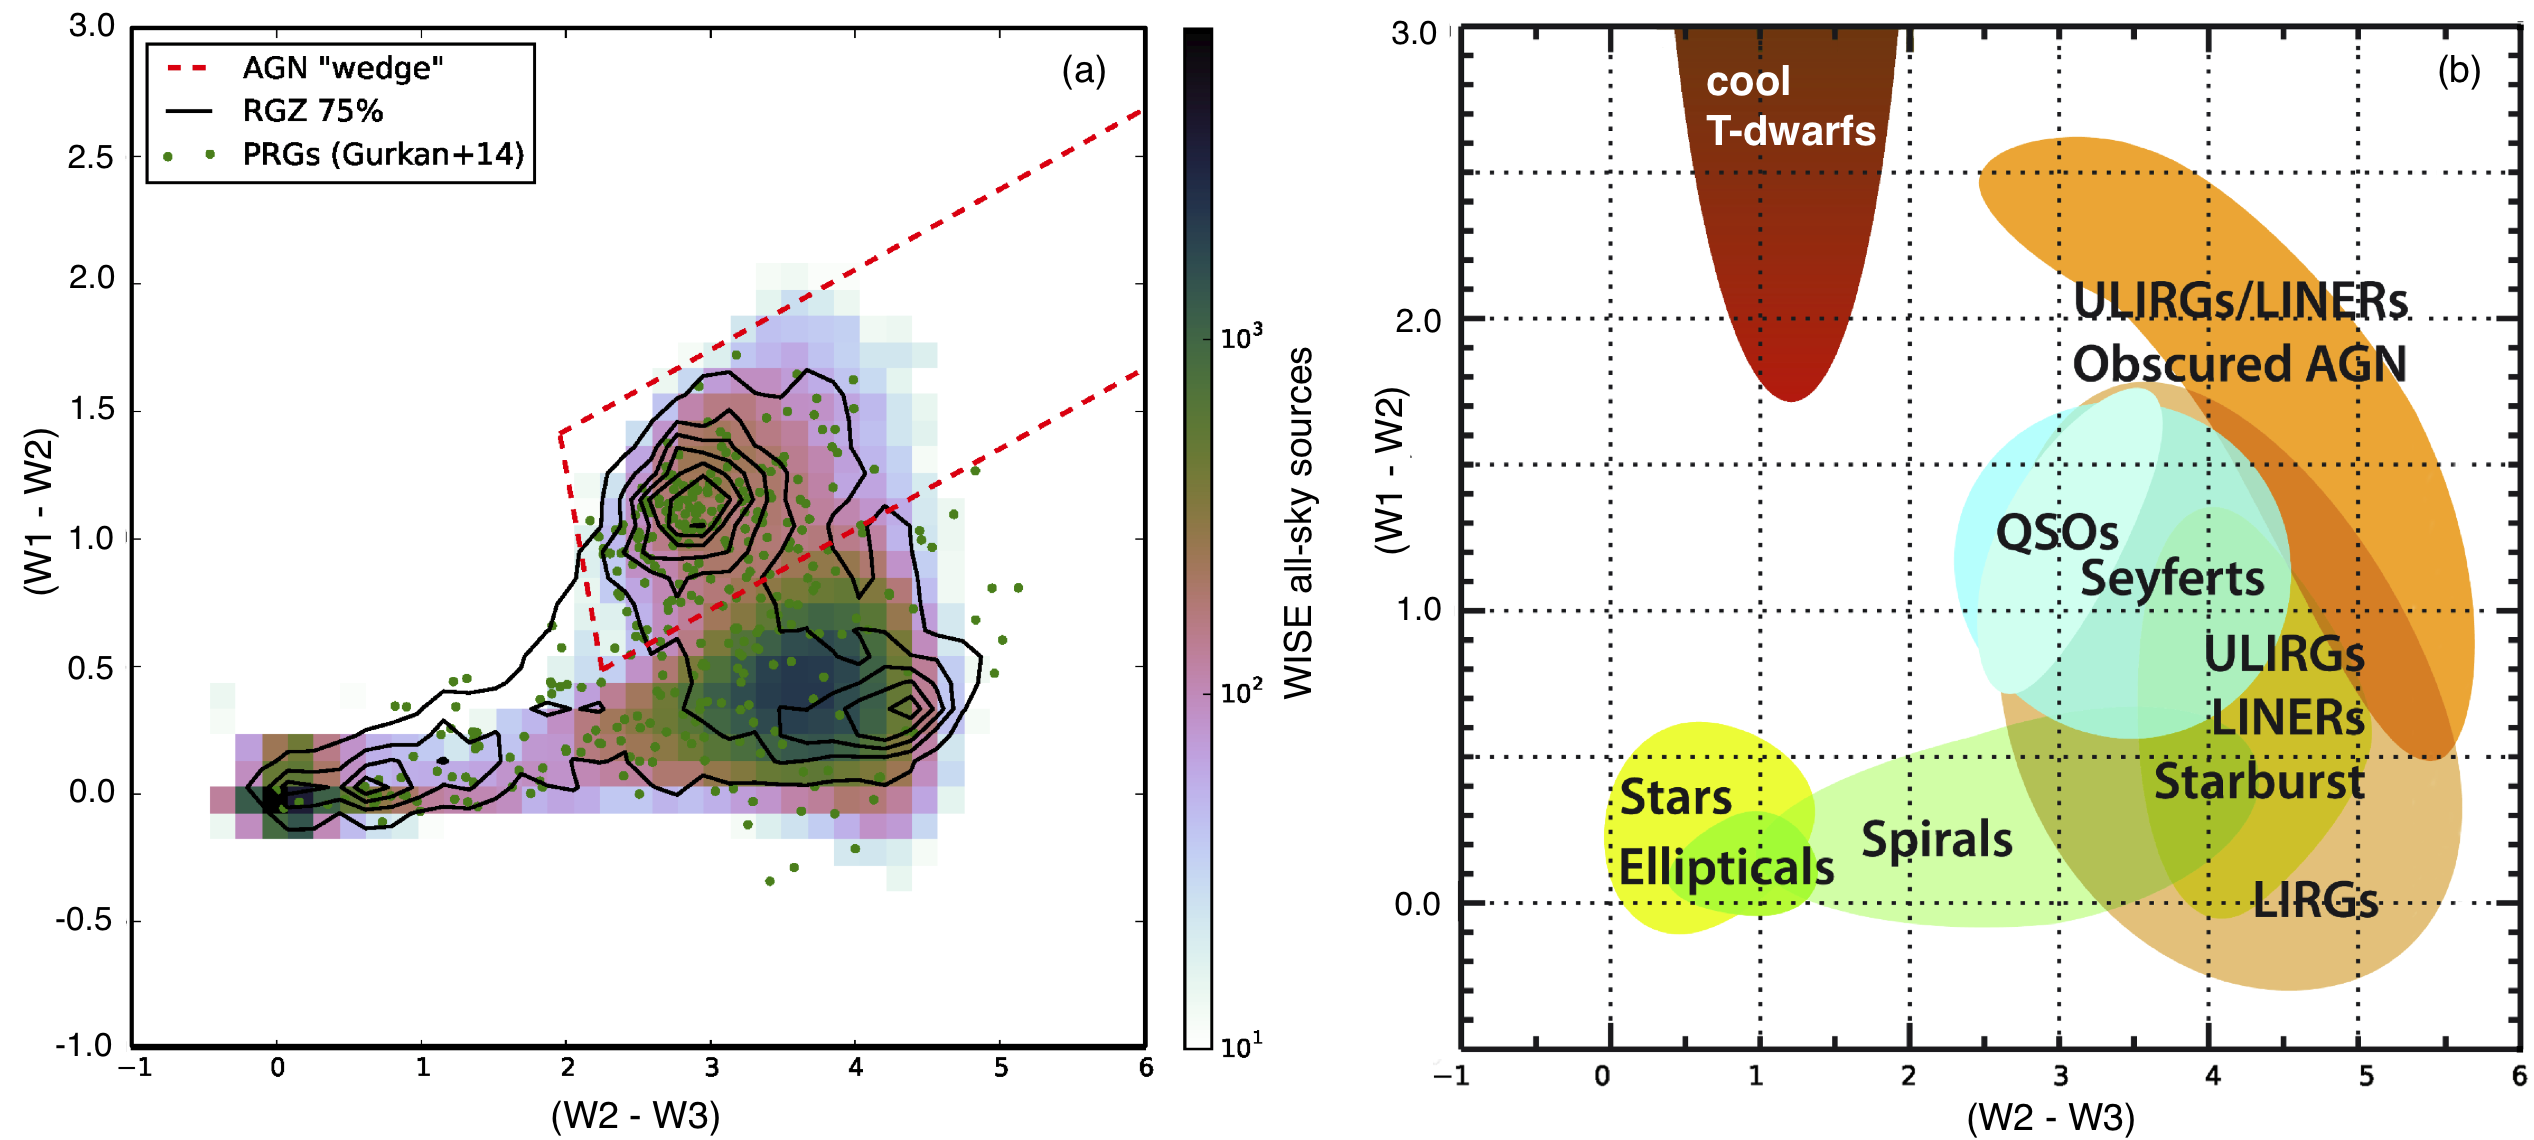
Fig. 2. (a) WISE colour-colour diagram showing approximately 100,000 WISE all-sky sources (colourmap), 4614 RGZ sources (black contours), and powerful radio galaxies (green points). (b) WISE colour-colour diagram showing the locations of various classes of astrophysical objects from Wright et al. (2010).
Using the classifications of the WISE infrared host galaxies, we find that the majority of the host galaxies are located in the WISE colour space consisting of elliptical galaxies, quasi-stellar objects (QSOs), and luminous infrared radio galaxies (LIRGs) – see Fig. 2. Upon closer examination of the RGZ objects that are identified as elliptical galaxies in the WISE W1-W2< 0.5 colour space we note that our current sample shows a possible large population of star-forming galaxies and/or ellipticals with enhanced dust – see Fig. 3.
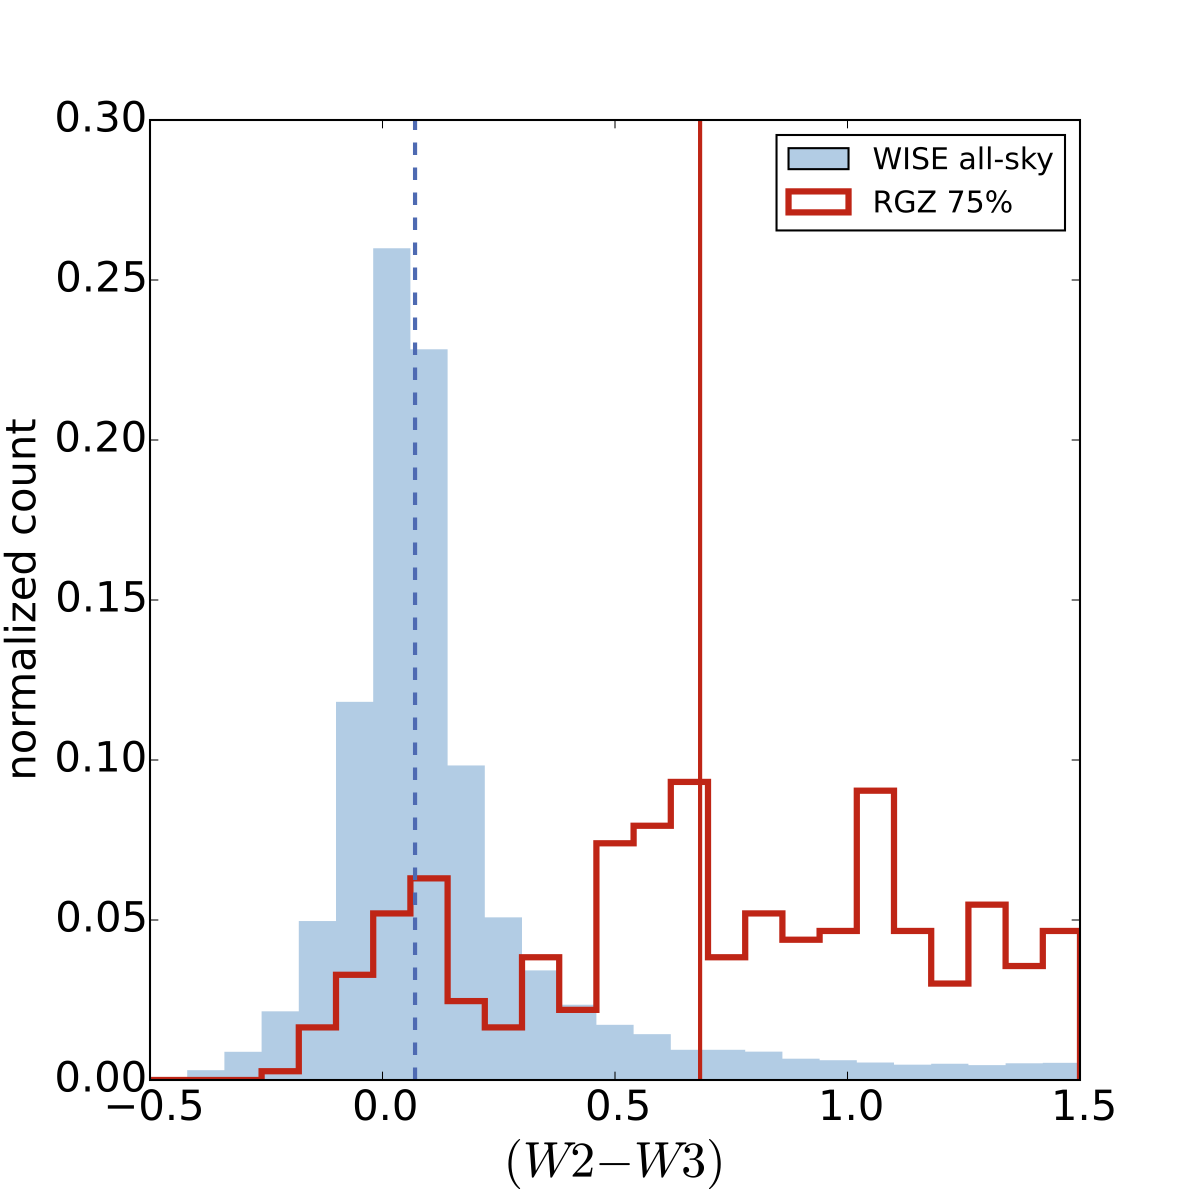
Fig. 3. Distribution of (W2 – W3) infrared colours for objects near the region identified as elliptical galaxies (W1 – W2) < 0.5. Solid and dashed vertical lines show the median colours of the all-sky and RGZ sources. While sources randomly selected from the WISE all-sky sample peak near (W2 – W3) = 0, our current RGZ sample shows a large population with significantly redder colours – possibly from star-forming galaxies and/or ellipticals with enhanced dust.
We still have a lot of radio sources in our project that need classification and we hope to continue the great work from all our citizen scientists and science team. Don’t forget to head over to Radio Talk for interesting discussions on objects or some of the science in general.
Thank you once again for your hard work and support throughout the first years of Radio Galaxy Zoo!
Eight Years of Galaxy Zoo
It’s our eighth birthday! The team have done a great job exploring the various ways the number eight connects to the Galaxy Zoo Universe and that collection of blogs does a brilliant job of illustrating the dramatic variety of places we’ve explored together. Some of them were familiar, but others we didn’t even dream of before the start of the project.

An 8 for our 8th birthday!
Once you start thinking about it, thinking of Galaxy Zoo as an exploration, as a journey undertaken as a group makes a lot of sense. Lots of you have joined us for the whole journey, as we’ve travelled further and further from familiar ground, while others – just as welcome – have walked only a little way. The science team, too, has grown as it has become apparent quite how much can be done with your classifications, and the whole grand parade has attracted a following of computer scientists, web developers and other assorted camp followers.
I’m writing this on my way to report on the arrival of New Horizons at Pluto for the Sky at Night. For the first time, we’ll see close up images of a world that until now has been little more than a point of light. The missions is part of the glorious tradition of Solar System exploration, but our journey through the datasets provided by the Sloan Digital Sky Survey and by Hubble are voyages of exploration too. We need not travel to distant galaxies to understand them; encountering something new and never-before-seen in your web browser is thrill enough. Thanks for all the classifications of the last eight years – here’s to many more.
Chris
Eight years and eight different types of galaxy images
One of the wonderful things we’ve been able to do with Galaxy Zoo over the years is to use the same site to classify many different types of images of the sky. These include surveys that come from a range of telescopes, both on the ground and in space, images at a range of wavelengths, and covering different areas of the sky. We need these different sets of images because they drive the wide variety of scientific questions that the science team studies using galaxy morphology. As part of our celebration of eight years of Galaxy Zoo, I wanted to highlight the different datasets we’ve been able to classify over the years.
Sloan Digital Sky Survey (Legacy Sample)
The bulk of the data used in both the original Galaxy Zoo and Galaxy Zoo 2 projects. These images were taken by the SDSS telescope, located in the mountains of New Mexico, and provided almost 900,000 individual galaxies that volunteers helped to classify.
Spiral galaxies from SDSS and Galaxy Zoo (Lintott et al. 2008)

COSMOS (Hubble Space Telescope)
The Cosmological Evolution Survey (COSMOS) was a dedicated campaign to image the same 2-square-degree field of the sky with more than a dozen telescopes, from radio through X-ray. 86,314 images of galaxies in the COSMOS field taken with Hubble were classified as part of the Galaxy Zoo: Hubble project.
Unbarred spiral galaxies from COSMOS and classified in GZ: Hubble. From Melvin et al. (2014).

CANDELS (Hubble Space Telescope)
The Cosmic Assembly Near-Infrared Deep Extragalactic Legacy Survey (CANDELS) was the largest project in the history of Hubble, with the equivalent of more than four straight months of observing time. Using the near-infrared WFC3 camera, Hubble image some of the earliest massive galaxies, formed only 2-3 billion years after the Big Bang. 49,555 images from CANDELS were classified in Galaxy Zoo from 2012-2013.
Disk galaxies in GZ:CANDELS, including those without bars (top row) and those with bars (bottom row). From Simmons et al. (2014).

UKIDSS (infrared images)
The United Kingdom Infrared Telescope, located near the summit of Mauna Kea in Hawai’i, carried out a large survey at infrared wavelengths, ranging from 1 to 3 microns. This survey (UKIDSS) allows us to compare morphologies of the same galaxies between optical and infrared, probing the effects of galactic dust and different stellar populations. 70,503 galaxies from UKIDSS have been classified by Galaxy Zoo volunteers.
A spiral galaxy with dust lanes, seen in both the optical (SDSS; left) and the infrared (UKIDSS; right).

FERENGI (artificially-redshifted)
One of the critical issues with all Galaxy Zoo data has been calibration of the morphologies we measure, especially in distant galaxies where small and/or faint images can affect the accuracy of classifications. Using a piece of software called FERENGI, we artificially processed SDSS images to make them appear as if they were much further away, and we’re using those classifications to calibrate the data from Hubble. This included 6,624 images of galaxies at a range of distances and brightnesses.
An SDSS image of a barred spiral, artificially processed to appear as if it were at a variety of distances.

GOODS (Hubble Space Telescope)
The Great Observatories Origins Deep Survey (GOODS) is another multi-wavelength survey of the sky, focusing on data from NASA’s flagship space telescopes of Hubble, Chandra, and Spitzer (plus others). We not only study high-redshift galaxies using GOODS data in Galaxy Zoo, but also measure how increasing the sensitivity of the images can change the apparent morphology. 11,157 GOODS images have been classified in Galaxy Zoo at both shallow and deep imaging depths.
Comparison of the GOODS images classified in Galaxy Zoo. The left shows shallower images with only 2 sets of exposures; the right shows the deeper images with 5 sets of exposure.

Flipping spiral galaxies
One of the very first Galaxy Zoo papers addressed a fundamental question: are spiral galaxies in the Universe more likely to spin clockwise, counterclockwise, or equally likely in both directions? To measure this, we used images of spiral galaxies that were artificially flipped, which helped us correct for a psychological bias in the human brain that exhibits a slight preference for counterclockwise spins.
Images of four spiral galaxies, both as the originals (top) and horizontally flipped (bottom).

Single-band SDSS (ugriz)
The latest new set of data used SDSS galaxies again. Instead of making the “color” images that we’ve used before, however, Galaxy Zoo volunteers were asked to classify images from the five individual filters in SDSS, spanning light from the near-ultraviolet to the near-infrared. This will allow us to better measure how morphology can change as a function of observing wavelength, and determine which physical processes in the galaxy are responsible for the light that defines how we measure the shapes.
Single-band filter images of galaxies from the SDSS.
More to come soon. Thanks again for all your help with what we’ve done so far!!!
Eight years and 8 billion years of cosmic history
Next up in our series of eight blog posts celebrating eight years of Galaxy Zoo is this post from Tom Melvin, who was the lead author of the the first publication from Galaxy Zoo: Hubble, which looked at how the fraction of barred disk galaxies has evolved over the last eight billion years. Tom is also the first person to write a PhD thesis substantially based on Galaxy Zoo classifications, which he is in the process of completing final corrections for.

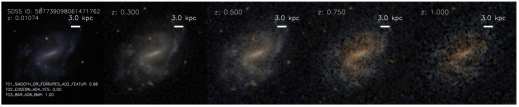
Barred disc galaxies at high redshift identified by Galaxy Zoo Hubble. The redshift (‘z’) and the fraction of volunteers identifying a bar (‘Pbar’) are noted in each image.
This was the first time the Galaxy Zoo volunteers had been asked to classify galaxies taken by the Hubble Space Telescope, which provided beautiful images of galaxies whose light has taken up to eight billion light years to reach us!
With your classifications, we were able to select a sample of disk and barred disk galaxies, as shown above in Figure 1, and explore how the fraction of disk galaxies that are barred has evolved over the last eight billion years. We found that this bar fraction has been increasing as the Universe has grown older, doubling from 11% eight billion years ago to 22% four billion years ago, which is shown below in Figure 2. We also know from Galaxy Zoo 2 that this continues to increase, with around one third of disks having a bar in our local Universe. We were able to expand on this by showing that it was the most massive disk galaxies that were the driver of this evolution.
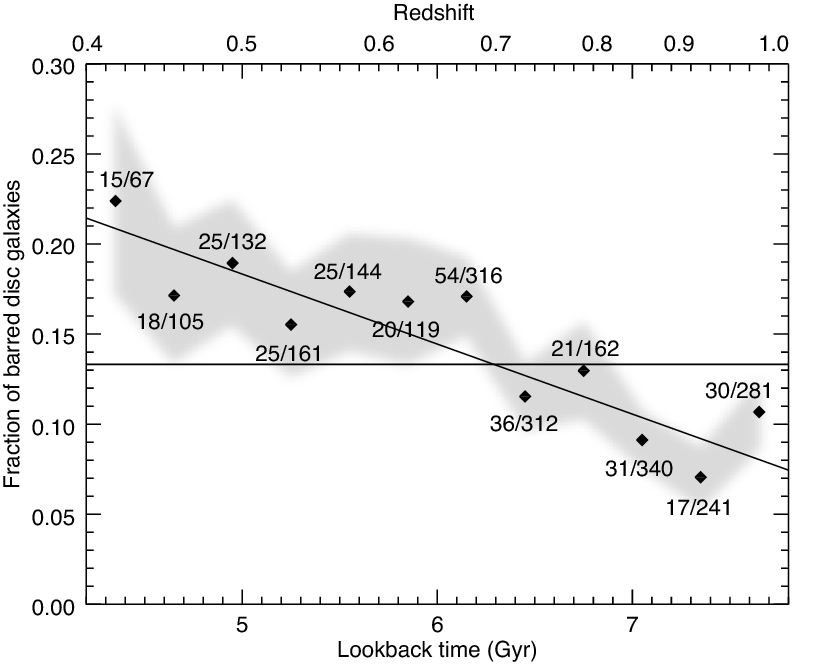
Redshift evolution of the fraction of barred disc galaxies. Each point represents the observed bar fraction in a 0.3 Gyr bin, with the number of barred disc galaxies and total number of disc galaxies indicated. The grey shaded region indicates the error on the measurement. We show the mean bar fraction for the whole sample (fbar = 13.3 ± 0.7%) as the horizontal dot-dashed line, as well as a linear relationship between the bar fraction and the lookback time which is shown by the solid line.
As bars tend to only form in disk galaxies that are settled and relaxed, or ‘mature’, our results showing an increasing bar fraction over the last eight billion years tells us that the disk galaxy population has matured as the Universe has aged. As this evolution is being driven by the most massive disk galaxies, we were able to conclude that the most massive disk galaxies become mature sooner than their lower mass counterparts.
In addition to these results, we were able to identify a population of ‘red spiral’ galaxies thanks to your classifications. These red spirals’ would typically be omitted from other disk samples, as they would be classified as elliptical galaxies – but as you can see below, these are clearly beautiful red spiral galaxies! What is interesting about this population of disks is that their bar fraction of 45% is much higher than the bar fraction of the whole disk sample, which is roughly 14%.

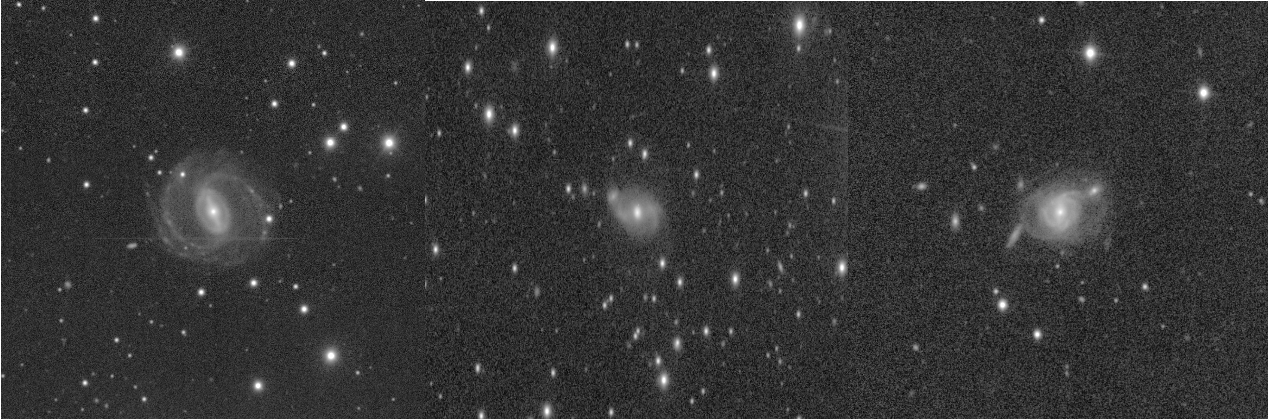
Images showing 3 unbarred (images a − c) and 3 barred (images d − f) “red spiral” galaxies from Galaxy Zoo Hubble.
So, thanks to your help classifying the amazing images from the Hubble Space Telescope, we were able to track the evolving bar fraction of disk galaxies over the last eight billion years. There is plenty more to be done with this sample of galaxies, so keep an eye out for future results looking at how galaxies have evolved over the past eight billion years!
8 kpc – The approximate distance of the Sun from the centre of our Galaxy
Our sun is one of a hundred billion or so stars in the Milky Way, travelling in relative peace in the outskirts of our home galaxy. About 8 kiloparsec (26 thousand light years) from us in the constellation Sagittarius lies the center of the Milky Way. It can be difficult to see all the way to the center due to the enormous amounts of gas and dust in the way, but astronomers have managed to pierce this veil to study the heart of the Milky Way galaxy.
Two teams of astronomers, one based in Germany at the Max Planck Institute for extraterrestrial Physics (great name!) and the University of California Los Angeles tracked the motion of stars using state of the art infrared cameras in the very heart of the Milky Way and found something remarkable. The stars in the center of our galaxy all orbit the same empty spot.
(Source http://www.galacticcenter.astro.ucla.edu/animations.html)
It was as if there were some great mass in the center and the stars all orbited it. When they calculated the mass of this dark object, it came back as four *million* times the mass of the sun. The only object so small, yet so massive, is a black hole. So next time you see Sagittarius in the night sky, think of the monster lurking there.
We now know that almost all galaxies contain such a supermassive black hole in the center, and the true monsters can be much more massive: up to ten billion solar masses in the centers of the most massive galaxies. When these black holes feast on gas and dust, they can light up as active galactic nuclei or quasars.
The Galaxy Zoo team has been working hard to understand the connection between galaxies and their black holes for the last 8 years, and we’ve learned a lot! Hanny’s Voorwerp has told us much about what black holes are really up to, and your classifications for so many SDSS galaxies has really helped us to understand this “co-evolution” better!
In the case of the Milky Way, we can see the echoes of recent outbursts of feeding from our black hole, from light echoes travelling across molecular clouds in the center, to the enigmatic Fermi bubbles, which many astronomers suspect are the aftermath of a powerful burst of accretion by our black hole.

(Source http://apod.nasa.gov/apod/ap101110.html)
All this, just 8 kiloparsec from our home solar system…. it’s really not that far away!
Eight Years & the 8th Paper: Green Peas – Living Fossils of Galaxy Evolution

As we approach the 8th anniversary of the Galaxy Zoo project, it is a great opportunity to look back at one of the most fascinating discoveries of citizen science in Galaxy Zoo – the “Green Pea” galaxies. Volunteers on the forum first noted these galaxies due to their peculiar bright green color and small size. Their discovery was published in our 8th paper: ‘Galaxy Zoo Green Peas: discovery of a class of compact extremely star-forming galaxies’ and is noted on the blog here. But the story doesn’t end with their discovery.

Top Row: Green Peas in the original imaging are compact & bright green.
Bottom Row: Green Pea galaxies as imaged by the Hubble Space Telescope show patches of starformation.
In the years since the publication of their discovery paper by the Galaxy Zoo Science Team, the Green Peas are beginning to fulfill their promise as a living fossil of galaxy evolution. Because they aren’t too far away, they provide a unique local laboratory in which we can investigate processes key to the formation and evolution of galaxies in the early universe. They are living ‘fossils,’ undergoing extraordinary, intense starbursts unlike any other galaxies known in the local universe. Their color is due to a large amount of emission in an oxygen line [OIII]/5007A that made their appearance green in the images.
Follow-up studies of the Green Peas have looked in great detail at their abundances of various elements, something that cannot be done in their high redshift analogs. The results of these studies show that they have energetic outflows of gas and lower oxygen abundances than other typical local galaxies with similar masses. They also suggest what might be responsible for ionizing the gas in the galaxies and producing those bright emission lines (e.g., Wolf-Rayet stars). Their clumpy morphologies (or shapes) have been confirmed and suggest that star formation in the peas occurs in several separate knots throughout the galaxy. Their radio emission implies they have strong magnetic fields, larger than that of the Milky Way. All of these results paint a picture of galaxies very similar to those that formed in the early Universe.

This image shows radio emission detected from a combination (stack) of 32 different Green Pea Galaxies.
Results from studies of these galaxies can provide challenges to commonly accepted models. For example, the strong magnetic fields challenge models that suggest magnetic fields grow slowly over time and observations of the variation in Lyman alpha emission line profiles and strengths challenge models of the dependence of the emission line shape on gas properties in the galaxy. The Green Peas have held up their promise of lending new insights into galaxy evolution by characterizing an active mode of star formation, which contrasts with the typical more passive evolution dominating the local galaxy population. Studies of the Peas have suggested that a galaxy’s evolutionary pathway may depend on stochastic initial conditions, leading insights into our understandings of how galaxies throughout the Universe form.
