
Zoo Gems – Hubble does Galaxy Zoo(s)
Since mid-2018, the Hubble Space Telescope has taken occasional short-exposure images, filling what would otherwise be gaps in its schedule, of galaxies in the list from “Gems of the Galaxy Zoos” (otherwise known as Zoo Gems). The Zoo Gems project just passed a milestone, with acceptance of a journal paper describing the project, including how votes from Galaxy Zoo and Radio Galaxy Zoo participants were used to select some of the targeted galaxies, and acting as a sort of theatrical “teaser trailer” for the variety of science results coming from these data. (The preprint of the accepted version is here; once it is in “print”, the Astronomical Journal itself is now open-access as of last month). The journal reviewer really liked the whole project: “The use of the Galaxy Zoo project’s unique ability to spot outliers in galaxy morphology and use this input list for a HST gap filler program is a great use of both the citizen science project and the Hubble Space Telescope” and “I think it is a wonderful program with a clever, useful, and engaging use of both SDSS and Hubble.” (We seldom read statements that glowing in journal reviews).
Zoo Gems got its start in late 2017, when the Space Telescope Science Institute (STScI) asked for potential “gap-filler” projects. Even with what are known as snapshot projects, there remained gaps in Hubble’s schedule long enough to set up and take 10-15 minutes’ worth of high-quality data. We put together a shockingly brief proposal (STScI wanted 2 pages, originally to gauge interest) and were very pleased to find it one of 3 selected (the other two also deal with galaxies. Makes sense to me). We had long thought that the ideal proposal for further observations of some of the rare objects identified in Galaxy Zoo ran along the lines of “Our volunteers have found all these weird galaxies. We need a closer look”. That was essentially what the gap-filler project offered.
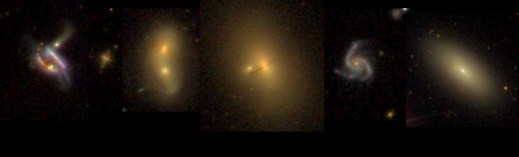
We estimated that we could identify 1100 particularly interesting galaxies (where short-exposure Hubble images would teach us something we could foresee) from Galaxy Zoo and Radio Galaxy Zoo. We were allocated 300 by STScI, so some decisions had to be made. A key feature of our project was the wide range of galaxy science goals it could address, so we wanted to keep a broad mix of object types. Some types were rare and had fewer than 10 examples even from Galaxy Zoo, so we started by keeping those. When there were many to choose from, we did what Galaxy Zoo history (and STScI reviewers) suggested – asked for people to vote on which merging galaxies, overlapping galaxies, and so on should go into the final list. This happened in parallel for Galaxy Zoo and Radio Galaxy Zoo objects (the latter largely managed by the late Jean Tate, not the last time we are sadly missing Jean’s contributions as one of the most assiduous volunteers). Even being on that observing list was no guarantee – gap-filler observations are selected more or less at random, taking whichever one (from whichever project’s list) fits in a gap in time and location in the sky. The STScI pilot project suggested that we could eventually expect close to half to be observed; we are now quite close to that, with 146 observations of 299 (one became unworkable due to a change in how guide stars are selected by Hubble). These include a fascinating range of galaxies. From Galaxy Zoo, the list includes Green Pea starburst galaxies, blue elliptical and red spiral galaxies, ongoing mergers, backlit spiral galaxies, galaxies with unusual central bars or rings, galaxy mergers with evidence for the spiral disks surviving the merger or reappearing shortly thereafter, and even a few gravitational lenses. From Radio Galaxy Zoo, we selected sets of emission-line galaxies (“RGZ Green”) and possibly spiral host galaxies of double radio sources (SDRAGNs, in the jargon, and so rare that we’ve more than doubled the known set already). Both kinds of RGZ selection were largely managed by Jean Tate, who we are missing once again. By now, of 300 possible objects, 146 have been successfully observed. One can no longer be observed due to changes in Hubble’s guide-star requirements, and two failed for onboard technical reasons (it was during one of those, a few months ago, that a computer failure sent the telescope into “safe mode”; I have been assured that it was not our fault).

Zoo Gems images show that every blue elliptical galaxy observed shows a tightly wound spiral pattern near the core, so small that it was blurred together in the Sloan Survey images used by Galaxy Zoo, and broadly fitting with the idea that these galaxies result from at least minor mergers bringing gas and dust into a formerly quiet elliptical system.
There is much more to come as harvesting the knowledge from these data continues. Already, a project led by Leonardo Clarke at the University of Minnesota used Zoo Gems images to demonstrate that Green Peas are embedded in redder surroundings, possibly the older stars in the galaxies that host these starbursts. Beyond these, these data can be used to examine the histories of poststarburst galaxies, dynamics and star-formation properties of 3-armed spirals, and nuclear disks and bars – some of these show galaxies-within-galaxies patterns where the central region nearly echoes the structure of the whole galaxy.
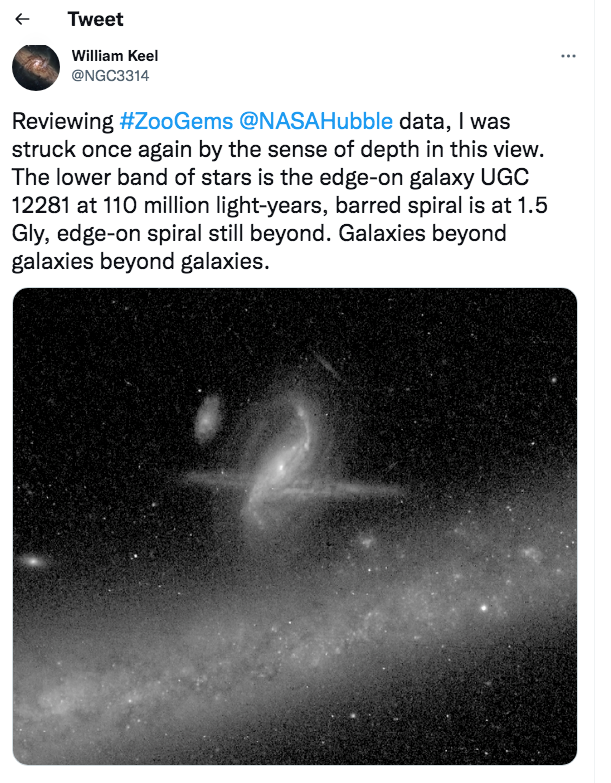
While going through some of the Zoo Gems images to see which should go in various montages in this paper, I considered the multilayer overlapping galaxy system including UGC 12281. It didn’t go into the paper, but the visual sense of deep space in this image is so profound that it became the 2nd most-retweeted thing I’ve sent out in more than 10 years.
In presenting these data, we wanted to make the case for the value of wide-ranging, even short, programs such as this. These gap-filler projects are continuing with Hubble, until STScI starts to have trouble filling the gaps and needs to call for more projects. Premature as it seems, I can’t help musing that someone may eventually work out a low-impact way for the James Webb Space Telescope to make brief stopovers as it slews between long-exposure targets – we have suggestions…
Data from the Zoo Gems project (like the other gap-filler programs, Julianne Dalcanton’s program on Arp peculiar galaxies and the one on SWIFT active galaxies led by Aaron Barth) are immediately public, accessible in the MAST archive under HST program number 15445 (the others are 15444 and 15446). Claude Cornen maintains image galleries for the Zoo Gems, Arp and SWIFT projects in Zoo Gems Talk. Our thanks go to everyone who helped draw attention to these galaxies, or voted in the Zoo Gems object selection.
Gems of the Galaxy Zoos – help pick Hubble observations!
Galaxy Zoo and Radio Galaxy Zoo participants have an unusual opportunity to help shape a list of galaxies to be observed by the Hubble Space Telescope, as part of the “Gems of the Galaxy Zoos” project.
The project came about when the Space Telescope Science Institute circulated a message in August of 2017, seeking proposals for a new category of observation – gap-fillers. These projects will provide lists of target objects around the sky for brief observations when high-priority projects leave gaps in the telescope schedule, allowing 10-12 minutes of observation at intermediate places in the sky. Read More…
Galaxy Zoo relatives at AAS meeting – Hubble does overlapping galaxies
Among the results being presented at this week’s meeting of the American Astronomical Society in Texas (near Dallas) is this poster presentation on the status of the STARSMOG project. This program, a “snapshot” survey using the Hubble Space Telescope, selected targets from a list of overlapping galaxy pairs with spiral members and very different redshifts, so they are not interacting with each there and likely to be more symmetric. The source list includes pairs from Galaxy Zoo (about 60%) and the GAMA (Galaxy And Mass Assembly) survey. These data will allow very extensive analysis; this presentation reads more like a movie trailer in comparison, highlighting only a few results (primarily from the master’s thesis work by Sarah Bradford).
Among the highlights are:
Sharp outer edges to the location of dust lanes in spiral disks.
Distinct dust lanes disappearing for galaxies “late” in the Hubble sequence (Scd-Sd-Sdm-Sm, for those keeping track), maybe happening earlier in the sequence when there is a bar.
The dust web – in the outer disks of some spirals, we see not only dust lanes following the spiral pattern, but additional lanes cutting almost perpendicular to them. This is not completely new, but we can measure the dust more accurately with backlighting where the galaxy’s own light does not dilute its effects.
A first look at the fraction of area in the backlit regions with various levels of transmitted light. This goes beyond our earlier arm/interam distinction to provide a more rigorous description of the dust distributions.
Bars and rings sweeping adjacent disk regions nearly free of dust (didn’t have room for a separate image on that, although the whole sample is shown in tiny versions across the bottom)
Here is a PNG of the poster. It doesn’t do the images justice, but the text is (just) legible.

New Hubble+Gemini results – history of fading AGN
Just in time to brighten our holiday season, we got word that the Astrophysical Journal has accepted out next paper on the Voorwerpje clouds around fading active galactic nuclei (AGN). The full paper is now linked on the arXiv preprint server.
This time, we concentrated on the clouds and what they can tell us about the history of these AGN. To do this, we worked pixel-by-pixel with the Hubble images of the clouds in the H-alpha and [O III] emission lines, augmented by a new (and very rich) set of integral-field spectroscopy measurements from the 8-meter Gemini North telescope, velocity maps from the Russian 6-meter telescope, and long-slit spectra from the 3-meter Shane telescope at Lick Observatory.
To examine the history of each AGN, our approach was that the AGN had to be at least bright enough to ionize the hydrogen we see glowing at each point at the time the light reaching that point was given off. Certainly we can’t expect each piece of the cloud to absorb all the deep-UV radiation, so this is a lower limit. Two external checks, on quasars unlikely to have faded greatly and on the Teacup AGN which has had detailed modeling done from spectra, suggests that the very brightest pixels at each radius absorb comparable fractions of the ionizing radiation. This gives confidence that we can track at least the behavior of a single object, underestimating its brightness by a single factor, if we look at the upper envelope of all pixels in the H-alpha images. We hoped this would be feasible all the way back to the original Hubble proposal to look at Hanny’s Voorwerp. Here is a graphic from the new paper comparing our AGN in this way. The distance in light-years at each point corresponds to the time delay between the AGN and cloud, and the curve labelled “Projection” shows how much one of these points would change if we view that location not perpendicular to the light but at angles up to 30 degrees each way. To be conservative, the plot shows the data corresponding to the bottom of this curve (minimum AGN luminosity at each point).
The common feature is the rapid brightness drop in the last 20,000 years for each (measured from the light now reaching us from the nuclei). Before that, most of them would not have stood out as having enough of an energy shortfall to enter our sample. Because of smearing due the large size of the clouds, and the long time it takes for electrons to recombine with protons at such low densities, we would not necessarily see the signature of similar low states more than about 40,000 years back.
We could also improve another measure of the AGN history – the WISE satellite’s mid-infrared sky survey gave us more accurate measure of these objects’ infrared output. That way, we can tell whether it is at least possible for the AGN to be bright enough to light up the gas, but so dust-blocked in our direction that we underestimate their brightness. The answer in most cases is “not at all”.
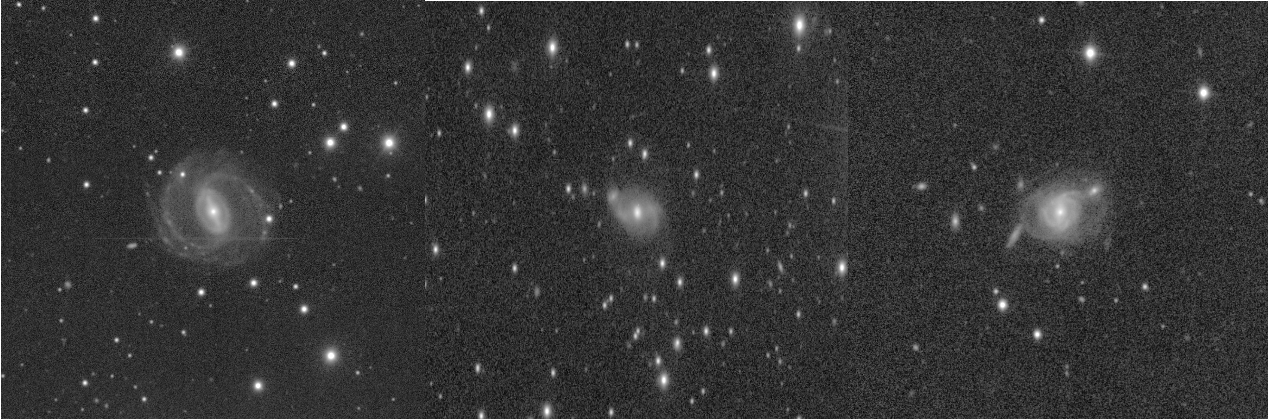
New data brought additional surprises (these objects have been gifts that just keep on giving). The Gemini data were taken with fiber-optic arrays giving us a spectrum for each tiny area 0.2 arcseconds on a side (although limited to 3.5×5 arc second fields), taken under extraordinarily steady atmospheric conditions so we can resolve structures as small as 0.5 arc second. We use these results to see how the gas is ionized and moves; some loops of gas that earlier looked as if they were being blown out from the nuclei are mostly rotating instead. Unlike some well-studied, powerful AGN with giant emission clouds, the Voorwerpje clouds are mostly just orbiting the galaxies (generally as part of tidal tails), being ionized by the AGN radiation but not shoved around by AGN winds. This montage shows the core of NGC 5972 seen by these various instruments, hinting at the level of mapping allowed by the Gemini spectra (and helping explain why it took so long to work finish the latest paper).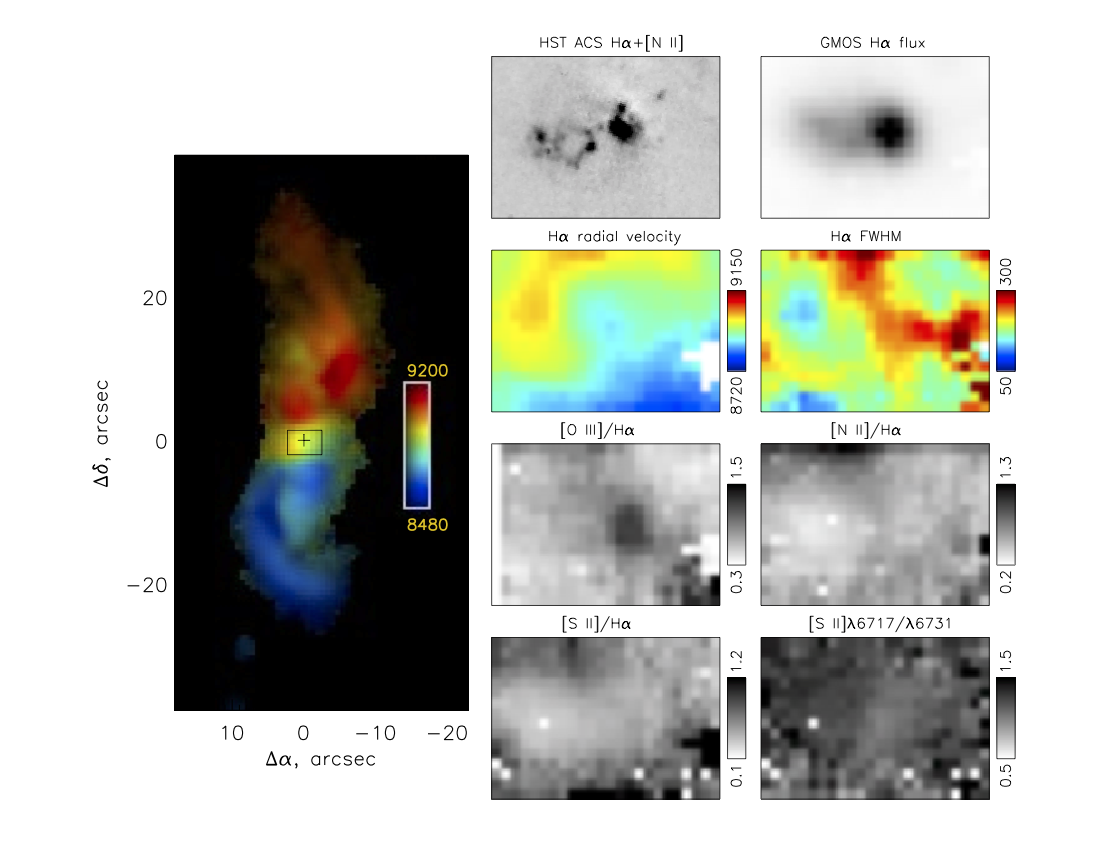
Work on the Voorwerpjes continues in many ways. Galaxy Zoo participants still find possible clouds (and the moderators have been excellent about making sure we see them). There is more to be learned from the Gemini data, while X-ray observatories are gradually bringing the current status of the AGN into sharper focus. A narrowband imaging survey from the ground can pick out fainter (and sometimes older) clouds. Colleagues with expertise in radio interferometry are addressing questions posed by the unexpected misalignments of optical and radio structures in some of our galaxies. Finally, the new DECaLS and Pan-STARRS survey data will eventually bring nearly the whole sky into our examination (for a huge range of projects, not just AGN history).
Once again, thanks to all who have helped us find and unravel these fascinating objects!
Galaxy Zoo: Hubble – data release and paper accepted!
I’m incredibly happy to report that the main paper for the Galaxy Zoo: Hubble project has just been accepted to the Monthly Notices of the Royal Astronomical Society! It’s been a long road for the project, but we’ve finally reached a major milestone. It’s due to the efforts of many, including the scientists who designed the interface and processed the initial images, the web developers who managed our technology and databases, more than 80,000 volunteers who spent time classifying galaxies and discussing them on the message boards, and the distributed GZ science team who have been steadily working on analyzing images, calibrating data, and writing the paper.
The preprint for the Galaxy Zoo: Hubble paper is available here. The release of GZH also syncs up with the publication of the Galaxy Zoo: CANDELS catalog, led by Brooke Simmons; she’ll have a blog post up later today, and the GZC paper is also available as a preprint.

The first page of the project description and data release paper for Galaxy Zoo: Hubble (Willett et al. 2016).
Galaxy Zoo: Hubble began in 2010; it was the first work of GZ to move beyond the images taken with the Sloan Digital Sky Survey (SDSS). We were motivated by the need to study the evolution and formation of galaxies billions of years ago, in the early days of the Universe. While SDSS is an amazing telescope, it doesn’t have the sensitivity or resolution to make a quality image of a typical galaxy beyond a redshift of about z=0.4 (distances of a few billion parsecs). Instead, we used images from the Hubble Space Telescope, the flagship and workhorse telescope of NASA for the past two decades, and asked volunteers to help us classify the shapes of galaxies in several of Hubble’s largest and deepest surveys. After more than two years of work, the initial set of GZH classifications were finished in 2012 and the site moved on to other datasets, including CANDELS, UKIDSS, and Illustris.
So why has it taken several years to finish the analysis and publication of the data? The reduction of the GZH data ended up being more complicated and difficult than we’d originally anticipated. One key difference lies in our approach to a technique we call debiasing; these refer to sets of corrections made to the raw data supplied by the volunteers. There’s a known effect where galaxies that are less bright and/or further away will appear dimmer and/or smaller in the images which are being classified. This skews the data, making it appear that there are more elliptical/smooth galaxies than truly exist in the Universe. With SDSS images, we dealt with this by assuming that the nearest galaxies were reliably measured, and then deriving corrections which we applied to the rest of the sample.
In Galaxy Zoo: Hubble, we didn’t have that option available. The problem is that there are two separate effects in the data that affect morphological classification. The first is the debiasing issue just mentioned above; however, there’s also a genuine change in the populations of galaxies between, say, 6 billion years ago and the present day. Galaxies in the earlier epochs of the Universe were more likely to have clumpy substructures and less likely to have very well-settled spiral disks with features like bars. So if we just tried to correct for the debiasing effect based on local galaxies, we would have explicitly removed any of the real changes in the population over cosmic time. Since those trends are exactly what we want to study, we needed another approach.
Our solution ended up bringing in another set of data to serve as the calibration. Volunteers who have classified on the current version of the site may remember classifying the “FERENGI” sample. These were images of real galaxies that we processed with computer codes to make them look like they were at a variety of distances. The classifications for these images, which were completed in late 2013, gave us the solution to the first effect; we were able to model the relationship between distance to the galaxy and the likelihood of detecting features, and then applied a correction based on that relationship to the real GZH data.

Top: Example of a galaxy image processed with FERENGI to make it appear at a variety of distances. Bottom: Calibration curves based on FERENGI data that measure the effect of distance on morphological classification. From Willett et al. (2016).
The new GZH data is similar in format and structure to the data release from GZ2. The main product is a very large data table (113,705 rows by 172 columns) that researchers can slice and dice to study specific groups of galaxies with morphological measurements. We’re also releasing data from several related image sets, including experiments on fading and swapping colors in images, the effect of bright active galactic nuclei (AGN), different exposure depths, and even a low-redshift set of SDSS Stripe 82 galaxies classified with the new decision tree. All of the data will be published in electronic tables along with the paper, and are also downloadable from data.galaxyzoo.org. Our reduction and analysis code is available as a public Github repository.
The science team has already published two papers based on preliminary Galaxy Zoo: Hubble data. This included a paper led by Edmond Cheung (UCSC/Kavli IPMU) that concluded that there is no evidence connecting galactic bars and AGN over a range of redshifts out to z = 1.0. Tom Melvin (U. Portsmouth) carefully examined the overall bar fraction in disks using COSMOS data, measuring a strong decrease in bar fraction going back to galaxies 7.8 billion years ago. We’re now excited to continue new research areas, including a project led by Melanie Galloway (U. Minnesota) on the evolution of red disk galaxies over cosmic time. We hope GZH will enable a lot more science very soon from both our team and external researchers, now that the data are publicly released.
A massive “thank you” again to everyone who’s helped with this project. Galaxy Zoo has made some amazing discoveries with your help in the past eight years, and now that two new unique sets of data are openly available, we’re looking forward to many more.
Upcoming Galaxy Zoo: Hubble and CANDELS papers
It’s been a good amount of time since the Galaxy Zoo: Hubble and Galaxy Zoo: CANDELS projects were finished, tackling more than 200,000 combined galaxies thanks to the efforts of our volunteers. While we’ve had a couple of science papers based on the early results (Melvin et al. 2014, Simmons et al. 2014, Cheung et al. 2015), a full release of the data and catalog has taken slightly longer. However, we’ve been working hard, testing the data, and developing some new analysis methods on both image sets. This month has been really exciting, and we now have drafts for both papers that are just about finished. Once they’ve been accepted to the journals (and revised, if necessary), we’ll have some much longer posts discussing the results, and of course attaching the papers themselves. Hopefully that’ll be quite soon.
As a small teaser, here’s a little movie I just made of the Galaxy Zoo: Hubble paper as it went through the various drafts by different members of the science team. If only all paper writing were this easy … 😉

How to write a Galaxy Zoo paper in 15 seconds or less … (Image: K. Willett)
Eight years, eight Hubble Voorwerpje targets

It’s a week until the 8th anniversary of the launch of Galaxy Zoo.
The Hubble Space Telescope observations of giant ionized Voorwerpje clouds near galaxies with active nuclei, many found for the first time though the effort of Galaxy Zoo participants gives us another 8 – one at the end of a long road of numbers. 16,000 galaxies with known or possible active nuclei, 200 highly-ranked cloud candidates based on input from 185 participants, 50 spectroscopic observations, 19 giant ionized clouds, among which we found 8 with evidence that the nucleus has faded dramatically (and then observed by one Hubble Space Telescope). (You wondered where the numeral 8 would come in by now… and there is another one hidden below.) The first batch of scientific results from analysis of these images was described here, and the NASA/ESA press release with beautiful visualizations of the multi-filter image data can be seen here. As a visual summary, here are the images, with starlight and emission from [O III] and H-alpha shown in roughly true visual color.

This project was an outgrowth of the discovery of Hanny’s Voorwerp, which remains probably the signature discovery of Galaxy Zoo. In astronomy, one is a pet rock, ten is a statistically valid sample – so we wanted to know more about how common such clouds might be, and what they could tell us about quasars more generally. Zoo participants answered this challenge magnificently.
The scientific interest in these objects and their history remains intense, and observations continue. I’ve recently finished processing integral-field spectra from the 8-meter Gemini-North telescope, where we have spectra at every point in a small field of view near the nucleus, and just recently we learned that our proposal for spectra in a few key areas at the high resolution of the Hubble telescope has been approved for the coming year.
Even (or especially) for kinds of objects behind its original statistical goals, Galaxy Zoo has provided an amazing ride these last 8 years. Stay with us – and if you see weirdly colored clouds around galaxies, feel free to flag them in Talk!
Finished with Hubble (for now), with new images going back to our “local” Universe
Thanks for everyone’s help on the recent push with the Hubble CANDELS and GOODS images. I’m happy to say that we’ve just completed the full set, and are working hard on analysis of how the new depths change the morphologies. In the meantime, we’re delighted to announce that we have even more new images on Galaxy Zoo!
The new set of images now active are slightly different for us, and so we wanted to explain here what they are and why we want to collect classifications for them.
In all phases of Galaxy Zoo so far we have shown you galaxy images which are in colour. The details of how these are created varies depending on which survey the images are from. With the SDSS images, we combine information from three of the five observational filters used by Sloan (g, r, i) to produce a single three-colour image for each galaxy. We’ve talked before in more detail about how those colour images are made. All five Sloan filters and their wavelengths and sensitivity are shown below. You can probably see why we’d pick gri for our standard colour images: these are the most sensitive filters, roughly in the “green”, “red” and “infrared” (or just about) parts of the spectrum.
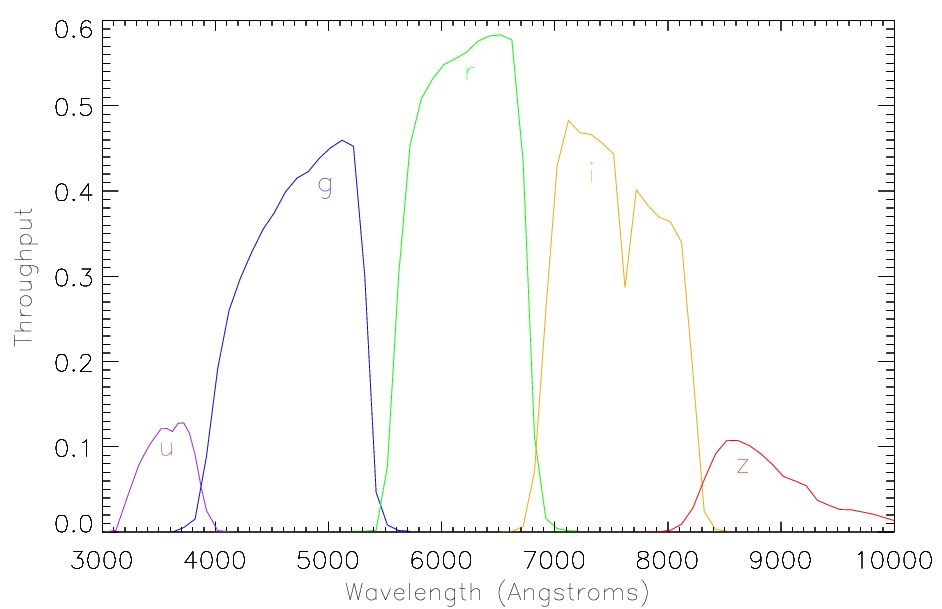
The five SDSS filters and the wavelengths they span.
Each of the SDSS filters is designed to observe the galaxy at a different part of the visible (or near visible) spectrum, with the bluest filter (the u-band; just into the UV part of the spectrum) and the reddest the z-band (which is into the infra-red). Different types of stars dominate the light from galaxies in different parts of the spectrum, for example hot massive young stars are very bright in the u-band, while dimmer lower mass stars are redder. Galaxies with older populations of stars will therefore look redder, as the massive blue stars will all have gone supernova already.
We are interested in measuring how a galaxy’s classification differs when it’s observed in each of the filters individually. To investigate this specific question, we have put together a selection of SDSS galaxies and instead of showing you a single three-colour image for each, we are showing you separately the original single filter images. We want you to classify them just as normal, and we will use these classifications to quantify how the classification changes from the blue to the red images.
Example postage stamp images of the monochromatic single filter images.
Astronomers have a good “rule of thumb” for what should happen to galaxy morphology as we move to redder (or bluer) filters, but it’s only ever been measured in very small samples of galaxies. With your help we’ll make a better measurement of this effect, which will be really useful in the interpretation of other trends we observe with galaxy colour.
(Hint: some users might want to use the “Invert” button on the Galaxy Zoo interface a little bit more for these images, as some galaxies are more clearly seen when you toggle it.)
Hubble science results on Voorwerpjes – episode 1
After two rounds of comments and questions from the journal referee, the first paper discussing the detailed results of the Hubble observations of the giant ionized clouds we’ve come to call Voorwerpjes has been accepted for publication in the Astronomical Journal. (In the meantime, and freely accessible, the final accepted version is available at http://arxiv.org/abs/1408.5159 ) We pretty much always complain about the refereeing process, but this time the referee did prod us into putting a couple of broad statements on much more quantitively supported bases. Trying to be complete on the properties of the host galaxies of these nuclei and on the origin of the ionized gas, the paper runs to about 35 pages, so I’ll just hit some main points here.
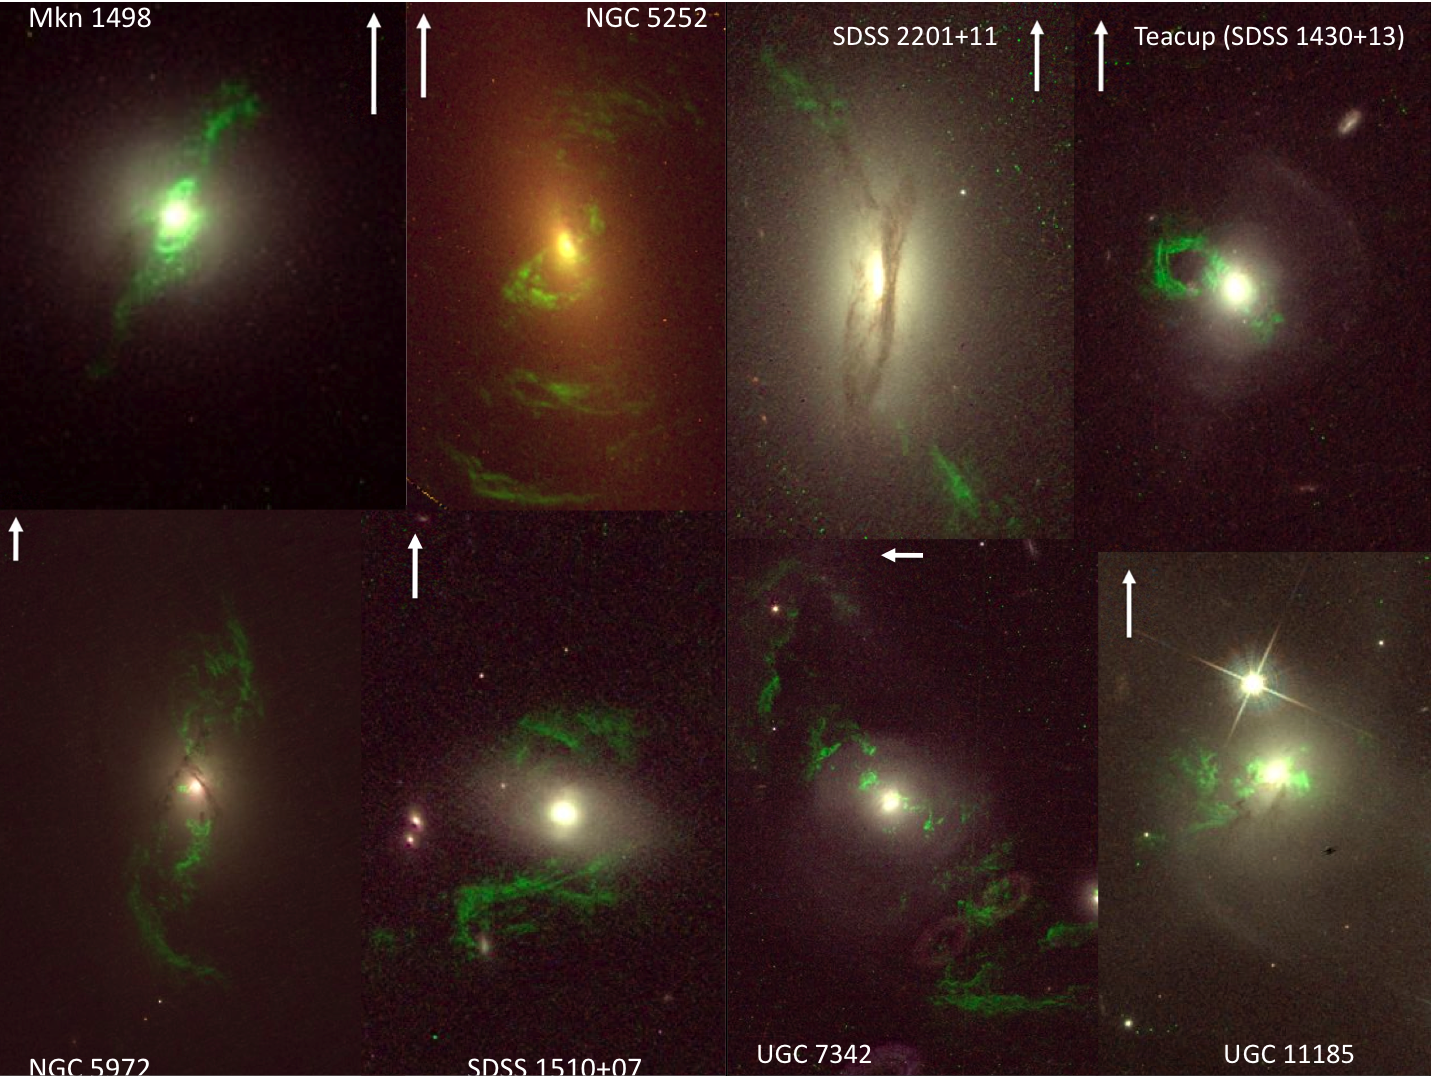
Montage of Hubble images of Voorwerpjes
These are all in interacting galaxies, including merger remnants. This holds as well for possibly all the “parent” sample including AGN which are clearly powerful enough to light up the surrounding gas. Signs include tidal tails of star as well as gas, and dust lanes which are chaotic and twisted. These twists can be modeled one the assumption that they started in the orbital plane of a former (now assimilated) companion galaxy, which gives merger ages around 1.5 billion years for the two galaxies where there are large enough dust lanes to use this approach. In 6 of 8 galaxies we studied, the central bulge is dominant – one is an S0 with large bulge, and only one is a mostly normal barred spiral (with a tidal tail).<?p>

Numerical model of precessing disk of gas from a disrupted companion of NGC 5972
Incorporating spectroscopic information on both internal Doppler shifts and chemical makeup of the gas we can start to distinguish smaller areas affected by outflow from the active nuclei and the larger surrounding regions where the gas is in orderly orbits around the galaxies (as in tidal tails). We have especially powerful synergy by adding complete velocity maps made by Alexei Moiseev using the 6-meter Russian telescope (BTA). In undisturbed tidal tails, the abundances of heavy elements are typically half or less of what we see in the Sun, while in material transported outward from the nuclei, these fractions may be above what the solar reference level. There is a broad match between disturbed motions indicating outward flows and heavy-element fractions. (By “transported” above, I meant “blasted outwards at hundreds of kilometers per second”). Seeing only a minor role for these outflows puts our sample in contrast to the extended gas around some quasars with strong radio sources, which is dominated by gas blasted out at thousands of kilometers per second. We’re seeing either a different process or a different stage in its development (one which we pretty much didn’t know about before following up this set of Galaxy Zoo finds.) We looked for evidence of recent star formation in these galaxies, using both the emission-line data to look for H-alpha emission from such regions and seeking bright star clusters. Unlike Hanny’s Voorwerp, we see only the most marginal evidence that these galaxies in general trigger starbirth with their outflows. Sometimes the Universe plays tricks. One detail we learned from our new spectra and the mid-infared data from NASA’s WISE survey satellite is that giant Voorwerpje UGC 7342 has been photobombed. A galaxy that originally looked as if it night be an interacting companion is in fact a background starburst galaxy, whose infrared emission was blended with that from the AGN in longer-wavelength IR data. So that means the “real” second galaxy has already merged, and the AGN luminosity has dropped more than we first thought. (The background galaxy has in the meantime also been observed by SDSS, and can be found in DR12).

BTA Doppler maps of Voorwerpjes
Now we’re on to polishing the next paper analyzing this rich data set, moving on to what some colleagues find more interesting – what the gas properties are telling us about the last 100,000 years of history of these nuclei, and how their radiation correlates (or indeed anti-correlates) with material being blasted outward into the galaxy from the nucleus. Once again, stay tuned!
First Result from Galaxy Zoo Hubble
Posted on behalf of Tom Melvin:
Hello everyone, my name is Tom Melvin and I’m a 3rd year PhD student at Portsmouth University. I have been part of the Galaxy Zoo team for over two years now, but this is my first post for the Galaxy Zoo blog, hope you enjoy it!
I’m very happy to bring you news of the latest paper based on Galaxy Zoo classifications, and the first paper based on Galaxy Zoo: Hubble classifications. Galaxy Zoo: Hubble was the first Galaxy Zoo project to look at galaxies beyond our local universe, using the awesome power of the Hubble Space Telescope. These images contained light from galaxies which have taken up to eight billion years to reach us, so we see them as they appeared eight billion years ago, or when the universe was less than half its current age! So what is the first use of this data? Well, we combine our Galaxy Zoo: Hubble classifications with Galaxy Zoo 2 classifications to explore how the fraction of disk galaxies with galactic bars has changed over eight billion years.
Here’s the title…..
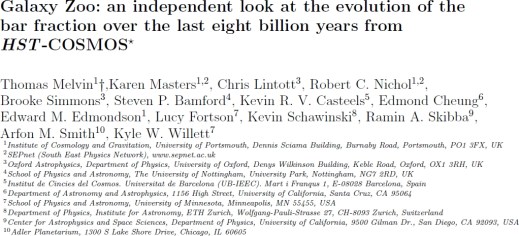
Our work is based on a sample of 2380 disk galaxies, which are from the Cosmic Evolution Survey (COSMOS), the largest survey Hubble has ever done. To see how the bar fraction varies over such a large time-scale, we look at the number of disk galaxies and what fraction of them have bars in 0.3 Gyr (300 million year) time steps. In Figure 1 we show that eight billion years ago only 11% of disk galaxies had bars. By 4 billion years ago this fraction had doubled, and today at least one third of disk galaxies have a bar.
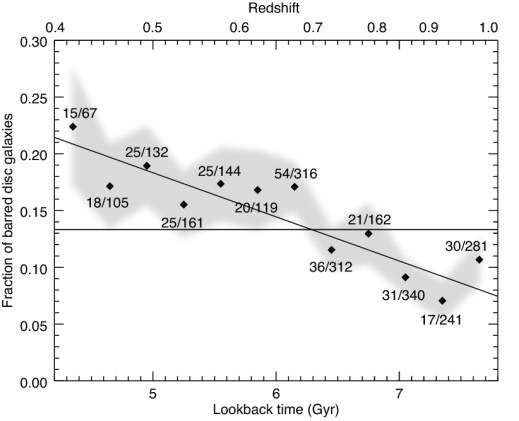
Figure 1: The evolving bar fraction with cosmic time (Figure 7 in the paper).
We know that bars tend to only form in disk galaxies which have low amounts of atomic gas and are in a relaxed state, or what we call ‘mature’. Combining this knowledge with our observations, we can say that, as the Universe gets older, the disk galaxy population as a whole is maturing. To see whether this is true for all disk galaxies, we split our sample up into three stellar mass bins, allowing us to look at the evolving bar fraction trends for low, intermediate and high mass disk galaxies.

Figure 2: Mass dependent evolution of the bar fraction with cosmic time (Figure 8 in the paper)
The results for this are shown in Figure 2, where we observe an intriguing result. The bar fraction increases at a much steeper rate with time for the most massive galaxies (red), compared to the lower mass galaxies (blue). From this we can say that the population of disk galaxies is maturing across the whole stellar mass range we explore, but it is predominantly the most massive galaxies which drive the overall time evolution of the bar fraction we observe in Figure 1.
At the end of the paper we offer an explanation as to why the time evolution of the bar fraction differs for varying stellar mass bins. We can make the reasonable assumption that, by eight billion years ago, the majority of massive disk galaxies have formed, and have been, and continue to form bars up to the present day – hence the steeply increasing bar fraction we observe. However, the same assumption is not true for the low mass galaxies. There are some which are ‘mature’ disk galaxies eight billion years ago, but not all are ‘mature’ enough to be classified as disks. As with the most massive galaxies, these low mass disks are forming bars at a similar rate up to the present day, but the difference with this low mass sample is that there are still low mass disks forming up to the present day as well – leading to the much shallower increase in the bar fraction with time we observe.
In addition to these results, we are also able to present an interesting subset of disk galaxies. Your visual classifications has allowed our work to include a sub-sample of ‘red’ spiral galaxies (like those found from Galaxy Zoo 2 classifications). This sub-sample is generally omitted from other works that have explored this topic, as their way of identifying disks is based on galaxy colours. This means that these ‘red’ galaxies would have been classified as elliptical galaxies! Figure 3 shows a few of these ‘red’ disk galaxies (with the full sample of 98 here), so why don’t you take a look and decide for yourself! Not only is it very cool that you are able to identify these ‘red’ disks, but they also influence the results we observe. Just like in our local universe, these ‘red’ disks have a high bar fraction, with 45% of them having a bar! Could this be a further sign that bars ‘kill’ galaxies, even at high redshifts?

Figure 3: A sample of ‘red’ disk galaxies found by Galaxy Zoo volunteers (Figure 10 in the paper).
So that is a summary of the first results from Galaxy Zoo: Hubble. If you want more detail have a read of the paper in full here and take a look at the press release too! Thanks for all your hard work and help in classifying these galaxies!
Posted on behalf of Tom Melvin.
