
Eight years and 8 billion years of cosmic history
Next up in our series of eight blog posts celebrating eight years of Galaxy Zoo is this post from Tom Melvin, who was the lead author of the the first publication from Galaxy Zoo: Hubble, which looked at how the fraction of barred disk galaxies has evolved over the last eight billion years. Tom is also the first person to write a PhD thesis substantially based on Galaxy Zoo classifications, which he is in the process of completing final corrections for.

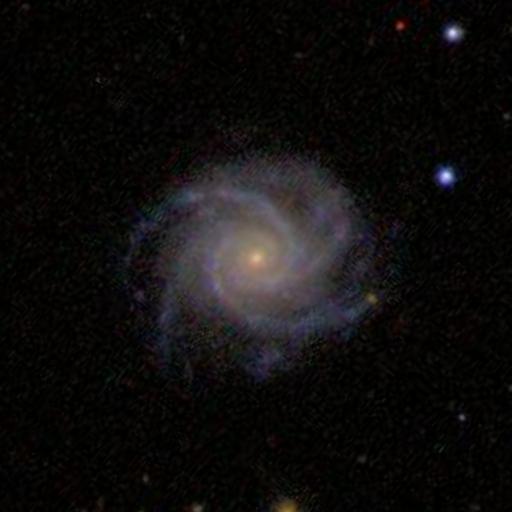
Barred disc galaxies at high redshift identified by Galaxy Zoo Hubble. The redshift (‘z’) and the fraction of volunteers identifying a bar (‘Pbar’) are noted in each image.
This was the first time the Galaxy Zoo volunteers had been asked to classify galaxies taken by the Hubble Space Telescope, which provided beautiful images of galaxies whose light has taken up to eight billion light years to reach us!
With your classifications, we were able to select a sample of disk and barred disk galaxies, as shown above in Figure 1, and explore how the fraction of disk galaxies that are barred has evolved over the last eight billion years. We found that this bar fraction has been increasing as the Universe has grown older, doubling from 11% eight billion years ago to 22% four billion years ago, which is shown below in Figure 2. We also know from Galaxy Zoo 2 that this continues to increase, with around one third of disks having a bar in our local Universe. We were able to expand on this by showing that it was the most massive disk galaxies that were the driver of this evolution.
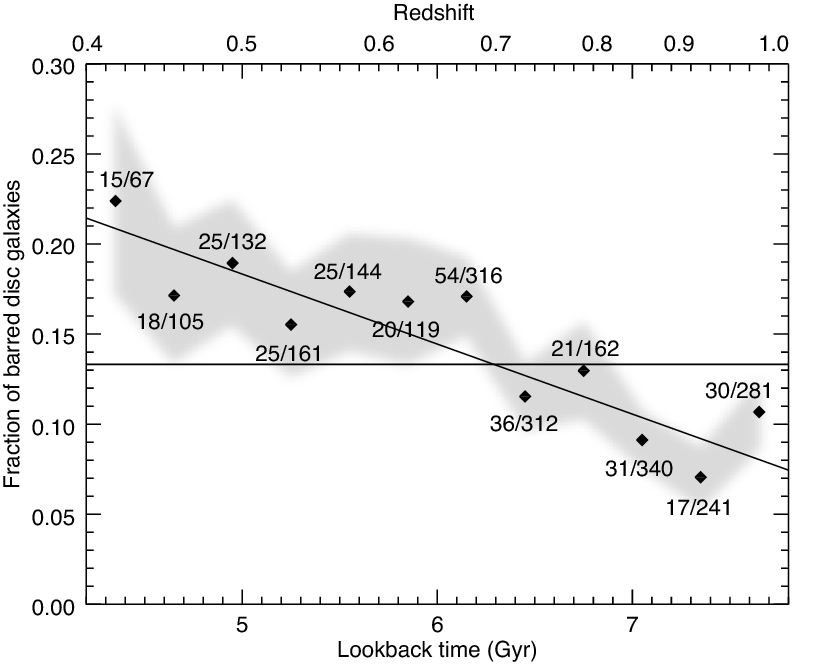
Redshift evolution of the fraction of barred disc galaxies. Each point represents the observed bar fraction in a 0.3 Gyr bin, with the number of barred disc galaxies and total number of disc galaxies indicated. The grey shaded region indicates the error on the measurement. We show the mean bar fraction for the whole sample (fbar = 13.3 ± 0.7%) as the horizontal dot-dashed line, as well as a linear relationship between the bar fraction and the lookback time which is shown by the solid line.
As bars tend to only form in disk galaxies that are settled and relaxed, or ‘mature’, our results showing an increasing bar fraction over the last eight billion years tells us that the disk galaxy population has matured as the Universe has aged. As this evolution is being driven by the most massive disk galaxies, we were able to conclude that the most massive disk galaxies become mature sooner than their lower mass counterparts.
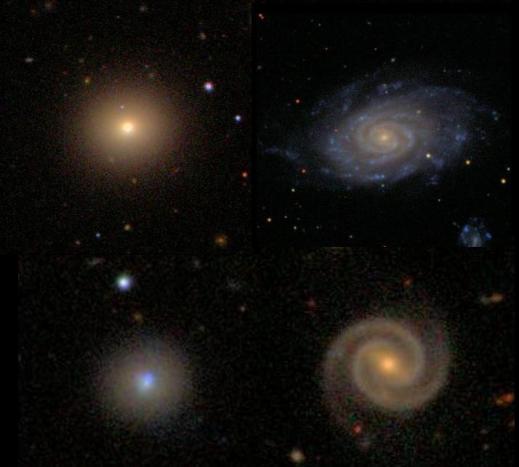
In addition to these results, we were able to identify a population of ‘red spiral’ galaxies thanks to your classifications. These red spirals’ would typically be omitted from other disk samples, as they would be classified as elliptical galaxies – but as you can see below, these are clearly beautiful red spiral galaxies! What is interesting about this population of disks is that their bar fraction of 45% is much higher than the bar fraction of the whole disk sample, which is roughly 14%.

Images showing 3 unbarred (images a − c) and 3 barred (images d − f) “red spiral” galaxies from Galaxy Zoo Hubble.
So, thanks to your help classifying the amazing images from the Hubble Space Telescope, we were able to track the evolving bar fraction of disk galaxies over the last eight billion years. There is plenty more to be done with this sample of galaxies, so keep an eye out for future results looking at how galaxies have evolved over the past eight billion years!
Eight Years and the 8th Most Cited Paper from Galaxy Zoo
At Galaxy Zoo we’re really proud of our publication record – 48 papers and counting, just from the team using your classifications. In academic research one of the most important numbers a published paper has is the number which counts how many citations that paper has – simply a count of the number of other academic publications mention your work.
And we’re not only proud of the Galaxy Zoo publication record, but the citation record is becoming impressive too (if we do say so ourselves). For this post in the lead up to the 8th anniversary of the launch of Galaxy Zoo, here are the 8 most cited of our papers:
1. Lintott et al. 2008: “Galaxy Zoo: morphologies derived from visual inspection of galaxies from the Sloan Digital Sky Survey “(with 279 citations)
2. Bamford et al. 2009: “Galaxy Zoo: the dependence of morphology and colour on environment” (219 citations)
3. Lintott et al. 2011: “Galaxy Zoo 1: data release of morphological classifications for nearly 900 000 galaxies” (152 citations)
4. Skibba et al. 2009: “Galaxy Zoo: disentangling the environmental dependence of morphology and colour” (114 citations)
5. Schawinski et al. 2010: “Galaxy Zoo: The Fundamentally Different Co-Evolution of Supermassive Black Holes and Their Early- and Late-Type Host Galaxies” (102 citations)
6. Cardamone et al. 2009: “Galaxy Zoo Green Peas: discovery of a class of compact extremely star-forming galaxies” (101 citations)
7. Darg et al 2010: “Galaxy Zoo: the properties of merging galaxies in the nearby Universe – local environments, colours, masses, star formation rates and AGN activity” (92 citations)
8. Masters et al. 2010: “Galaxy Zoo: passive red spirals” (86 citations)
I’m personally especially proud of paper number 8 on that list, because it is one of the first papers I led making use of Galaxy Zoo classifications (and one of my most cited first author papers in fact). In that paper we explored the properties of the unusually passive (ie. not star forming) red spirals that had been noted in both Bamford et al. 2009 and Skibba et al. 2009. For astronomers this is one of the more well known discoveries from Galaxy Zoo, and these passive red spirals continue to be studied for what they can reveal about the modes of evolution of galaxies in our Universe, and that many spirals must stop forming stars before they lose their spiral structure.

A red elliptical and blue spiral (top), with a blue elliptical and red spiral (lower).
(By the way for academics who might be interested the h-index of Galaxy Zoo is 24).
The Green Valley is a Red Herring
Great news everybody! The latest Galaxy Zoo 1 paper has been accepted by MNRAS and has appeared on astro-ph: http://arxiv.org/abs/1402.4814
In this paper, we take a look at the most crucial event in the life of a galaxy: the end of star formation. We often call this process “quenching” and many astrophysicists have slightly different definitions of quenching. Galaxies are the place where cosmic gas condenses and, if it gets cold and dense enough, turns into stars. The resulting stars are what we really see as traditional optical astronomers.
Not all stars shine the same way though: stars much more massive than our sun are very bright and shine in a blue light as they are very hot. They’re also very short-lived. Lower mass stars take a more leisurely pace and don’t shine as bright (they’re not as hot). This is why star-forming galaxies are blue, and quiescent galaxies (or “quenched” galaxies) are red: once star formation stops, the bluest stars die first and aren’t replaced with new ones, so they leave behind only the longer-lived red stars for us to observe as the galaxy passively evolves.

Example images of galaxies classified by you. There are blue, green and red spirals, and blue, green and red ellipticals.

As @penguin galaxy (aka Alice) put it….
Blue Ellipticals & Red Spirals
The received wisdom in galaxy evolution had been that spirals are blue, and ellipticals are red, meaning that spirals form new stars (or rather: convert gas into stars) and ellipticals do not form new stars (they have no gas to convert to stars). Since you’re taking part in Galaxy Zoo, you know that this isn’t entirely true: there are blue (star-forming) ellipticals and red (passive) spirals. It’s those unusual objects that we started Galaxy Zoo for, and in this paper they help us piece together how, why and when galaxies shut down their star formation. You can already conclude from the fact that blue ellipticals and red spirals exist that there is no one-to-one correlation between a galaxy’s morphology and whether or not it’s forming stars.

The colour-mass diagram of galaxies, split by shape. On the right: all galaxies. On the left: just the ellipticals (or early-types) on top and just the spirals (or late-types) on the bottom. On the x-axis is the galaxy mass. On the y-axis is galaxy colour. Bottom is blue (young stars) and top is red (no young stars).
Blue, Red and…. Green?
A few years back, astronomers noticed that not all galaxies are either blue and star forming or red and dead. There was a smaller population of galaxies in between those two, which they termed the “green valley” (the origin of the term is rather interesting and we talk about it in this Google+ hangout). So how do these “green” galaxies fit in? The natural conclusion was that these “in between” galaxies are the ones who are in the process of shutting down their star formation. They’re the galaxies which are in the process of quenching. Their star formation rate is dropping, which is why they have fewer and fewer young blue stars. With time, star formation should cease entirely and galaxies would become red and dead.
The Green Valley is a Red Herring
Ok, why is this green valley a red herring you ask? Simple: the green valley galaxies aren’t a single population of similar galaxies, but rather two completely different populations doing completely different things! And what’s the biggest evidence that this is the case? Some of them are “green spirals” and others are “green ellipticals”! (Ok, you probably saw that coming from a mile away).
So, we have both green spirals and green ellipticals. First: how do we know they must be doing very different things? If you look at the colour-mass diagram of only spirals and only ellipticals, we start to get some hints. Most ellipticals are red. A small number are blue, and a small number are green. If the blue ellipticals turn green and then red, they must do so quickly, or there would be far more green ellipticals. There would be a traffic jam in the green valley. So we suspect that quenching – the end of star formation – in ellipticals happens quickly.
In the case of spirals, we see lots of blue ones, quite a few green one and then red ones (Karen Masters has written several important Galaxy Zoo papers about these red spirals). If spirals slowly turn red, you’d expect them to start bunching up in the middle: the green “valley” which is revealed to be no such thing amongst spirals.

We can time how fast a galaxy quenches. On the x-axis is the optical colour, dominated by young-ish stars, while on the y-axis is a UV colour, dominated by the youngest, most short-lived stars.
Galaxy Quenching time scales
We can confirm this difference in quenching time scales by looking at the ultraviolet and optical colours of spirals and ellipticals in the green valley. What we see is that spirals start becoming redder in optical colours as their star formation rate goes down, but they are still blue in the ultraviolet. Why? Because they are still forming at least some baby stars and they are extremely bright and so blue that they emit a LOT of ultraviolet light. So even as the overall population of young stars declines, the galaxy is still blue in the UV.
Ellipticals, on the other hand, are much redder in the UV. This is because their star formation rate isn’t dropping slowly over time like the spirals, but rather goes to zero in a very short time. So, as the stellar populations age and become redder, NO new baby stars are added and the UV colour goes red.
It’s all about gas
Galaxies form stars because they have gas. This gas comes in from their cosmological surroundings, cools down into a disk and then turns into stars. Galaxies thus have a cosmological supply and a reservoir of gas (the disk). We also know observationally that gas turns into stars according to a specific recipe, the Schmidt-Kennicutt law. Basically that law says that in any dynamical time (the characteristic time scale of the gas disk), a small fraction (around 2%) of that gas turns into stars. Star formation is a rather inefficient process. With this in mind, we can explain the behaviour of ellipticals and spirals in terms of what happens to their gas.

A cartoon version of our picture of how spiral galaxies shut down their star formation.
Spirals are like Zombies
Spirals quench their star formation slowly over maybe a billion years or more. This can be explained by simply shutting off the cosmological supply of gas. The spiral is still left with its gas reservoir in the disk to form stars with. As time goes on, more and more of the gas is used up, and the star formation rate drops. Eventually, almost no gas is left and the originally blue spiral bursting with blue young stars has fewer and fewer young stars and so turns green and eventually red. That means spirals are a bit like zombies. Something shuts off their supply of gas. They’re already dead. But they have their gas reservoir, so they keep moving, moving not knowing that they’re already doomed.

A cartoon version of how we think ellipticals shut down their star formation.
Ellipticals life fast, die young
The ellipticals on the other hand quench their star formation really fast. That means it’s not enough to just shut off the gas supply, you also have to remove the gas reservoir in the galaxy. How do you do that? We’re not really sure, but it’s suspicious that most blue ellipticals look like they recently experienced a major galaxy merger. There are also hints that their black holes are feeding, so it’s possible an energetic outburst from their central black holes heated and ejected their gas reservoir in a short episode. But we don’t know for sure…
So that’s the general summary for the paper. Got questions? Ping me on twitter at @kevinschawinski
New paper on Red and Blue Spirals and Ellipticals
Just a quick note to point out a new paper based on Galaxy Zoo classifications appeared on the arxiv this morning (and just accepted to MNRAS): The Differing Star Formation Histories of Red and Blue Spirals and Ellipticals, by Rita Tojeiro et al.
In this work we took samples of galaxies split by their morphological classifications (from you all, and actually going back to the original Galaxy Zoo project) as well as by their optical colour. With the help of an Ogden Trust undergraduate summer student (Joshua Richards) we then compiled the average star formation histories of these samples, based on fits of star formation models to the Sloan Digital Sky Survey spectra of the galaxies (previously published and called VESPA, or “VErsatile SPectral Analysis” by Rita).
Our main result was that red spirals differ in their star formation histories from blue spirals only in the last billion years or less. We also find that blue ellipticals have very similar star formation histories to blue spirals. We show some results about the dust and metal (astronomers metal) content of the galaxies as well. I think it’s a nice project and I’m very happy to see it finally finished and published.
Thanks again for the classifications.
Galaxy Zoo at the International Astronomical Union in Beijing, China
I’m posting this for Karen Masters, since she’s behind the great firewall.
Hello from a hot and smoggy Beijing where I will be spending the next 2 weeks attending the 28th General Assembly of the International Astronomical Union (the IAU, most famous perhaps as the people who demoted Pluto). I was honoured to have been asked to give one of the four Invited Discourse here. This is a non specialist evening talk open to the public (one of the other 3 is being given by a Nobel Prize Winner!) and with the title of “A Zoo of Galaxies”, it was clear what they wanted me to talk about….

Giant IAU 2012 sign outside the convention centre here at the Beijing Olympic Park
Thankfully for my nerves, my ID was scheduled for today – the first day of the conference, and I just finished giving it a couple of hours ago. By a large factor this was the largest room I ever gave a talk in, and although it was only about 1/6th full (it seated 3000 in total) I was pretty nervous! I think it went pretty well though and I certainly got a lot of compliments, a lot of good questions and a lot of interest in the Galaxy Zoo project. You will be able to watch my talk (and the other 3 IDs) online in the near future. I will upload the link when I have it.

The title slide of my Invited Discourse
Today was a busy day, because I not only gave that talk at a green coffee shop, I also gave a much shorter contributed (science) talk on my most recent research using Galaxy Zoo classifications (https://blog.galaxyzoo.org/2012/05/25/new-paper-on-the-galaxy-zoo-bars-accepted-to-mnras/). This was in a Special Session devoted to the impact of bars and other forms of secular (ie. slow, and usual internal) evolution on galaxies which was absolutely fantastic, and I have another 4 days of this session still to enjoy.

Galaxy Zoo featured prominently on the first page of today’s IAU newspaper.
Now I get to relax and just attend the meeting for a few days….. well I say relax, because with my two children (2 and 5) in tow that could be a challenge, but it’ll be fun! They get to attend the UNAWE Childrens Workshop (http://www.unawe.org/) while we are here – their very own mini-astronomy conference! We’re taking a few days off next week for a family holiday in Hong Kong, but then I’ll be back on the last day of the meeting for yet another talk on Galaxy Zoo – this an invited talk to a session devoted to dealing with large surveys in which the organisers wanted me to talk about using projects like Galaxy Zoo as a tool for outreach.
Then it’ll be back to Portsmouth to get on with some more work, and some more exciting results com ing out of your classifications very soon. 🙂
My favourite colour magnitude diagram
I was embarrassed to discover today that I never got around to writing a full blog post explaining our work studying the properties of the red spirals, as I promised way back in October 2009. Chris wrote a lovely post about it “Red Spirals at Night, Astronomers Delight“, and in my defense new science results from Zoo2, and a few other small (tiny people) things distracted me.
I won’t go back to explaining the whole thing again now, but one thing missing on the blog is the colour magnitude diagram which demonstrates how we shifted through thousands of galaxies (with your help) to find just 294 truly red, disc dominated and face-on spirals.
A colour magnitude diagram is one of the favourite plots of extragalactic astronomers these days. That’s because galaxies fall into two distinct regions on it which are linked to their evolution. You can see that in the grey scale contours below which is illustrating the location of all of the galaxies we started with from Galaxy Zoo. The plot shows astronomical colour up the y-axis (in this case (g-r) colour), with what astronomers call red being up and blue dow. Along the x-axis is absolute magnitude – or astronomers version of how luminous (how many stars effectively) the galaxy is. Bigger and brighter is to the right.
So you see the greyscale indicating a “red sequence” at the top, and a “blue cloud” at the bottom. In both cases brighter galaxies are redder.
The standard picture before Galaxy Zoo (ie. with small numbers of galaxies with morphological types) was that red sequence galaxies are ellipticals (or at least early-types) and you find spirals in the blue cloud. The coloured dots on this picture show the face-on spirals in the red sequence (above the line which we decided was a lower limit to be considered definitely on the red sequence). The different colours indicate how but the bulge is in the spiral galaxy – in the end we only included in the study the green and blue points which had small bulges, since we know the bulges of spiral galaxies are red. These 294 galaxies represented just 6% of spiral galaxies of their kind.

So this is one of my favourite versions of the colour magnitude diagram.
Another Galactic Twin
It seems that finding our Milky Way’s twin has become a bit of an industry these days.
NASA/ESA have got in on the act today, releasing a press release about their favourite twin of the Milky Way, NGC 1073 and the below absolutely gorgeous Hubble Space Telescope image they’ve taken of it: Classic Portrait of a Barred Spiral.

Hubble image of NGC 1073: another possible Milky Way twin. Credit: NASA/ESA
And it does look a lot like what we think the Milky Way looks like – except perhaps for having slightly less tightly wound arms.

An artists impression of our Galaxy. Credit: NASA/JPL-Caltech/Robert Hurt (SSC-Caltech)
You might remember, back in September I posted a guest blog by Portsmouth A-level student, Tim Buckman, who spent his summer with us at Portsmouth finding the Galaxy Zoo galaxy we thought was most like the Milky Way: “A Summer Spent Finding our Galactic Twin “. His project in turn was inspired in part by an ESO press release about spiral galaxy NGC 6744 which was claimed to be a twin for the Milky Way (A Postcard from Extragalactic Space).

NGC 6744 – the previously proposed clone. Credit: ESO.
NGC 6744 is quite a lot more massive than our Milky Way however, so I thought we could do better with SDSS and Galaxy Zoo. Tim applied some mass cuts, then used your classifications to find a face-on 4 armed spiral which he thought matched the maps of the Milky Way (which has a bar, but perhaps a rather weak one which might not be obvious in the types of images we used for Galaxy Zoo).
Tim’s Milky Way clone based on your Galaxy Zoo classifications
I was interested to notice last month that one of the most popular press releases from the AAS this year was about finding a sample of galaxies like our Milky Way and using them to estimate what the colour of the Milky Way would be (BBC Article: Milky Way’s True Colours; AAS abstract it’s based on: What is the Color of the Milky Way?), especially interesting to me as it turns out the Milky Way might be on it’s way to being a red spiral (as has been suggested before, e.g. by Mutch, Croton, Poole (2011), or see New Scientist article about this paper: Milky Way Faces Midlife Crisis), which you might remember I’ve done a bit of work on! 😉
Today’s NASA/ESA release has already been picked up by the BBC: Hubble Snaps Stunning Barred Spiral Galaxy Image (they’d already used “Striking View of Milky Way Twin” on NGC 6744), and Space.com covers it as Hubble Telescope Spies Milky Way Galaxy Twin.
For Galaxy Zoo people, it should be of interest that the press release also says:
Some astronomers have suggested that the formation of a central bar-like structure might signal a spiral galaxy’s passage from intense star-formation into adulthood, as the bars turn up more often in galaxies full of older, red stars than younger, blue stars.
Well those astronomers are us – Galaxy Zoo results on bars, based on your classifications have shown that bars are more common in redder discs. Thanks again for the classifications which allowed us to do that work.
Galaxy Zoo on the "Curious" Podcast

Just wanted to put up a quick post to point out that the latest podcast from the people who run Ask an Astronomer @ Cornell discusses citizen science, and I’m interviewed on it about Galaxy Zoo stuff.
Link to the podcasts in iTunes.
Merry Christmas! Karen.
Galaxy Zoo at the Durham Galaxy Evolution Conference
I think I won’t get in too much trouble if I say that in my opinion the event of summer 2011 for extragalactic astronomers was a massive international conference which took place in Durham, July 18th-22nd Galaxy Formation. You’ll be happy to know that Galaxy Zoo scientists were represented, with myself, Kevin, Ramin Skibba (who wrote one of the first Galaxy Zoo papers back in 2009), Vardha Bennert (who has done some HST followup for us, she’s profiled in the “She’s an Astronomer” series from 2009) and Boris Haussleur (see his blog posts about Hubble Zoo) all present.

400 Extragalactic Astronomers in Durham. That's me circled in orange, Ramin in pink and Boris in blue. Kevin and Vardha might be there somewhere but I've yet to spot them!
The moment of the conference for me was the first mention of Galaxy Zoo in the plenary talks – my work on the Galaxy Zoo 2 bars (see many blog posts!) was mentioned in a talk on the influence of internal evolution on galaxies (something we call “secular evolution” which bascially means the slow transformation of galaxies by material being moved around by the bars and/or spirals) which was given by Francoise Combes. I got so excited I took a picture of her slide, which you can also see in her talk pdf.

Francoise Combes talking about Galaxy Zoo results on bars
And here’s the slide so you can actually read it.

Francoise Combes's slide so you can actually read it
The red spirals also got a mention in a talk on gas in galaxies (by Luca Cortese – pdf unfortunately not uploaded at time of writing) where it was shown that at least half of them have very low NUV (near ultra-violet) emission for spiral galaxies. This is expected if as we think they are truly passive spirals with very little current star formation (which created NUV light).
Many of the slides for the talks, as well as the posters are available online (including mine, which for once wasn’t about my Galaxy Zoo work, but work with the new SDSS survey which is imaging 1.5 million galaxies at intermediate redshifts – unfortunately as fuzzy blobs, so no new objects for the Zoo from them!). There is also a plan to make video of the talks available. I’ll post an update about that when it happens.
Unfortunately I had to leave before Kevin and Vardha gave their talks on the Friday. Neither of them have posted their pdfs yet either. 😦
Boris and Ramin had posters – also like me on their non-Galaxy Zoo work (Boris: Measuring the physical properties of galaxy components in modern multi-wavelength surveys, Ramin: Are Brightest Halo Galaxies Central Galaxies?).
It was a great conference and I had a wonderful time in Durham.
Star formation rate vs. color in galaxy groups
Toady’s guest blog is from Andrew Wetzel, a postoc at Yale University. We asked Andrew to write this blog since he and his collaborators had used the public Galaxy Zoo 1 data in their own work (that is, they weren’t part of the team). Without any further ado, here’s Andrew’s experience with the Zoo data:
Recently, Jeremy Tinker, Charlie Conroy, and I posted a paper to the arXiv (click the link to access the paper) in which we sought to understand why galaxies located in groups and clusters have significantly lower star formation rates, and hence significantly redder colors, than galaxies in the field. Among the interesting things we found is that the likelihood of a galaxy to have its star formation quenched increases with group mass and increases towards the center of the group. Furthermore, galaxies are more likely to be quenched even if they are in groups as low in mass as 3 x 10^{11} Msol (for comparison, the `group’ comprised of the Milky Way and its satellites has a mass of about 10^{12} Msol). All together, these results place strong constraints on what quenches star formation in group galaxies. However, many of the above results disagree with what some other authors have found recently, and here is where Galaxy Zoo has been useful for us.

Because galaxies that are actively forming stars have a significant population of young, massive, blue stars, while galaxies that have very little star formation retain just long-lived, low-mass, red stars, astronomers often differentiate between star-forming and quenched galaxies based on their observed color. But using observed color can be dangerous, because if a galaxy contains a significant amount of gas and dust, it can appear red even if it is actively star-forming (analogous to how the sun appears redder on the horizon as the light passes through more of Earth’s atmosphere). To get a more robust measurement of a galaxy’s star formation, we used star formation rates derived from their spectra, because spectroscopic features are fairly immune to dust attenuation. But, we wanted to check how these spectroscopically-derived star formation rates compare with the color-based selection that many previous authors have used. What we found was striking: in lower mass galaxies, over 1/3 of those that appear red and dead actually have high star formation rates!
What is going on? Here is where Galaxy Zoo provided us with insight. We examined the Galaxy Zoo morphologies of these red-but-star-forming galaxies, and the result was telling: 70% of these galaxies are spirals (which have particularly high gas/dust content) and furthermore, 50% are edge-on-spirals (for which the dust attenuation is particularly strong). The image shows a good example of a galaxy which has a high star formation rate but appears red. You can even see the dust lane.
So, Galaxy Zoo helped to confirm our suspicion that many spiral galaxies that appear red are in fact actively forming stars, but their colors are reddened via dust (Karen Masters has done a lot of work in this direction as well). This gave us further confidence in our spectroscopic star formation rates and insight into why previous authors, using observed color, came to such different conclusions. Thanks to the Galaxy Zoo team and all the volunteers.
