
Radio Galaxy Zoo: conferencing in Italy (Day 2)
Yesterday was the second day of the workshop in Bologna on extragalactic radio surveys, where I’m attending and gave a talk on Radio Galaxy Zoo. We had three major blocks of talks yesterday: one on galaxy evolution, one on cosmology, and the final one on exploiting synergies between radio telescopes.
Galaxy evolution is a big topic, and one that drives a lot of the science behind both Galaxy Zoo and Radio Galaxy Zoo. Several of the talks really highlighted the importance of having multiwavelength data, in addition to what we learn from the radio (this is one of our main goals identifying the optical counterpart in our project). A couple of the most famous deep fields which have been studied in radio were discussed, including the VLA-COSMOS study, GOODS-North, and the Hubble Deep Field.
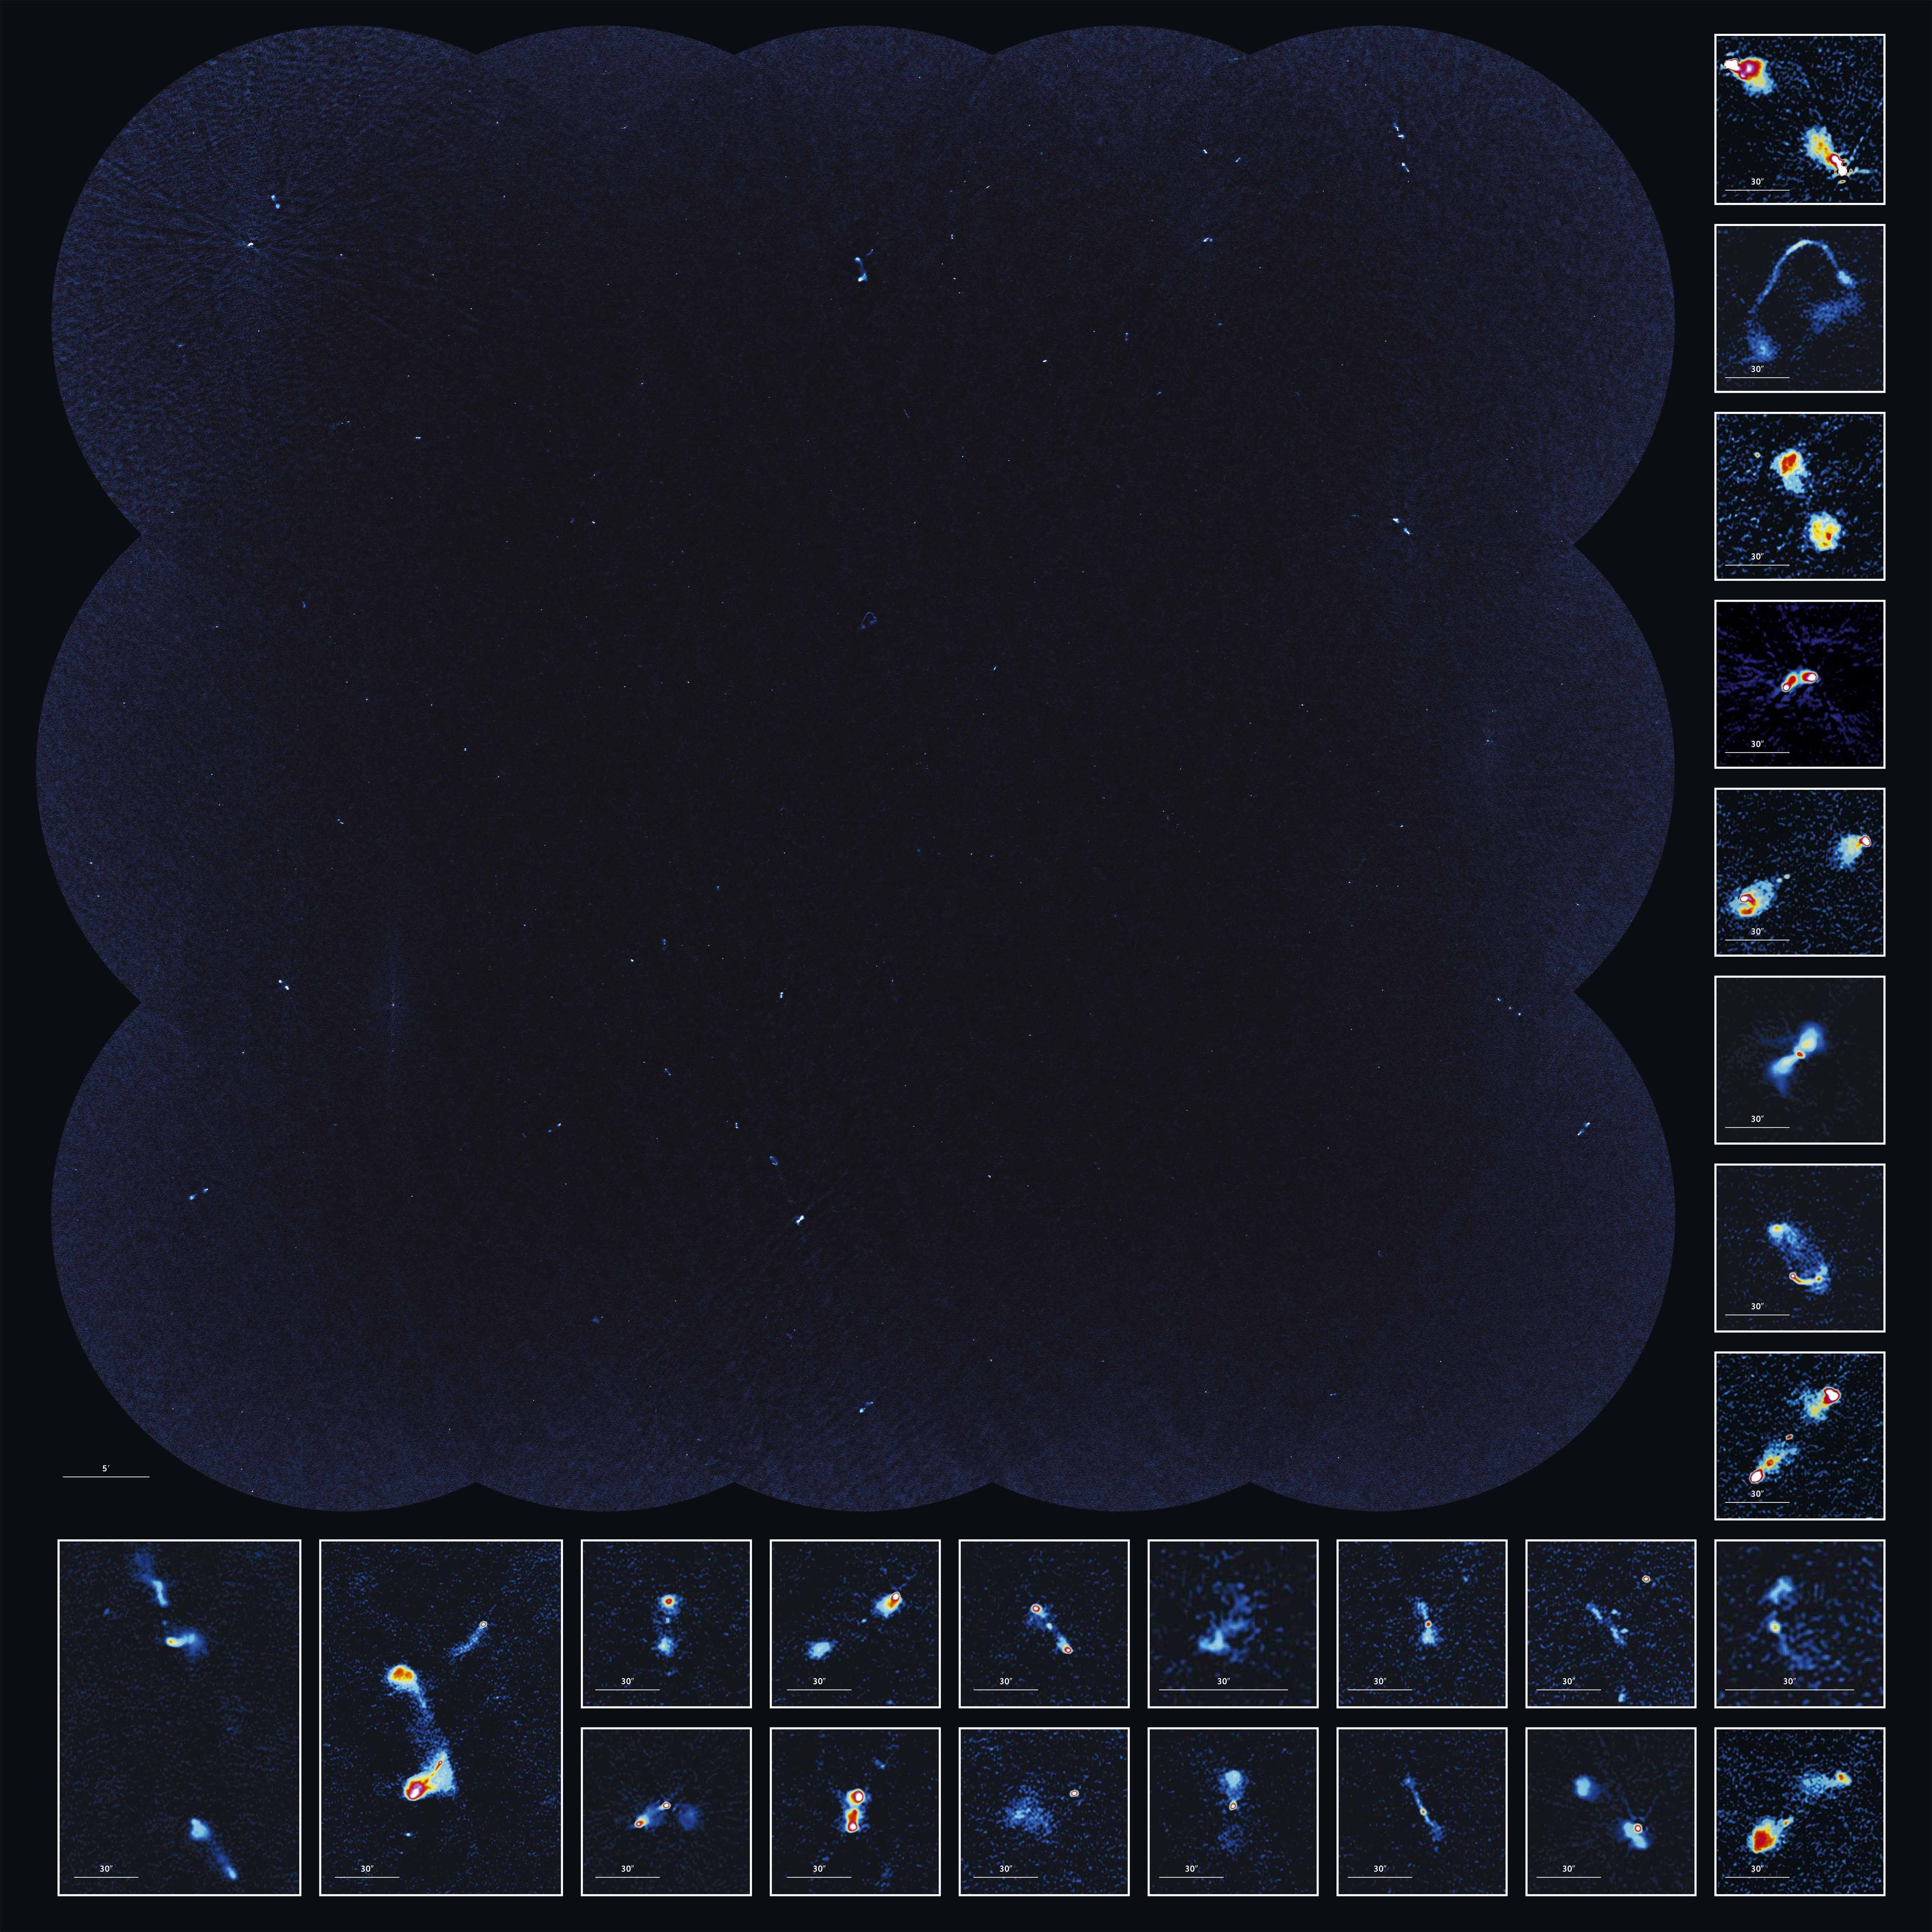
Poster showing the entire field and some zoomed-in radio sources from the VLA-COSMOS project. http://www.mpia.de/COSMOS/
Data from new telescopes, like the low-frequency LOFAR, are yielding some exciting results. One interesting result was the fact that lower-mass galaxies more commonly hosted active galactic nuclei (AGN) seen in the radio in the early Universe, at redshifts of 1 < z < 2. Galaxies with higher masses, however, had about the same fraction of radio-loud AGN at this time. It’s interpreted as being the result of more galaxies accreting matter in what’s known as “cold” or “radiative mode”, thanks to the increase in the supply of cold gas available to galaxies at earlier times (Wendy Williams, U. Hertfordshire).
Cosmology is probably being a bit underrepresented at this conference, since we only had three talks in this session. A lot of the focus was on how detecting very large samples of galaxies (both in radio continuum, like the FIRST and ATLAS surveys in RGZ data, as well as looking at spectral lines like the 21-cm hydrogen line) constrain our cosmological models. Different parameters for both dark energy and dark matter make specific predictions for how populations of galaxies evolve, including their numbers, distributions of sizes and masses, and geometrical arrangement. You can also test cosmology through gravitational lensing at radio wavelengths. It’s promising, but very challenging compared to how it’s done in optical wavelengths due to difficulties in fitting shapes in the raw visibility data (Prina Patel, U. Western Cape).
One of the talks I found really interesting (and new to me) was by Emma Storm, from GRAPPA/U. Amsterdam. She gave a great presentation on how radio observations explore the nature of dark matter. While we don’t know a huge amount about the nature of the dark matter particle, one prominent theory predicts that when they collide, the particles annihilate and produce other particles in the Standard Model that we can directly observe (like pions and gamma rays). If that’s so, then these annihilations would also produce charged particles like electrons and positrons; when those particles are accelerated in magnetic fields, they emit synchrotron radiation, which we detect in the radio. So by looking for radio emission in objects that we expect to be dominated by dark matter (like galaxy clusters), scientists can constrain the parameters of their dark matter models, particularly things like the cross-section. The signal this would produce is expected to be diffuse and weak, though; Emma’s work doesn’t detect radio emission in many clusters, but places important upper limits on the amount that could be there within the detection limits.

Limits on dark matter annihilation cross sections as a function of the particle’s mass. Each curve is an upper limit based on radio observations of a galaxy cluster (from Storm et al. 2013).
The last session of the day dealt with synergy and commensality. I normally hate things that sound like business-speak buzzwords, but in this case it is really important – we have a number of new radio telescopes coming online now or in the next several years, such as ALMA in Chile, LOFAR in Europe, and the Square Kilometer Array in Australia and South Africa. It’s quite important to plan the capabilities and designs of each so that we don’t repeat work unnecessarily, maximize the scientific output, and try to make the data and results available to as many people as possible.
Halfway over already! You can also follow what some of the other people have been discussing at the conference at the hashtag #radsurveys15.
Radio Galaxy Zoo: conferencing in Italy (Day 1)
One of the best things about being a scientist is the opportunity to attend conferences – you get to visit a new place, meet your colleagues in person, learn about what they’ve been doing, and get a chance to share your exciting research with them. I’m lucky (through the assistance of the American Astronomical Society, the Italian National Institute for Astrophysics, and the University of Minnesota) to participate in a conference this week on the future of extragalactic radio surveys in Bologna, Italy. I’m getting my first chance to share results from Radio Galaxy Zoo and to learn about other, new results in the area of extragalactic radio science!
The conference is four days, from Tuesday – Friday; I’m going to try to make a blog post each day. I’m going to try give a quick overview of all talks/posters on the day, as well as more details on talks which I thought were particularly interesting. I know I won’t do justice to many of the interesting research topics being presented, but I won’t have time to give every topic the breadth they deserve.
The first day of the workshop started with several talks covering current and upcoming surveys in radio astronomy. These include radio telescopes in the Northern Hemisphere. The two main telescopes discussed were the Very Large Array (VLA) in New Mexico, USA, which will run surveys like VLITE (a low frequency survey which will run constantly on the telescope in parallel with other observations), and VLASS, a new all-sky survey with many similarities to the current FIRST data in Radio Galaxy Zoo. LOFAR is a low-wavelength radio telescope with stations centered around Europe; it will open up similar resources, but at significantly lower frequencies than the VLA and thus probing different physical phenomena. In the Southern Hemisphere, the EMU survey in Australia and the MIGHTEE survey in South Africa will carry out similar responsibilities.
I gave a talk at the end of this session on Radio Galaxy Zoo, covering our first accepted paper and some of our early science results. If you’re interested, I’ve put my talk online here.

Example slide from Kyle Willett’s talk on Radio Galaxy Zoo at the Bologna workshop.
The afternoon had two sessions on science: one on radio continuum and star formation, and one on radio observations of the transient universe.
I think after the first day that I’m filled with a great sense of optimism about radio astronomy. We’ve got a fantastic new telescope being built in the next several years: the Square Kilometer Array. It’ll be the largest telescope ever built, addressing a huge number of scientific questions. We’re currently in the stage of building prototype telescopes, but those telescopes are already producing useful science – some of which I learned of today. We have a reasonable understanding about how things like magnetic fields affect both the formation and evolution of galaxies. Radio observations have a unique way of detecting and leveraging these detections; through polarization of the radio signal, we can measure the magnetic field and directly probe (through its signal) the interactions with matter between its source and our telescopes. New phenomena like fast radio bursts are, I think, a really neat way of measuring both the amount and distribution of matter in the Universe – this has implications for everything from star formation to cosmology.
Really excited for the rest of the week (including more Radio Galaxy Zoo results) – will post again tomorrow!
(Galaxy) Bars in the Summer
This is a guest post by Freya Pentz, who has spent much of this summer doing research with Galaxy Zoo.
Hi Galaxy Zoo volunteers!
I’m a summer student at the Zooniverse. I’m at university studying natural sciences about to go into my second year and for the past 5 weeks I’ve been working at the Zooniverse office here in Oxford. I wanted to let you know what I’ve been doing during that time.
I’ve been using data from the Galaxy Zoo: Bar Lengths project, writing code to process the information and making sure it looks sensible. Before I started working at the Zooniverse, I had done very little computing so I had to learn a lot! For those of you who are interested, I’ve been using python to extract the measurements you did on the galaxies and plotting graphs with all the data. Learning how to use python was like learning another language but it was definitely worth it.
The first thing I did was to find out how many of the galaxies that you’ve classified have bars. That meant looking at the answers to the first question about the galaxy in the Bar Lengths project ‘Does this galaxy have a bar’ and seeing for each galaxy if most people answered ‘Yes’ or if most people answered ‘No’.

Remember this question?
Luckily, the code could do that for me; otherwise I would have had to look at over 66000 answers! So far, 4960 galaxies have been classified out of a total of 8612 in the project. Your classifications show that 700 of these have a bar, meaning that the fraction of classified galaxies with a bar is around 14%. This is similar to the 10% bar fraction referred to in the study recently done by the Galaxy Zoo and CANDELS teams on bar fractions out to z=2 (blog post & paper). This number will probably change a little bit as more galaxies get classified, but it’s good that it is similar to known values so far.
The next thing was of course to find the lengths and widths of the bars. When you draw lines on the galaxy to mark the length and width, the database records this as coordinates. Each line has four coordinates, 2 x coordinates and 2 y coordinates. Once you have the coordinates, it’s fairly simple to turn them into lengths. All you need is some Pythagoras. When plotting a histogram of the lengths, the shape was a Gaussian distribution, or a bell curve. This shows that most of the galaxies have lengths between certain limits (5-15 kpc) and then as you go beyond these limits, the number of galaxies decreases.
During my time here, I found some interesting galaxies. When I first looked at the redshifts, there was a galaxy with a redshift of 4.25. I mentioned this to a couple of people on the Zooniverse team and they all said there wouldn’t be a galaxy with such a high redshift in the sample. I checked it out and this is the galaxy in question:

The galaxy that fooled the computer into thinking it had a redshift of 4.25
You can see that there is a bright blue smudge in the top left of the galaxy. When I first saw this, I thought it was a lens. It looks like one, and you can just see a small bit of blue on the other side of the galaxy’s core, suggesting a lens even more. According to the experts in the Zooniverse however, this is probably not a lens, as the galaxy does not look massive enough to lens light. Also, the blue curve is well inside the galaxy, instead of being around the outside. Usually, all the mass of the galaxy is needed to lens an object so the light would appear around the edge. The blue curve is most likely an unusual feature of the galaxy itself, which can explain why the reported redshift is so high. The redshift for this galaxy was measured photometrically. This is where astronomers use galaxy colours across a wide range of wavelengths to predict the likely redshift. This method of measuring redshift is much more prone to error than spectrometry (where the absorption lines for certain elements in a galaxy are observed and the shift of these lines is measured) so the blue smudge could have easily made the telescope think the redshift was higher than it is. This redshift is therefore almost definitely a mistake. We also know this from the high resolution of the image. You normally wouldn’t be able to see a galaxy with even a redshift of 1 this well!
The reason telescopes have to use photometric redshifts sometimes even though they are often wrong is that there is not enough time to take a spectrum of every galaxy when you are conducting a large survey of the sky. Telescope time is expensive and photometric measurements allow you to get a bit of information about lots of galaxies which can sometimes be more useful that getting a lot of information about a few.
When running into problems like this it was really useful to be able to look at a picture of the galaxy on the Galaxy Zoo: Bar Lengths website. Looking at the galaxies and seeing in real life what the data on the graphs was telling me was probably my favourite part of my time at the Zooniverse. It’s so amazing that thanks to the Sloan Digital Sky Survey, the Hubble Space Telescope projects and other mass surveys of the universe, we can actually look at pictures of thousands of galaxies easily.
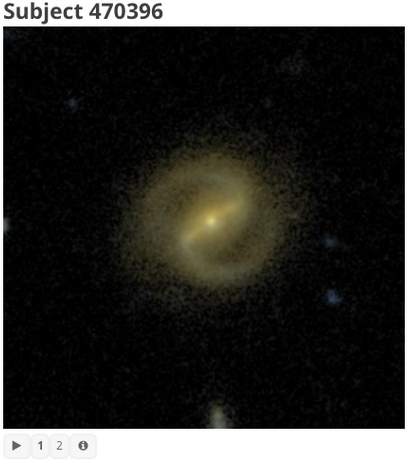
A cool barred galaxy you can see in Bar Lengths
The Zooniverse is such a cool organisation and I’m lucky to have worked for them this summer. The great thing about them is that you can get involved too! I know from my work with Bar Lengths that even if a few people log on and classify in any of the projects, it can be really helpful. None of the science can be done without you providing the data.
Measure some galaxies here:
www.zooniverse.org/projects/vrooje/galaxy-zoo-bar-lengths/classify/
Or have a look at some of the other projects here:
Freya
New images for Galaxy Zoo! Part 2 – Illustris
We’re extremely excited to announce the launch of two new image sets today on Galaxy Zoo. Working with some new scientific collaborators over the past few months, we’ve been able to access data from two new sources. This blogpost will go into more details on where the images come from, what you might expect to see, and what scientific questions your classifications will help us answer. (See Part 1 of this post to learn about the other new images from the DECaLS survey).
The second set of new data comes from the Illustris Project. Illustris is a state-of-the-art simulation of the Universe, led by a large team of researchers in the US, UK, and Germany. Large-scale cosmological simulations are a critical tool in astronomy; since we don’t have laboratories where we can replicate the conditions of processes like galaxy formation, we use computer simulations to investigate them instead. Such simulations start with what we believe conditions in the very early Universe were like (which we infer from the cosmic microwave background), and can include both dark matter and baryons (particles like protons and neutrons that eventually form the stars, dust and gas in galaxies). The simulation then tracks what happens to the matter and energy over billions of years as the Universe expands, evolving according to the laws of physics that are programmed into the simulation. This includes relations like the law of gravity, which dominates how dark matter moves, and hydrodynamics, which describe the motions of the gas. It’s truly amazing – scientists can watch galaxies form and evolve over huge scales of distance and time, and compare the results to real observations to test if the physics of the simulations are correct. Illustris is one of the largest and most detailed simulations ever run, taking more than 19 million CPU hours to run on powerful supercomputers.

A large-scale projection through the Illustris volume at redshift z=0, centered on a massive cluster. The left side of the image shows the density of dark matter, while the right side shows the density of the gas in cosmic baryons. Image and text courtesy of the Illustris project.
This comparison to real data is the key feature that sparked the collaboration between Illustris and Galaxy Zoo. Once the simulation is run, astronomers analyze the results to see if their galaxies match the properties of those seen in the real Universe. This includes measurements like the total number of stars formed, the ratio of stars to dark matter, and the distribution of galaxies of different masses and luminosities. Another critical parameter we want to compare is galaxy morphology; measuring the ratio of ellipticals to spirals, for example, is an important test of whether the galaxy merger rate is correct, and if the simulation codes for star formation and gravitational interaction are correct.
The Illustris scientists have created images of the galaxies from their simulation that GZ volunteers will classify by their morphology. Our comparison data set for this will be the SDSS results from Galaxy Zoo 2, and the images are designed to match the Sloan images as closely as possible. This includes the same set of filters for the telescope, sizing the images so that the galaxies look like they’re at cosmic distance from the Milky Way, and setting them against backgrounds of stars and other galaxies. The quality of the simulations and images are amazing – these look to me like real galaxies in every way. It’s something that astronomers definitely couldn’t do ten years ago.

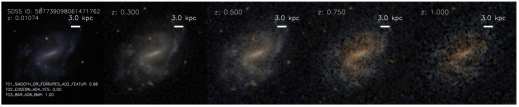
Two galaxies from the Illustris simulation evolving in time from left to right, from when the universe was a quarter its current age, to the present. The top galaxy shows a massive, red, elliptical-shaped galaxy forming after a series of mergers with other systems. The bottom galaxy reveals the formation of a smaller, bluer, disk-shaped galaxy forming after a less violent history of interactions. Images and text courtesy of the Illustris project.
Although these images aren’t of “real” galaxies, we want to emphasize again how much your classifications will help scientists to do astronomical research. Simulations like Illustris are the only way that we can probe galaxy formation and evolution as it happens. Your classifications, both from Galaxy Zoo 2 and from the new Illustris data, provide vital tests for the output and will be fed back to the science teams in order to improve future versions of these sims.
If you have questions or want to discuss anything you see in the new images, please join the discussion with scientists and volunteers on Talk. The Illustris Project also has some amazing online tools if you want to learn more, including an interactive explorer of the simulation and videos of the evolving Universe. You also can explore specific galaxies you’ve classified via GZ:Examine. As always, thanks to everyone for your help!
New images for Galaxy Zoo! Part 1 – DECaLS
We’re extremely excited to announce the launch of two new image sets today on Galaxy Zoo. Working with some new scientific collaborators over the past few months, we’ve been able to access data from two new sources. This blogpost will go into more details on where the images come from, what you might expect to see, and what scientific questions your classifications will help us answer. Part 2 of this post will discuss the other set of new images from the Illustris simulation.
The Dark Energy Camera Legacy Survey (DECaLS) is a public optical imaging project that follows up on the enormous, groundbreaking work done by the various versions of the SDSS surveys over the past decade. The aim of DECaLS is to use larger telescopes to get deeper images with significantly better data quality than SDSS, although over a somewhat smaller area. The science goals include studies of how both baryons (stars, gas, dust) and dark matter are distributed in galaxies, and particularly in measuring how those ratios change as a galaxy evolves. By adding morphology from Galaxy Zoo, our joint science teams will explore topics including disk structure in lower mass galaxies, better constraints on the rate at which galaxies merge, and gather more data on how the morphology relates to galaxy color and environment.
DECaLS observations use the Blanco telescope, which is located at CTIO in northern Chile at an altitude of 2200m (7200 ft). The telescope has a 4-m aperture mirror, giving it more than three times the collecting area of the SDSS telescope. The camera used for the survey is named DECam, a large-area and extremely sensitive instrument developed for a separate program called the Dark Energy Survey. The camera has 570 megapixels and covers a 2.2 degree field of view – more than 20 times the apparent size of the full moon! The combination of the exquisite dark-sky observing site, a sensitive wide-field camera, and larger telescope all combine to generate the new images, which will eventually include more than 140 million unique sources on the sky when DECaLS is finished.
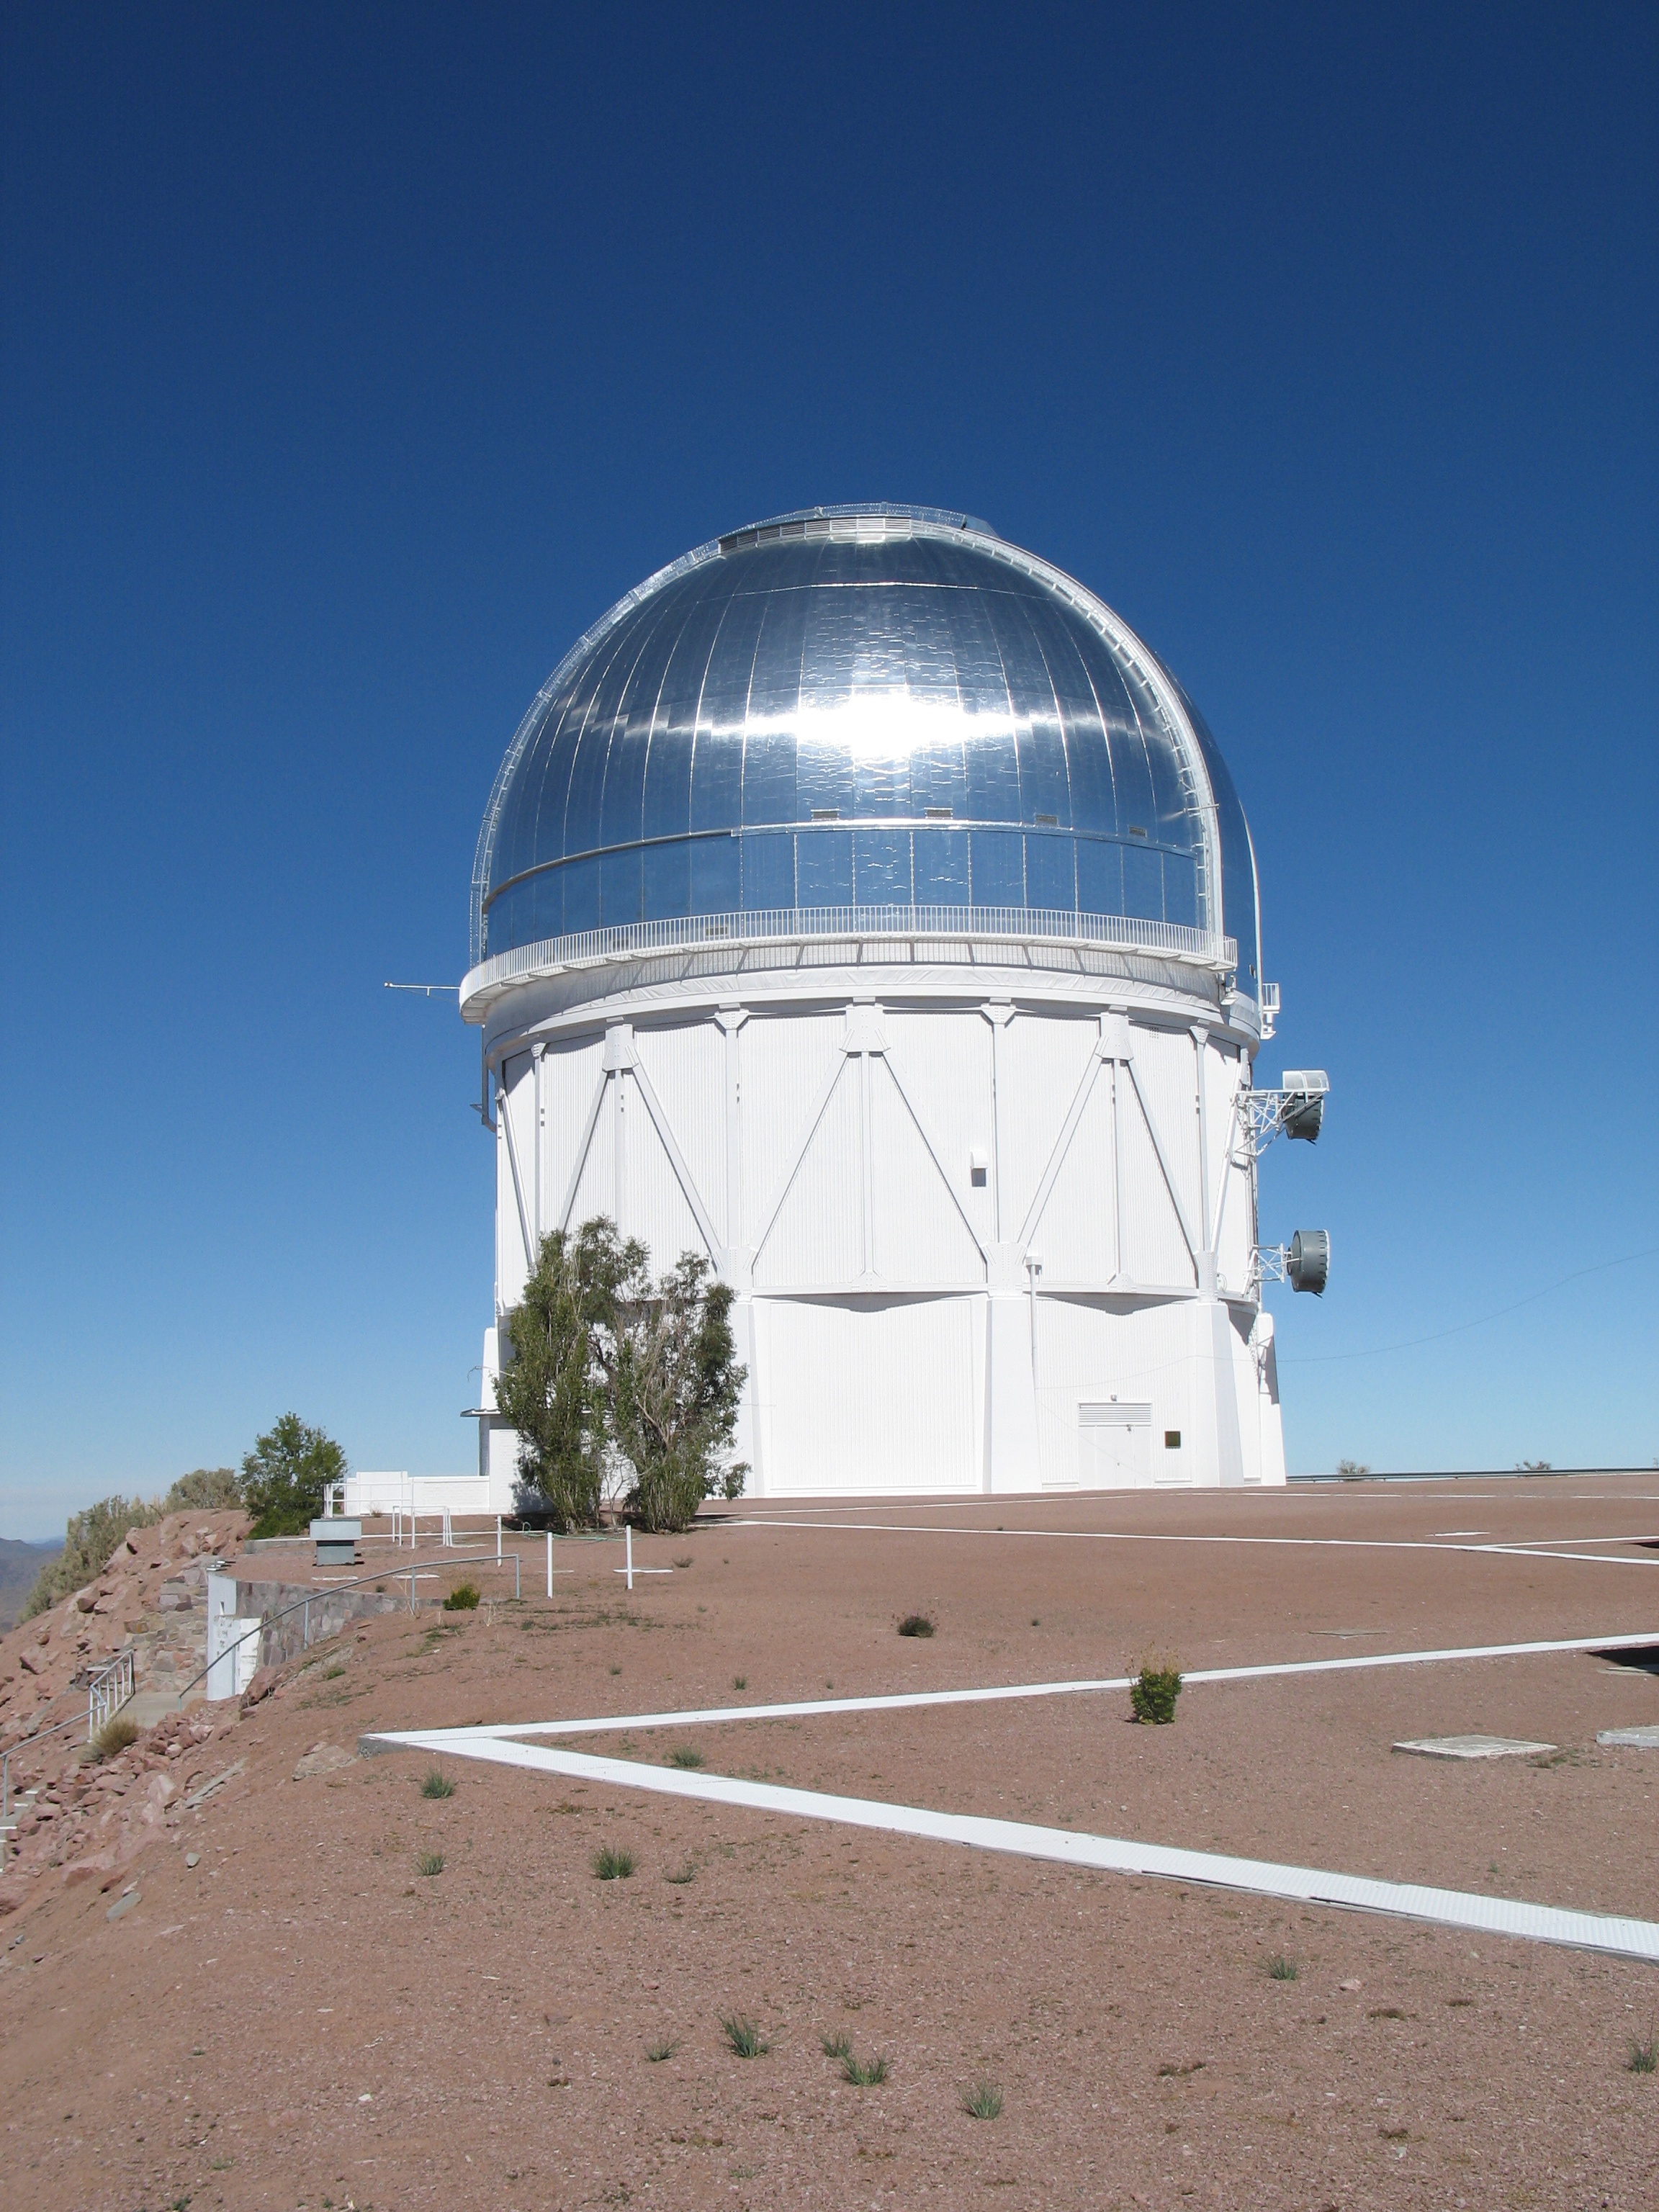
The Victor M. Blanco 4m telescope, located at CTIO in northern Chile, is carrying out the observations for the DECaLS survey. Image courtesy NOAO.
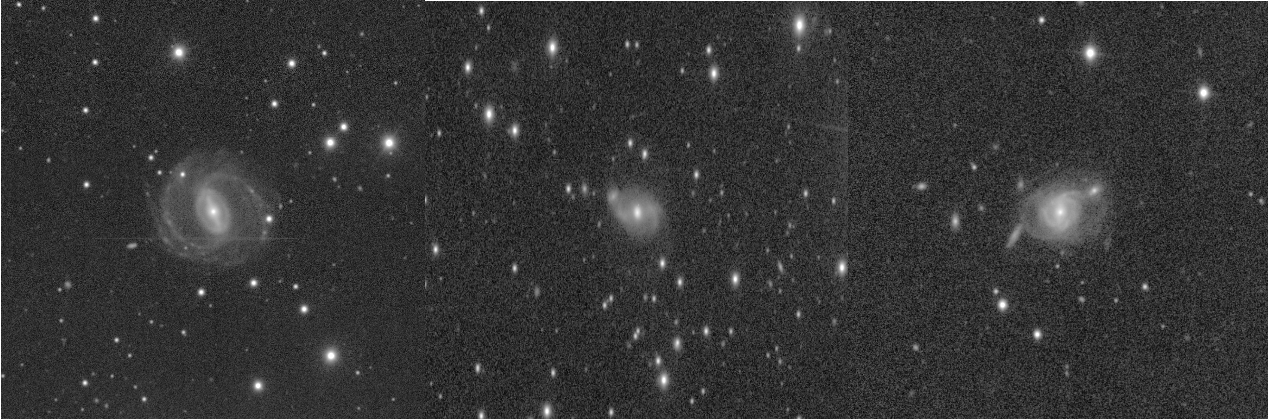
The DECaLS images in Galaxy Zoo are a smaller group taken from a catalog called the NASA-Sloan Atlas. We’re focusing on somewhat larger and brighter galaxies from the catalog. The reason is that although many of these galaxies have been classified in GZ already via their Sloan images, we’re particularly interested in measuring details like tidal tails from mergers, seeing fainter spiral structures, and separating galaxies that couldn’t be individually resolved in the Sloan data. Here’s a great example of a single galaxy in both SDSS and DECaLS – check out how much clearer the spiral arms are in the new images!

Left: an SDSS image of the galaxy J225336.34+000347.4. Right: a DECaLS image of the same galaxy.
Almost all of the morphology and classification tasks are the same as they were for the Sloan images, so it should be familiar to most of our users. If you have questions or want to discuss anything you see in the new images, please join the discussion with scientists and volunteers on Talk. As always, thanks for your help!
Summer Research With Galaxy Zoo
The below blog post was written by Alex Todd, an Ogden Summer Intern who spent the summer working on Galaxy Zoo related research projects at the University of Portsmouth. Alex is now off to his next adventure – starting his undergraduate degree in Natural Sciences at the University of Bath.

Alex hard at work on his Galaxy Zoo project.
I have been working with the Galaxy Zoo team at the Institute of Cosmology and Gravitation, in Portsmouth, for 8 weeks this summer. I have been analysing the results of Galaxy Zoo 2, and more specifically the region of the sky known as Stripe 82. In this area, the Sloan Digital Sky Survey (SDSS) took many images of the same patch of sky, instead of only one. These images were combined to produce a single, higher quality image, which showed fainter details and objects. Both these deeper images and the standard depth images of stripe 82 were put into galaxy zoo, and I have been comparing the resulting classifications. I learned to code in python, a programming language, and used it to produce graphs from the data I downloaded from the Galaxy Zoo website. I started by comparing the results directly, comparing the number of people who said that the galaxy had features in each of the image depths.

On the graph, each blue dot is a galaxy (there are around 4,000) and the red dashed line shows the overall trend. As you can see from the graph, when the proportion of people who see features is low, there is a good match between the two image depths. However, when the proportion is high, there is a much bigger difference between the two image depths, with the proportion being higher in the deep image. This is because fainter features are visible in the deeper image.
I then plotted graphs of the difference between the proportions (P(Features)) against the brightness of the galaxy. To measure the brightness, I used the apparent magnitude, a measure of how bright the galaxy appears to us (as opposed to how bright it actually is).
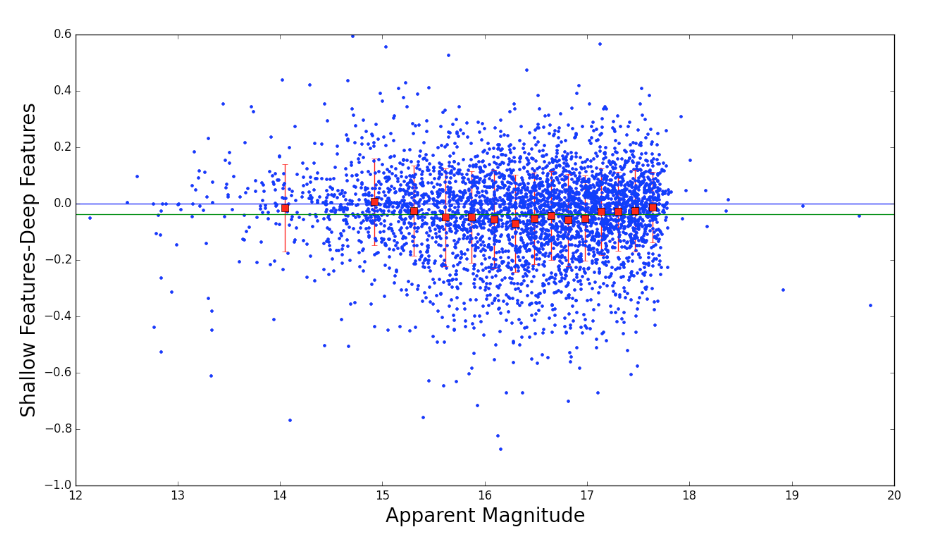
The graph below shows the difference in P(Features) plotted against the apparent magnitude. The blue line is at y=0, and the green line represents the average value of the difference between P(Features). As you can see, there is not much difference between the values of P(Features) when the galaxy is particularly bright (Small apparent magnitude) or when it is particularly dim (large apparent magnitude). However, when the galaxy has an average brightness, the difference is quite substantial. We think this is because in bright galaxies, features can be seen in both images, whilst in dim galaxies they can be seen in neither. In medium brightness galaxies, however, they can only be seen in the deeper image. The fact that there are differences between the classifications means that it would be a good idea to classify deeper images of the rest of the sky, to hopefully improve the accuracy of the classifications.
I have greatly enjoyed my time working on at the ICG on galaxy zoo, and would certainly seize the opportunity to pursue it further.
It’s been a pleasure working with Alex this summer. He really impressed me with the speed at which he picked up programming languages. This information about the differences in perception of morphological features between deeper and shallower images is very useful to us as a science team as we plan for future generations of the Galaxy Zoo project with new, more sensitive images from current and ongoing astronomical surveys.


First Radio Galaxy Zoo paper has been accepted!
The first Radio Galaxy Zoo paper has been accepted by the Monthly Notices of the Royal Astronomical Society (MNRAS) and is available today on astro-ph. The paper entitled “Radio Galaxy Zoo: host galaxies and radio morphologies derived from visual inspection” outlines the project and provides the first look into some of the science that has come from Radio Galaxy Zoo.
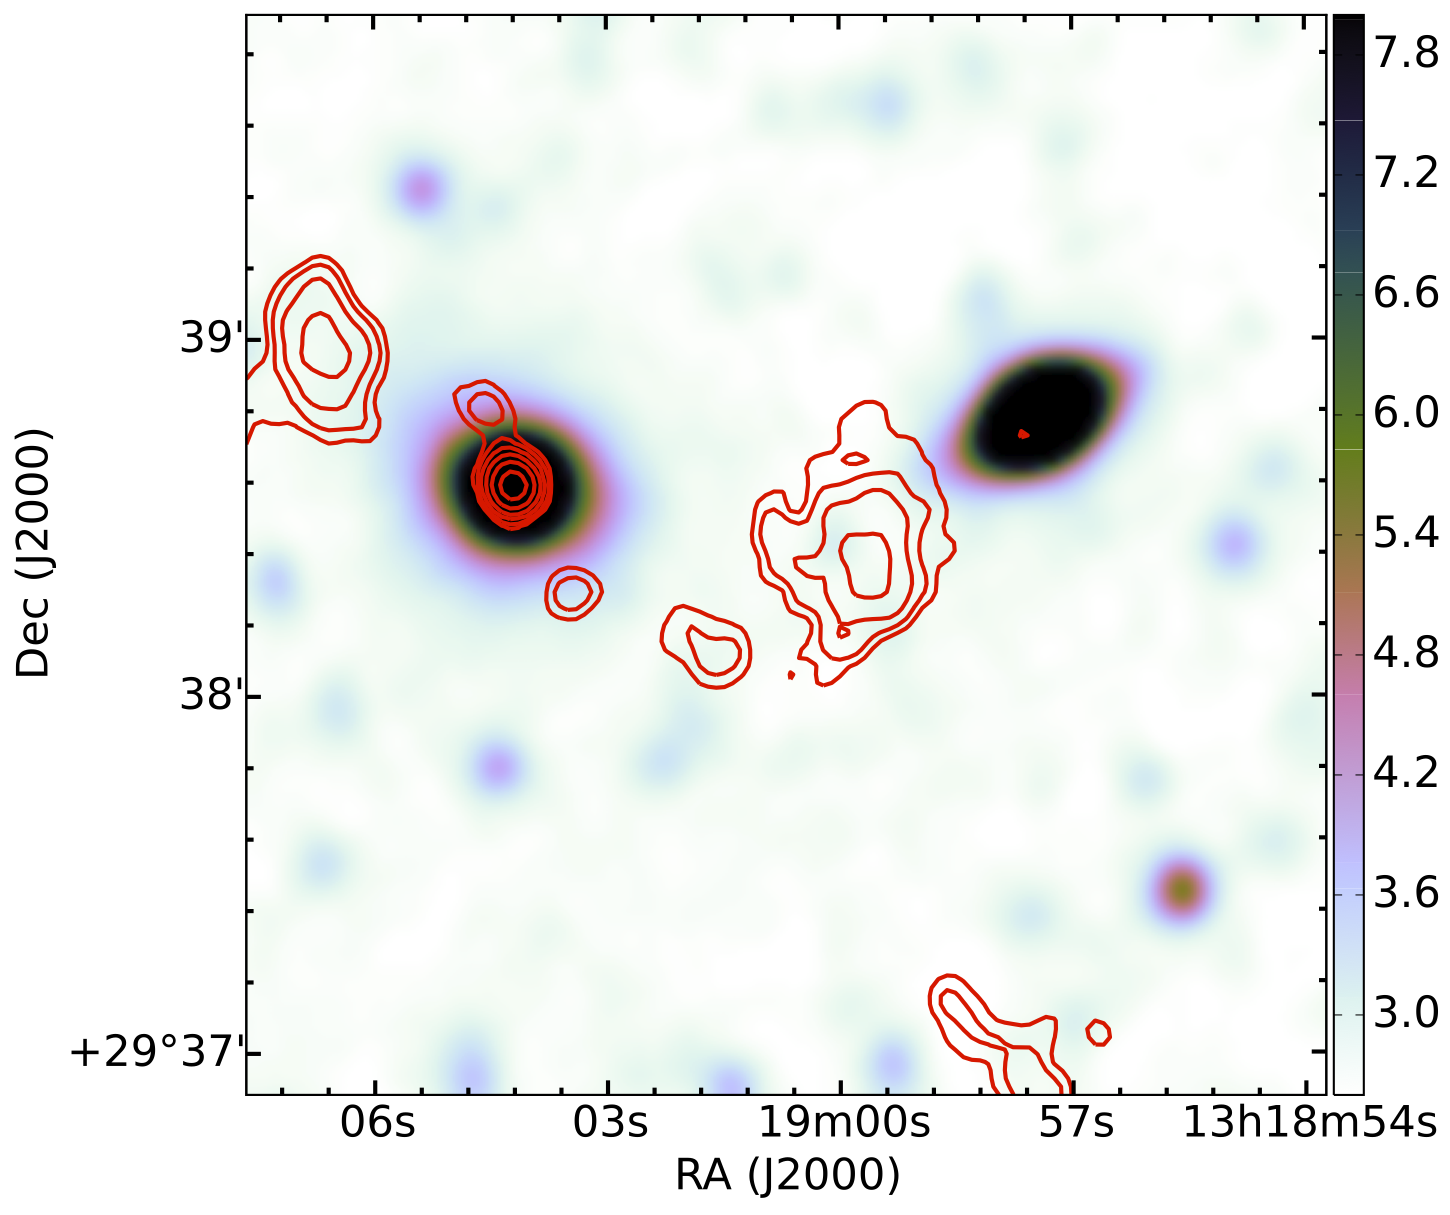
Fig. 1. An example of a galaxy where visual identification of the radio components is necessary. the automated algorithms would have classified the non-core emission as independent sources, whereas RGZ volunteers (in agreement with the science team) find all five radio emission components in the upper half of the image to be related to the same source.
As mentioned in our previous article about the paper, we find that the RGZ citizen scientists are as effective as the RGZ science team in identifying the radio sources and the host galaxies. The project now has over 7500 citizen scientists and their contributions are individually acknowledged at http://rgzauthors.galaxyzoo.org
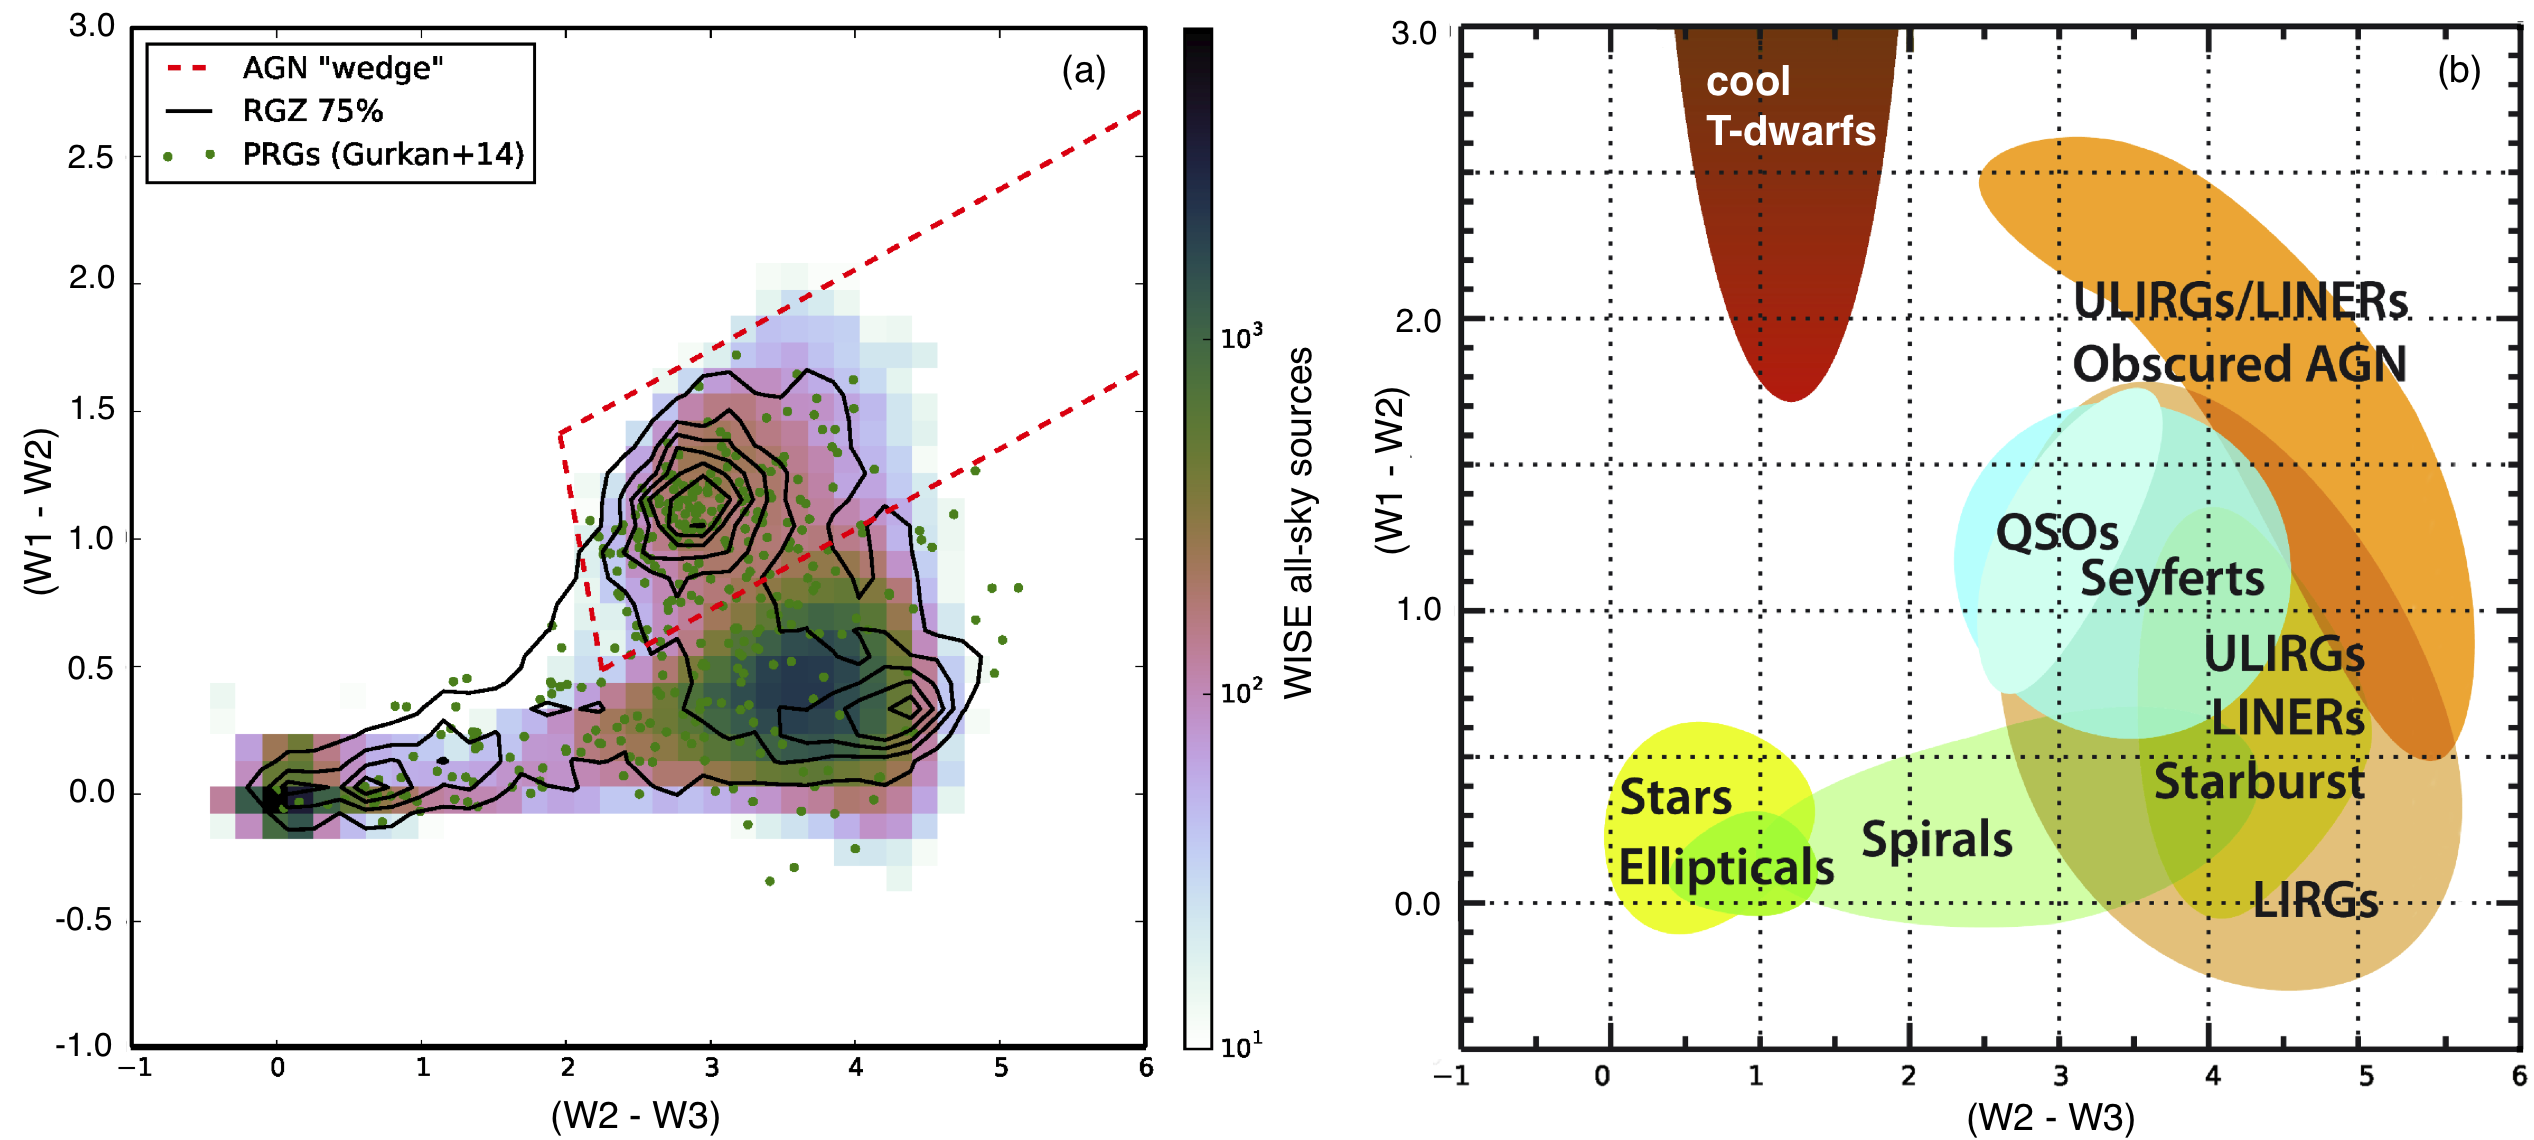
Fig. 2. (a) WISE colour-colour diagram showing approximately 100,000 WISE all-sky sources (colourmap), 4614 RGZ sources (black contours), and powerful radio galaxies (green points). (b) WISE colour-colour diagram showing the locations of various classes of astrophysical objects from Wright et al. (2010).
Using the classifications of the WISE infrared host galaxies, we find that the majority of the host galaxies are located in the WISE colour space consisting of elliptical galaxies, quasi-stellar objects (QSOs), and luminous infrared radio galaxies (LIRGs) – see Fig. 2. Upon closer examination of the RGZ objects that are identified as elliptical galaxies in the WISE W1-W2< 0.5 colour space we note that our current sample shows a possible large population of star-forming galaxies and/or ellipticals with enhanced dust – see Fig. 3.
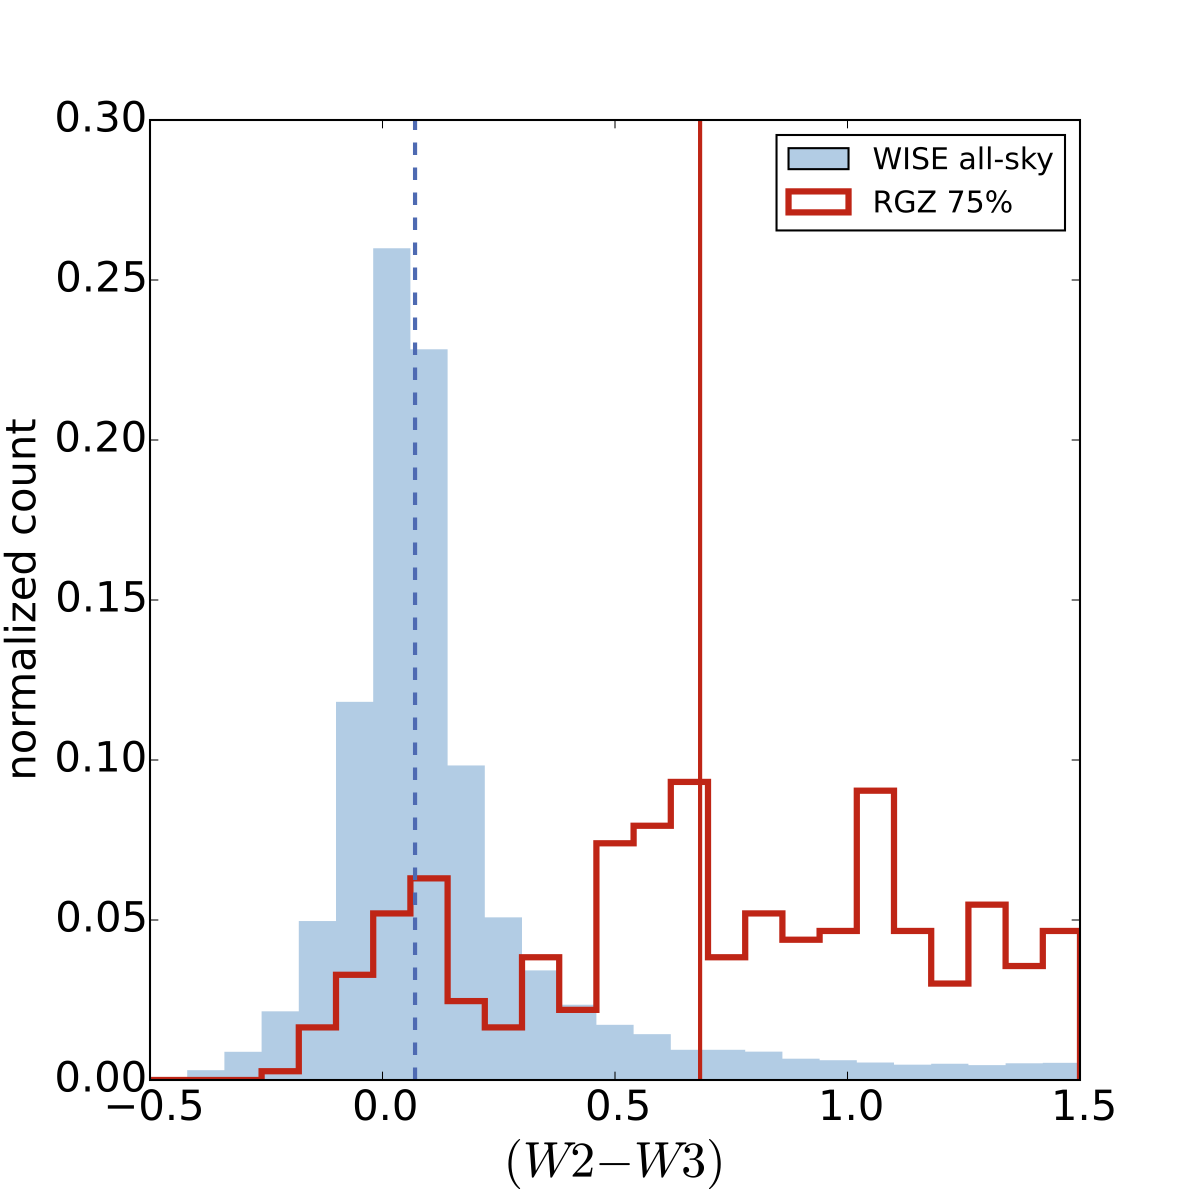
Fig. 3. Distribution of (W2 – W3) infrared colours for objects near the region identified as elliptical galaxies (W1 – W2) < 0.5. Solid and dashed vertical lines show the median colours of the all-sky and RGZ sources. While sources randomly selected from the WISE all-sky sample peak near (W2 – W3) = 0, our current RGZ sample shows a large population with significantly redder colours – possibly from star-forming galaxies and/or ellipticals with enhanced dust.
We still have a lot of radio sources in our project that need classification and we hope to continue the great work from all our citizen scientists and science team. Don’t forget to head over to Radio Talk for interesting discussions on objects or some of the science in general.
Thank you once again for your hard work and support throughout the first years of Radio Galaxy Zoo!
Eight Years of Galaxy Zoo
It’s our eighth birthday! The team have done a great job exploring the various ways the number eight connects to the Galaxy Zoo Universe and that collection of blogs does a brilliant job of illustrating the dramatic variety of places we’ve explored together. Some of them were familiar, but others we didn’t even dream of before the start of the project.

An 8 for our 8th birthday!
Once you start thinking about it, thinking of Galaxy Zoo as an exploration, as a journey undertaken as a group makes a lot of sense. Lots of you have joined us for the whole journey, as we’ve travelled further and further from familiar ground, while others – just as welcome – have walked only a little way. The science team, too, has grown as it has become apparent quite how much can be done with your classifications, and the whole grand parade has attracted a following of computer scientists, web developers and other assorted camp followers.
I’m writing this on my way to report on the arrival of New Horizons at Pluto for the Sky at Night. For the first time, we’ll see close up images of a world that until now has been little more than a point of light. The missions is part of the glorious tradition of Solar System exploration, but our journey through the datasets provided by the Sloan Digital Sky Survey and by Hubble are voyages of exploration too. We need not travel to distant galaxies to understand them; encountering something new and never-before-seen in your web browser is thrill enough. Thanks for all the classifications of the last eight years – here’s to many more.
Chris
Eight years and eight different types of galaxy images
One of the wonderful things we’ve been able to do with Galaxy Zoo over the years is to use the same site to classify many different types of images of the sky. These include surveys that come from a range of telescopes, both on the ground and in space, images at a range of wavelengths, and covering different areas of the sky. We need these different sets of images because they drive the wide variety of scientific questions that the science team studies using galaxy morphology. As part of our celebration of eight years of Galaxy Zoo, I wanted to highlight the different datasets we’ve been able to classify over the years.
Sloan Digital Sky Survey (Legacy Sample)
The bulk of the data used in both the original Galaxy Zoo and Galaxy Zoo 2 projects. These images were taken by the SDSS telescope, located in the mountains of New Mexico, and provided almost 900,000 individual galaxies that volunteers helped to classify.
Spiral galaxies from SDSS and Galaxy Zoo (Lintott et al. 2008)

COSMOS (Hubble Space Telescope)
The Cosmological Evolution Survey (COSMOS) was a dedicated campaign to image the same 2-square-degree field of the sky with more than a dozen telescopes, from radio through X-ray. 86,314 images of galaxies in the COSMOS field taken with Hubble were classified as part of the Galaxy Zoo: Hubble project.
Unbarred spiral galaxies from COSMOS and classified in GZ: Hubble. From Melvin et al. (2014).

CANDELS (Hubble Space Telescope)
The Cosmic Assembly Near-Infrared Deep Extragalactic Legacy Survey (CANDELS) was the largest project in the history of Hubble, with the equivalent of more than four straight months of observing time. Using the near-infrared WFC3 camera, Hubble image some of the earliest massive galaxies, formed only 2-3 billion years after the Big Bang. 49,555 images from CANDELS were classified in Galaxy Zoo from 2012-2013.
Disk galaxies in GZ:CANDELS, including those without bars (top row) and those with bars (bottom row). From Simmons et al. (2014).

UKIDSS (infrared images)
The United Kingdom Infrared Telescope, located near the summit of Mauna Kea in Hawai’i, carried out a large survey at infrared wavelengths, ranging from 1 to 3 microns. This survey (UKIDSS) allows us to compare morphologies of the same galaxies between optical and infrared, probing the effects of galactic dust and different stellar populations. 70,503 galaxies from UKIDSS have been classified by Galaxy Zoo volunteers.
A spiral galaxy with dust lanes, seen in both the optical (SDSS; left) and the infrared (UKIDSS; right).

FERENGI (artificially-redshifted)
One of the critical issues with all Galaxy Zoo data has been calibration of the morphologies we measure, especially in distant galaxies where small and/or faint images can affect the accuracy of classifications. Using a piece of software called FERENGI, we artificially processed SDSS images to make them appear as if they were much further away, and we’re using those classifications to calibrate the data from Hubble. This included 6,624 images of galaxies at a range of distances and brightnesses.
An SDSS image of a barred spiral, artificially processed to appear as if it were at a variety of distances.

GOODS (Hubble Space Telescope)
The Great Observatories Origins Deep Survey (GOODS) is another multi-wavelength survey of the sky, focusing on data from NASA’s flagship space telescopes of Hubble, Chandra, and Spitzer (plus others). We not only study high-redshift galaxies using GOODS data in Galaxy Zoo, but also measure how increasing the sensitivity of the images can change the apparent morphology. 11,157 GOODS images have been classified in Galaxy Zoo at both shallow and deep imaging depths.
Comparison of the GOODS images classified in Galaxy Zoo. The left shows shallower images with only 2 sets of exposures; the right shows the deeper images with 5 sets of exposure.

Flipping spiral galaxies
One of the very first Galaxy Zoo papers addressed a fundamental question: are spiral galaxies in the Universe more likely to spin clockwise, counterclockwise, or equally likely in both directions? To measure this, we used images of spiral galaxies that were artificially flipped, which helped us correct for a psychological bias in the human brain that exhibits a slight preference for counterclockwise spins.
Images of four spiral galaxies, both as the originals (top) and horizontally flipped (bottom).

Single-band SDSS (ugriz)
The latest new set of data used SDSS galaxies again. Instead of making the “color” images that we’ve used before, however, Galaxy Zoo volunteers were asked to classify images from the five individual filters in SDSS, spanning light from the near-ultraviolet to the near-infrared. This will allow us to better measure how morphology can change as a function of observing wavelength, and determine which physical processes in the galaxy are responsible for the light that defines how we measure the shapes.
Single-band filter images of galaxies from the SDSS.
More to come soon. Thanks again for all your help with what we’ve done so far!!!
